

Key Insights
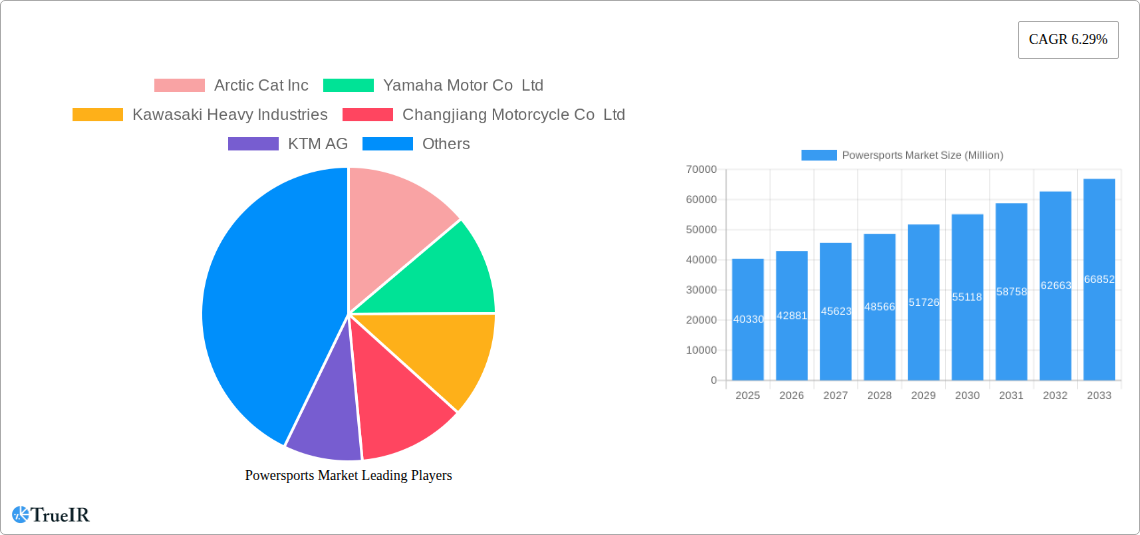
The powersports market, encompassing vehicles like ATVs, snowmobiles, motorcycles, and personal watercrafts, is experiencing robust growth, projected at a compound annual growth rate (CAGR) of 6.29% from 2019 to 2033. In 2025, the market size reached $40.33 billion. This expansion is fueled by several key factors. Rising disposable incomes, particularly in developing economies, are driving increased consumer spending on recreational vehicles. Furthermore, the increasing popularity of adventure tourism and outdoor recreational activities is significantly boosting demand. Technological advancements, such as the integration of electric propulsion systems in powersports vehicles, are also contributing to market growth by offering environmentally friendly and performance-enhanced options. The market is segmented by vehicle type (personal watercrafts, ATVs, heavyweight motorcycles, side-by-side vehicles, snowmobiles), propulsion system (diesel, gasoline, electric), and application (on-road, off-road). While gasoline remains the dominant fuel source, the electric segment is witnessing significant growth, driven by environmental concerns and technological improvements. Regional analysis reveals strong performance in North America and the Asia-Pacific region, reflecting high levels of vehicle ownership and participation in outdoor activities. However, regulatory changes concerning emissions and safety standards, along with potential economic downturns, pose challenges to sustained growth. The competitive landscape is marked by a mix of established players like Polaris, Yamaha, and Honda, alongside emerging brands vying for market share. The future trajectory of the market hinges on successful navigation of these factors, including continued innovation in technology, strategic expansion into new markets, and effective management of regulatory compliance.
The competitive landscape is dynamic, with both established manufacturers and new entrants vying for market share. Strategies such as product diversification, targeted marketing campaigns, and strategic partnerships will be crucial for success in this competitive environment. The continued development of sustainable technologies, including the wider adoption of electric powertrains, will shape future market growth and consumer preferences. Furthermore, the increasing emphasis on safety features and regulations will influence product design and consumer choice. The market's future success will depend on the ability of manufacturers to adapt to evolving consumer demands, technological advancements, and market regulations. Projections for future growth will depend largely on macroeconomic factors, consumer confidence, and ongoing innovation within the industry.
Powersports Market Report: 2019-2033 Forecast
This comprehensive report delivers an in-depth analysis of the global Powersports market, providing invaluable insights for industry stakeholders. Covering the period from 2019 to 2033, with a focus on 2025, this report explores market size, segmentation, competitive dynamics, and future trends. Expect detailed analysis of key players like Arctic Cat Inc, Yamaha Motor Co Ltd, Kawasaki Heavy Industries, Changjiang Motorcycle Co Ltd, KTM AG, Harley-Davidson Inc, BRP Inc, Honda Motor Co Ltd, Polaris Inc, and Suzuki Motor Corporation, alongside emerging industry disruptors. The report incorporates both qualitative and quantitative data, leveraging high-impact keywords to ensure optimal search engine visibility and enhance your understanding of this dynamic market. The market is projected to reach xx Million by 2033.
Powersports Market Structure & Competitive Landscape
The Powersports market exhibits a moderately concentrated structure, with several dominant players and a growing number of niche players. Market concentration ratios (e.g., CR4, CR8) will be analyzed within the report, revealing the extent of market dominance by major players. Innovation is a key driver, with ongoing developments in engine technology (electric, gasoline, diesel), vehicle design (improved safety features, enhanced comfort), and connected technology. Regulatory changes, particularly concerning emissions standards and safety regulations, significantly impact market dynamics. Product substitutes, such as alternative forms of recreation and transportation, pose a moderate competitive threat. End-user segmentation includes recreational users, professional riders, and commercial users (e.g., rentals, tours). Mergers and acquisitions (M&A) activity within the Powersports sector is substantial, with a total M&A volume of xx Million observed in the historical period (2019-2024), indicating a highly competitive landscape with businesses actively seeking to consolidate market share and expand their product offerings.
Powersports Market Trends & Opportunities
The global Powersports market is experiencing significant growth, projected to reach xx Million by 2033. This expansion is driven by several key trends. Technological advancements, particularly the rise of electric vehicles and connected technologies, are reshaping the landscape. Consumer preferences are shifting towards more versatile and technologically advanced vehicles, demanding improved features such as advanced safety systems, improved fuel efficiency, and enhanced connectivity. Competitive dynamics are intensifying, with both established players and newcomers vying for market share through product innovation, strategic partnerships, and aggressive marketing campaigns. The Compound Annual Growth Rate (CAGR) is estimated to be xx% during the forecast period (2025-2033). Market penetration rates for electric Powersports vehicles are expected to show substantial growth in the coming years, driven by government incentives and increasing consumer awareness of environmental concerns.

Dominant Markets & Segments in Powersports Market
The North American market currently holds the largest share of the global Powersports market, driven by high levels of disposable income, a strong recreational culture, and favorable regulatory environments. Within vehicle types, All-terrain vehicles (ATVs) and Side-by-Side vehicles (SxS) represent significant market segments, largely due to their adaptability for diverse recreational pursuits and work applications. Gasoline remains the dominant propulsion type, albeit with a growing presence of electric propulsion, particularly in smaller vehicle categories. The Off-Road application segment holds the largest market share, reflecting the inherent nature of many Powersports vehicles.
Key Growth Drivers:
- Strong consumer demand for recreational activities.
- Increasing disposable income in key markets.
- Development of advanced technologies in vehicle manufacturing.
- Favorable government policies promoting outdoor recreation.
- Expansion of off-road trails and recreational areas.
The market dominance of these segments is likely to persist in the forecast period due to continued product innovation and expanding market penetration in emerging economies.
Powersports Market Product Analysis
Recent product innovations focus on enhancing safety, performance, and connectivity. Advanced suspension systems, improved engine technologies, and integrated infotainment systems are prominent features in new models. The competitive advantage lies in offering a combination of superior performance, reliable technology, and appealing design. The market's preference for customization and personalization is also driving product diversification.
Key Drivers, Barriers & Challenges in Powersports Market
Key Drivers:
Technological advancements in engine technology (electric, hybrid), safety features, and connectivity are key drivers. Economic factors, such as rising disposable incomes in emerging markets, fuel market growth. Government policies promoting tourism and outdoor recreation further stimulate demand.
Key Challenges & Restraints:
Supply chain disruptions and component shortages have impacted production and sales. Stringent emission regulations and safety standards create manufacturing hurdles. Intense competition, particularly from established players, is a considerable challenge. These factors can lead to price fluctuations and reduced profit margins, potentially limiting market expansion.
Growth Drivers in the Powersports Market
Rising disposable incomes in developing countries, coupled with a growing interest in outdoor recreation, are driving market growth. Government initiatives promoting tourism and sustainable transportation are also contributing factors. Technological advancements, particularly in electric propulsion and connectivity, are attracting new customer segments and shaping future growth trajectories.
Challenges Impacting Powersports Market Growth
Stringent emission standards and safety regulations increase manufacturing costs and complexity. The global chip shortage, supply chain disruptions, and increasing raw material prices pose considerable challenges. Intense competition from established players and the emergence of new market entrants exert pressure on pricing and profitability.
Key Players Shaping the Powersports Market Market
- Arctic Cat Inc
- Yamaha Motor Co Ltd
- Kawasaki Heavy Industries
- Changjiang Motorcycle Co Ltd
- KTM AG
- Harley-Davidson Inc
- BRP Inc
- Honda Motor Co Ltd
- Polaris Inc
- Suzuki Motor Corporation
Significant Powersports Market Industry Milestones
- January 2024: Patrick Industries acquires a supplier for Powersports OEMs, expanding its market presence and offering innovative solutions.
- January 2024: Patrick Industries Inc. acquires Sportech LLC, further strengthening its position and product offerings within the Powersports sector.
- March 2023: Polaris launches Polaris Xchange, the first OEM-supported marketplace for pre-owned Powersports vehicles, streamlining the buying and selling process.
- October 2023: Cardo Systems partners with 509 to integrate communication technology into 509's helmet line, enhancing the rider experience.
Future Outlook for Powersports Market
The Powersports market is poised for continued growth, driven by ongoing technological innovation, increasing consumer demand, and favorable government policies. Strategic partnerships, product diversification, and expansion into new markets present significant opportunities for market players. The integration of electric powertrains and advanced connectivity features will further shape the industry's trajectory.
Powersports Market Segmentation
-
1. Vehicle type
- 1.1. Personal watercrafts
- 1.2. All-terrain vehicles
- 1.3. Heavy weight motorcycles
- 1.4. Side by side vehicles
- 1.5. Snow mobiles
-
2. Propulsion
- 2.1. Diesel
- 2.2. Gasoline
- 2.3. Electric
-
3. Application
- 3.1. On-Road
- 3.2. Off-Road
Powersports Market Segmentation By Geography
-
1. North America
- 1.1. US
- 1.2. Canada
- 1.3. Mexico
- 1.4. Rest of North America
-
2. Europe
- 2.1. Germany
- 2.2. UK
- 2.3. France
- 2.4. Russia
- 2.5. Spain
- 2.6. Rest of Europe
-
3. Asia Pacific
- 3.1. India
- 3.2. China
- 3.3. Japan
- 3.4. Rest of Asia Pacific
-
4. South America
- 4.1. Brazil
- 4.2. Argentina
-
5. Middle East
- 5.1. UAE
- 5.2. Saudi Arabia
- 5.3. Rest of Middle East

Powersports Market REPORT HIGHLIGHTS
| Aspects | Details |
|---|---|
| Study Period | 2019-2033 |
| Base Year | 2024 |
| Estimated Year | 2025 |
| Forecast Period | 2025-2033 |
| Historical Period | 2019-2024 |
| Growth Rate | CAGR of 6.29% from 2019-2033 |
| Segmentation |
|
Table of Contents
- 1. Introduction
- 1.1. Research Scope
- 1.2. Market Segmentation
- 1.3. Research Methodology
- 1.4. Definitions and Assumptions
- 2. Executive Summary
- 2.1. Introduction
- 3. Market Dynamics
- 3.1. Introduction
- 3.2. Market Drivers
- 3.2.1. Increasing disposable income and consumer preferences for adventure sports propel the market growth
- 3.3. Market Restrains
- 3.3.1. High initial investment and maintenance costs obstruct the market growth
- 3.4. Market Trends
- 3.4.1. Changing Consumer Preferences due to technological Advancements Drives the Demand in the Market
- 4. Market Factor Analysis
- 4.1. Porters Five Forces
- 4.2. Supply/Value Chain
- 4.3. PESTEL analysis
- 4.4. Market Entropy
- 4.5. Patent/Trademark Analysis
- 5. Global Powersports Market Analysis, Insights and Forecast, 2019-2031
- 5.1. Market Analysis, Insights and Forecast - by Vehicle type
- 5.1.1. Personal watercrafts
- 5.1.2. All-terrain vehicles
- 5.1.3. Heavy weight motorcycles
- 5.1.4. Side by side vehicles
- 5.1.5. Snow mobiles
- 5.2. Market Analysis, Insights and Forecast - by Propulsion
- 5.2.1. Diesel
- 5.2.2. Gasoline
- 5.2.3. Electric
- 5.3. Market Analysis, Insights and Forecast - by Application
- 5.3.1. On-Road
- 5.3.2. Off-Road
- 5.4. Market Analysis, Insights and Forecast - by Region
- 5.4.1. North America
- 5.4.2. Europe
- 5.4.3. Asia Pacific
- 5.4.4. South America
- 5.4.5. Middle East
- 5.1. Market Analysis, Insights and Forecast - by Vehicle type
- 6. North America Powersports Market Analysis, Insights and Forecast, 2019-2031
- 6.1. Market Analysis, Insights and Forecast - by Vehicle type
- 6.1.1. Personal watercrafts
- 6.1.2. All-terrain vehicles
- 6.1.3. Heavy weight motorcycles
- 6.1.4. Side by side vehicles
- 6.1.5. Snow mobiles
- 6.2. Market Analysis, Insights and Forecast - by Propulsion
- 6.2.1. Diesel
- 6.2.2. Gasoline
- 6.2.3. Electric
- 6.3. Market Analysis, Insights and Forecast - by Application
- 6.3.1. On-Road
- 6.3.2. Off-Road
- 6.1. Market Analysis, Insights and Forecast - by Vehicle type
- 7. Europe Powersports Market Analysis, Insights and Forecast, 2019-2031
- 7.1. Market Analysis, Insights and Forecast - by Vehicle type
- 7.1.1. Personal watercrafts
- 7.1.2. All-terrain vehicles
- 7.1.3. Heavy weight motorcycles
- 7.1.4. Side by side vehicles
- 7.1.5. Snow mobiles
- 7.2. Market Analysis, Insights and Forecast - by Propulsion
- 7.2.1. Diesel
- 7.2.2. Gasoline
- 7.2.3. Electric
- 7.3. Market Analysis, Insights and Forecast - by Application
- 7.3.1. On-Road
- 7.3.2. Off-Road
- 7.1. Market Analysis, Insights and Forecast - by Vehicle type
- 8. Asia Pacific Powersports Market Analysis, Insights and Forecast, 2019-2031
- 8.1. Market Analysis, Insights and Forecast - by Vehicle type
- 8.1.1. Personal watercrafts
- 8.1.2. All-terrain vehicles
- 8.1.3. Heavy weight motorcycles
- 8.1.4. Side by side vehicles
- 8.1.5. Snow mobiles
- 8.2. Market Analysis, Insights and Forecast - by Propulsion
- 8.2.1. Diesel
- 8.2.2. Gasoline
- 8.2.3. Electric
- 8.3. Market Analysis, Insights and Forecast - by Application
- 8.3.1. On-Road
- 8.3.2. Off-Road
- 8.1. Market Analysis, Insights and Forecast - by Vehicle type
- 9. South America Powersports Market Analysis, Insights and Forecast, 2019-2031
- 9.1. Market Analysis, Insights and Forecast - by Vehicle type
- 9.1.1. Personal watercrafts
- 9.1.2. All-terrain vehicles
- 9.1.3. Heavy weight motorcycles
- 9.1.4. Side by side vehicles
- 9.1.5. Snow mobiles
- 9.2. Market Analysis, Insights and Forecast - by Propulsion
- 9.2.1. Diesel
- 9.2.2. Gasoline
- 9.2.3. Electric
- 9.3. Market Analysis, Insights and Forecast - by Application
- 9.3.1. On-Road
- 9.3.2. Off-Road
- 9.1. Market Analysis, Insights and Forecast - by Vehicle type
- 10. Middle East Powersports Market Analysis, Insights and Forecast, 2019-2031
- 10.1. Market Analysis, Insights and Forecast - by Vehicle type
- 10.1.1. Personal watercrafts
- 10.1.2. All-terrain vehicles
- 10.1.3. Heavy weight motorcycles
- 10.1.4. Side by side vehicles
- 10.1.5. Snow mobiles
- 10.2. Market Analysis, Insights and Forecast - by Propulsion
- 10.2.1. Diesel
- 10.2.2. Gasoline
- 10.2.3. Electric
- 10.3. Market Analysis, Insights and Forecast - by Application
- 10.3.1. On-Road
- 10.3.2. Off-Road
- 10.1. Market Analysis, Insights and Forecast - by Vehicle type
- 11. North America Powersports Market Analysis, Insights and Forecast, 2019-2031
- 11.1. Market Analysis, Insights and Forecast - By Country/Sub-region
- 11.1.1 US
- 11.1.2 Canada
- 11.1.3 Mexico
- 11.1.4 Rest of North America
- 12. Europe Powersports Market Analysis, Insights and Forecast, 2019-2031
- 12.1. Market Analysis, Insights and Forecast - By Country/Sub-region
- 12.1.1 Germany
- 12.1.2 UK
- 12.1.3 France
- 12.1.4 Russia
- 12.1.5 Spain
- 12.1.6 Rest of Europe
- 13. Asia Pacific Powersports Market Analysis, Insights and Forecast, 2019-2031
- 13.1. Market Analysis, Insights and Forecast - By Country/Sub-region
- 13.1.1 India
- 13.1.2 China
- 13.1.3 Japan
- 13.1.4 Rest of Asia Pacific
- 14. South America Powersports Market Analysis, Insights and Forecast, 2019-2031
- 14.1. Market Analysis, Insights and Forecast - By Country/Sub-region
- 14.1.1 Brazil
- 14.1.2 Argentina
- 15. Middle East Powersports Market Analysis, Insights and Forecast, 2019-2031
- 15.1. Market Analysis, Insights and Forecast - By Country/Sub-region
- 15.1.1 UAE
- 15.1.2 Saudi Arabia
- 15.1.3 Rest of Middle East
- 16. Competitive Analysis
- 16.1. Global Market Share Analysis 2024
- 16.2. Company Profiles
- 16.2.1 Arctic Cat Inc
- 16.2.1.1. Overview
- 16.2.1.2. Products
- 16.2.1.3. SWOT Analysis
- 16.2.1.4. Recent Developments
- 16.2.1.5. Financials (Based on Availability)
- 16.2.2 Yamaha Motor Co Ltd
- 16.2.2.1. Overview
- 16.2.2.2. Products
- 16.2.2.3. SWOT Analysis
- 16.2.2.4. Recent Developments
- 16.2.2.5. Financials (Based on Availability)
- 16.2.3 Kawasaki Heavy Industries
- 16.2.3.1. Overview
- 16.2.3.2. Products
- 16.2.3.3. SWOT Analysis
- 16.2.3.4. Recent Developments
- 16.2.3.5. Financials (Based on Availability)
- 16.2.4 Changjiang Motorcycle Co Ltd
- 16.2.4.1. Overview
- 16.2.4.2. Products
- 16.2.4.3. SWOT Analysis
- 16.2.4.4. Recent Developments
- 16.2.4.5. Financials (Based on Availability)
- 16.2.5 KTM AG
- 16.2.5.1. Overview
- 16.2.5.2. Products
- 16.2.5.3. SWOT Analysis
- 16.2.5.4. Recent Developments
- 16.2.5.5. Financials (Based on Availability)
- 16.2.6 Harley-Davidson Inc *List Not Exhaustive
- 16.2.6.1. Overview
- 16.2.6.2. Products
- 16.2.6.3. SWOT Analysis
- 16.2.6.4. Recent Developments
- 16.2.6.5. Financials (Based on Availability)
- 16.2.7 BRP Inc
- 16.2.7.1. Overview
- 16.2.7.2. Products
- 16.2.7.3. SWOT Analysis
- 16.2.7.4. Recent Developments
- 16.2.7.5. Financials (Based on Availability)
- 16.2.8 Honda Motor Co Ltd
- 16.2.8.1. Overview
- 16.2.8.2. Products
- 16.2.8.3. SWOT Analysis
- 16.2.8.4. Recent Developments
- 16.2.8.5. Financials (Based on Availability)
- 16.2.9 Polaris Inc
- 16.2.9.1. Overview
- 16.2.9.2. Products
- 16.2.9.3. SWOT Analysis
- 16.2.9.4. Recent Developments
- 16.2.9.5. Financials (Based on Availability)
- 16.2.10 Suzuki Motor Corporation
- 16.2.10.1. Overview
- 16.2.10.2. Products
- 16.2.10.3. SWOT Analysis
- 16.2.10.4. Recent Developments
- 16.2.10.5. Financials (Based on Availability)
- 16.2.1 Arctic Cat Inc
List of Figures
- Figure 1: Global Powersports Market Revenue Breakdown (Million, %) by Region 2024 & 2032
- Figure 2: North America Powersports Market Revenue (Million), by Country 2024 & 2032
- Figure 3: North America Powersports Market Revenue Share (%), by Country 2024 & 2032
- Figure 4: Europe Powersports Market Revenue (Million), by Country 2024 & 2032
- Figure 5: Europe Powersports Market Revenue Share (%), by Country 2024 & 2032
- Figure 6: Asia Pacific Powersports Market Revenue (Million), by Country 2024 & 2032
- Figure 7: Asia Pacific Powersports Market Revenue Share (%), by Country 2024 & 2032
- Figure 8: South America Powersports Market Revenue (Million), by Country 2024 & 2032
- Figure 9: South America Powersports Market Revenue Share (%), by Country 2024 & 2032
- Figure 10: Middle East Powersports Market Revenue (Million), by Country 2024 & 2032
- Figure 11: Middle East Powersports Market Revenue Share (%), by Country 2024 & 2032
- Figure 12: North America Powersports Market Revenue (Million), by Vehicle type 2024 & 2032
- Figure 13: North America Powersports Market Revenue Share (%), by Vehicle type 2024 & 2032
- Figure 14: North America Powersports Market Revenue (Million), by Propulsion 2024 & 2032
- Figure 15: North America Powersports Market Revenue Share (%), by Propulsion 2024 & 2032
- Figure 16: North America Powersports Market Revenue (Million), by Application 2024 & 2032
- Figure 17: North America Powersports Market Revenue Share (%), by Application 2024 & 2032
- Figure 18: North America Powersports Market Revenue (Million), by Country 2024 & 2032
- Figure 19: North America Powersports Market Revenue Share (%), by Country 2024 & 2032
- Figure 20: Europe Powersports Market Revenue (Million), by Vehicle type 2024 & 2032
- Figure 21: Europe Powersports Market Revenue Share (%), by Vehicle type 2024 & 2032
- Figure 22: Europe Powersports Market Revenue (Million), by Propulsion 2024 & 2032
- Figure 23: Europe Powersports Market Revenue Share (%), by Propulsion 2024 & 2032
- Figure 24: Europe Powersports Market Revenue (Million), by Application 2024 & 2032
- Figure 25: Europe Powersports Market Revenue Share (%), by Application 2024 & 2032
- Figure 26: Europe Powersports Market Revenue (Million), by Country 2024 & 2032
- Figure 27: Europe Powersports Market Revenue Share (%), by Country 2024 & 2032
- Figure 28: Asia Pacific Powersports Market Revenue (Million), by Vehicle type 2024 & 2032
- Figure 29: Asia Pacific Powersports Market Revenue Share (%), by Vehicle type 2024 & 2032
- Figure 30: Asia Pacific Powersports Market Revenue (Million), by Propulsion 2024 & 2032
- Figure 31: Asia Pacific Powersports Market Revenue Share (%), by Propulsion 2024 & 2032
- Figure 32: Asia Pacific Powersports Market Revenue (Million), by Application 2024 & 2032
- Figure 33: Asia Pacific Powersports Market Revenue Share (%), by Application 2024 & 2032
- Figure 34: Asia Pacific Powersports Market Revenue (Million), by Country 2024 & 2032
- Figure 35: Asia Pacific Powersports Market Revenue Share (%), by Country 2024 & 2032
- Figure 36: South America Powersports Market Revenue (Million), by Vehicle type 2024 & 2032
- Figure 37: South America Powersports Market Revenue Share (%), by Vehicle type 2024 & 2032
- Figure 38: South America Powersports Market Revenue (Million), by Propulsion 2024 & 2032
- Figure 39: South America Powersports Market Revenue Share (%), by Propulsion 2024 & 2032
- Figure 40: South America Powersports Market Revenue (Million), by Application 2024 & 2032
- Figure 41: South America Powersports Market Revenue Share (%), by Application 2024 & 2032
- Figure 42: South America Powersports Market Revenue (Million), by Country 2024 & 2032
- Figure 43: South America Powersports Market Revenue Share (%), by Country 2024 & 2032
- Figure 44: Middle East Powersports Market Revenue (Million), by Vehicle type 2024 & 2032
- Figure 45: Middle East Powersports Market Revenue Share (%), by Vehicle type 2024 & 2032
- Figure 46: Middle East Powersports Market Revenue (Million), by Propulsion 2024 & 2032
- Figure 47: Middle East Powersports Market Revenue Share (%), by Propulsion 2024 & 2032
- Figure 48: Middle East Powersports Market Revenue (Million), by Application 2024 & 2032
- Figure 49: Middle East Powersports Market Revenue Share (%), by Application 2024 & 2032
- Figure 50: Middle East Powersports Market Revenue (Million), by Country 2024 & 2032
- Figure 51: Middle East Powersports Market Revenue Share (%), by Country 2024 & 2032
List of Tables
- Table 1: Global Powersports Market Revenue Million Forecast, by Region 2019 & 2032
- Table 2: Global Powersports Market Revenue Million Forecast, by Vehicle type 2019 & 2032
- Table 3: Global Powersports Market Revenue Million Forecast, by Propulsion 2019 & 2032
- Table 4: Global Powersports Market Revenue Million Forecast, by Application 2019 & 2032
- Table 5: Global Powersports Market Revenue Million Forecast, by Region 2019 & 2032
- Table 6: Global Powersports Market Revenue Million Forecast, by Country 2019 & 2032
- Table 7: US Powersports Market Revenue (Million) Forecast, by Application 2019 & 2032
- Table 8: Canada Powersports Market Revenue (Million) Forecast, by Application 2019 & 2032
- Table 9: Mexico Powersports Market Revenue (Million) Forecast, by Application 2019 & 2032
- Table 10: Rest of North America Powersports Market Revenue (Million) Forecast, by Application 2019 & 2032
- Table 11: Global Powersports Market Revenue Million Forecast, by Country 2019 & 2032
- Table 12: Germany Powersports Market Revenue (Million) Forecast, by Application 2019 & 2032
- Table 13: UK Powersports Market Revenue (Million) Forecast, by Application 2019 & 2032
- Table 14: France Powersports Market Revenue (Million) Forecast, by Application 2019 & 2032
- Table 15: Russia Powersports Market Revenue (Million) Forecast, by Application 2019 & 2032
- Table 16: Spain Powersports Market Revenue (Million) Forecast, by Application 2019 & 2032
- Table 17: Rest of Europe Powersports Market Revenue (Million) Forecast, by Application 2019 & 2032
- Table 18: Global Powersports Market Revenue Million Forecast, by Country 2019 & 2032
- Table 19: India Powersports Market Revenue (Million) Forecast, by Application 2019 & 2032
- Table 20: China Powersports Market Revenue (Million) Forecast, by Application 2019 & 2032
- Table 21: Japan Powersports Market Revenue (Million) Forecast, by Application 2019 & 2032
- Table 22: Rest of Asia Pacific Powersports Market Revenue (Million) Forecast, by Application 2019 & 2032
- Table 23: Global Powersports Market Revenue Million Forecast, by Country 2019 & 2032
- Table 24: Brazil Powersports Market Revenue (Million) Forecast, by Application 2019 & 2032
- Table 25: Argentina Powersports Market Revenue (Million) Forecast, by Application 2019 & 2032
- Table 26: Global Powersports Market Revenue Million Forecast, by Country 2019 & 2032
- Table 27: UAE Powersports Market Revenue (Million) Forecast, by Application 2019 & 2032
- Table 28: Saudi Arabia Powersports Market Revenue (Million) Forecast, by Application 2019 & 2032
- Table 29: Rest of Middle East Powersports Market Revenue (Million) Forecast, by Application 2019 & 2032
- Table 30: Global Powersports Market Revenue Million Forecast, by Vehicle type 2019 & 2032
- Table 31: Global Powersports Market Revenue Million Forecast, by Propulsion 2019 & 2032
- Table 32: Global Powersports Market Revenue Million Forecast, by Application 2019 & 2032
- Table 33: Global Powersports Market Revenue Million Forecast, by Country 2019 & 2032
- Table 34: US Powersports Market Revenue (Million) Forecast, by Application 2019 & 2032
- Table 35: Canada Powersports Market Revenue (Million) Forecast, by Application 2019 & 2032
- Table 36: Mexico Powersports Market Revenue (Million) Forecast, by Application 2019 & 2032
- Table 37: Rest of North America Powersports Market Revenue (Million) Forecast, by Application 2019 & 2032
- Table 38: Global Powersports Market Revenue Million Forecast, by Vehicle type 2019 & 2032
- Table 39: Global Powersports Market Revenue Million Forecast, by Propulsion 2019 & 2032
- Table 40: Global Powersports Market Revenue Million Forecast, by Application 2019 & 2032
- Table 41: Global Powersports Market Revenue Million Forecast, by Country 2019 & 2032
- Table 42: Germany Powersports Market Revenue (Million) Forecast, by Application 2019 & 2032
- Table 43: UK Powersports Market Revenue (Million) Forecast, by Application 2019 & 2032
- Table 44: France Powersports Market Revenue (Million) Forecast, by Application 2019 & 2032
- Table 45: Russia Powersports Market Revenue (Million) Forecast, by Application 2019 & 2032
- Table 46: Spain Powersports Market Revenue (Million) Forecast, by Application 2019 & 2032
- Table 47: Rest of Europe Powersports Market Revenue (Million) Forecast, by Application 2019 & 2032
- Table 48: Global Powersports Market Revenue Million Forecast, by Vehicle type 2019 & 2032
- Table 49: Global Powersports Market Revenue Million Forecast, by Propulsion 2019 & 2032
- Table 50: Global Powersports Market Revenue Million Forecast, by Application 2019 & 2032
- Table 51: Global Powersports Market Revenue Million Forecast, by Country 2019 & 2032
- Table 52: India Powersports Market Revenue (Million) Forecast, by Application 2019 & 2032
- Table 53: China Powersports Market Revenue (Million) Forecast, by Application 2019 & 2032
- Table 54: Japan Powersports Market Revenue (Million) Forecast, by Application 2019 & 2032
- Table 55: Rest of Asia Pacific Powersports Market Revenue (Million) Forecast, by Application 2019 & 2032
- Table 56: Global Powersports Market Revenue Million Forecast, by Vehicle type 2019 & 2032
- Table 57: Global Powersports Market Revenue Million Forecast, by Propulsion 2019 & 2032
- Table 58: Global Powersports Market Revenue Million Forecast, by Application 2019 & 2032
- Table 59: Global Powersports Market Revenue Million Forecast, by Country 2019 & 2032
- Table 60: Brazil Powersports Market Revenue (Million) Forecast, by Application 2019 & 2032
- Table 61: Argentina Powersports Market Revenue (Million) Forecast, by Application 2019 & 2032
- Table 62: Global Powersports Market Revenue Million Forecast, by Vehicle type 2019 & 2032
- Table 63: Global Powersports Market Revenue Million Forecast, by Propulsion 2019 & 2032
- Table 64: Global Powersports Market Revenue Million Forecast, by Application 2019 & 2032
- Table 65: Global Powersports Market Revenue Million Forecast, by Country 2019 & 2032
- Table 66: UAE Powersports Market Revenue (Million) Forecast, by Application 2019 & 2032
- Table 67: Saudi Arabia Powersports Market Revenue (Million) Forecast, by Application 2019 & 2032
- Table 68: Rest of Middle East Powersports Market Revenue (Million) Forecast, by Application 2019 & 2032
Frequently Asked Questions
1. What is the projected Compound Annual Growth Rate (CAGR) of the Powersports Market?
The projected CAGR is approximately 6.29%.
2. Which companies are prominent players in the Powersports Market?
Key companies in the market include Arctic Cat Inc, Yamaha Motor Co Ltd, Kawasaki Heavy Industries, Changjiang Motorcycle Co Ltd, KTM AG, Harley-Davidson Inc *List Not Exhaustive, BRP Inc, Honda Motor Co Ltd, Polaris Inc, Suzuki Motor Corporation.
3. What are the main segments of the Powersports Market?
The market segments include Vehicle type, Propulsion, Application.
4. Can you provide details about the market size?
The market size is estimated to be USD 40.33 Million as of 2022.
5. What are some drivers contributing to market growth?
Increasing disposable income and consumer preferences for adventure sports propel the market growth.
6. What are the notable trends driving market growth?
Changing Consumer Preferences due to technological Advancements Drives the Demand in the Market.
7. Are there any restraints impacting market growth?
High initial investment and maintenance costs obstruct the market growth.
8. Can you provide examples of recent developments in the market?
• January 2024: Patrick Industries agreed to acquire a supplier for Powersports Original Equipment Manufacturers (OEMs). The acquisition will expand Patrick Industries' presence in the Powersports market, offering innovative solutions to OEMs and enhancing their product offerings.
9. What pricing options are available for accessing the report?
Pricing options include single-user, multi-user, and enterprise licenses priced at USD 4750, USD 5250, and USD 8750 respectively.
10. Is the market size provided in terms of value or volume?
The market size is provided in terms of value, measured in Million.
11. Are there any specific market keywords associated with the report?
Yes, the market keyword associated with the report is "Powersports Market," which aids in identifying and referencing the specific market segment covered.
12. How do I determine which pricing option suits my needs best?
The pricing options vary based on user requirements and access needs. Individual users may opt for single-user licenses, while businesses requiring broader access may choose multi-user or enterprise licenses for cost-effective access to the report.
13. Are there any additional resources or data provided in the Powersports Market report?
While the report offers comprehensive insights, it's advisable to review the specific contents or supplementary materials provided to ascertain if additional resources or data are available.
14. How can I stay updated on further developments or reports in the Powersports Market?
To stay informed about further developments, trends, and reports in the Powersports Market, consider subscribing to industry newsletters, following relevant companies and organizations, or regularly checking reputable industry news sources and publications.
Methodology
Step 1 - Identification of Relevant Samples Size from Population Database


Step 2 - Approaches for Defining Global Market Size (Value, Volume* & Price*)

Note*: In applicable scenarios
Step 3 - Data Sources
Primary Research
- Web Analytics
- Survey Reports
- Research Institute
- Latest Research Reports
- Opinion Leaders
Secondary Research
- Annual Reports
- White Paper
- Latest Press Release
- Industry Association
- Paid Database
- Investor Presentations

Step 4 - Data Triangulation
Involves using different sources of information in order to increase the validity of a study
These sources are likely to be stakeholders in a program - participants, other researchers, program staff, other community members, and so on.
Then we put all data in single framework & apply various statistical tools to find out the dynamic on the market.
During the analysis stage, feedback from the stakeholder groups would be compared to determine areas of agreement as well as areas of divergence
