

Key Insights
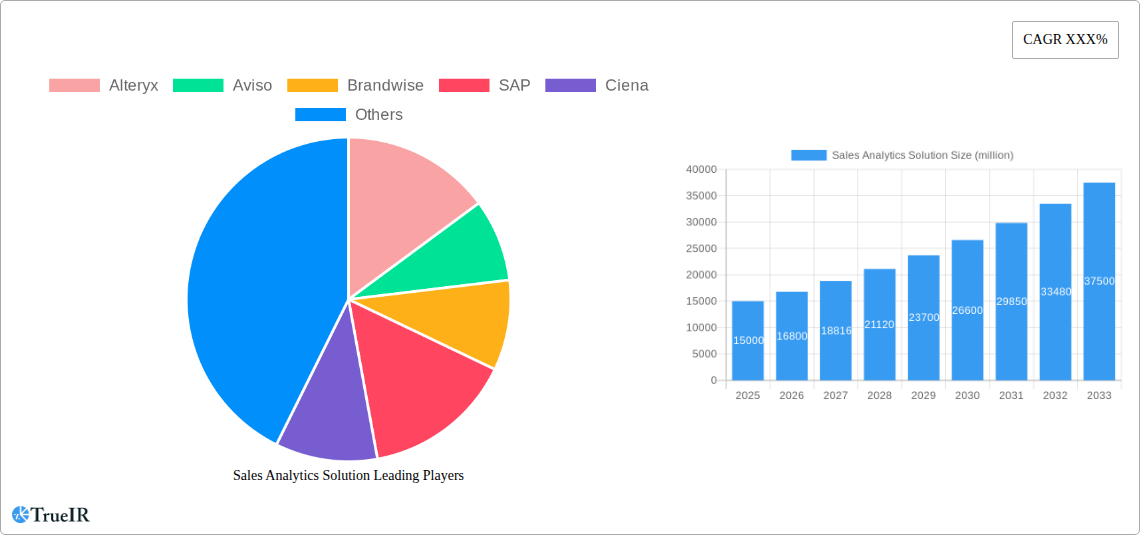
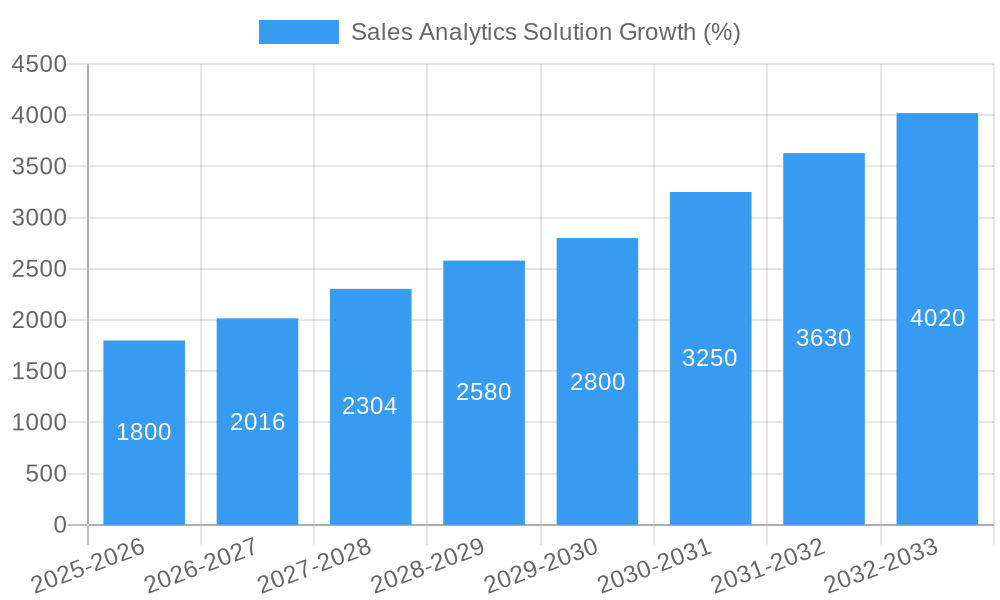
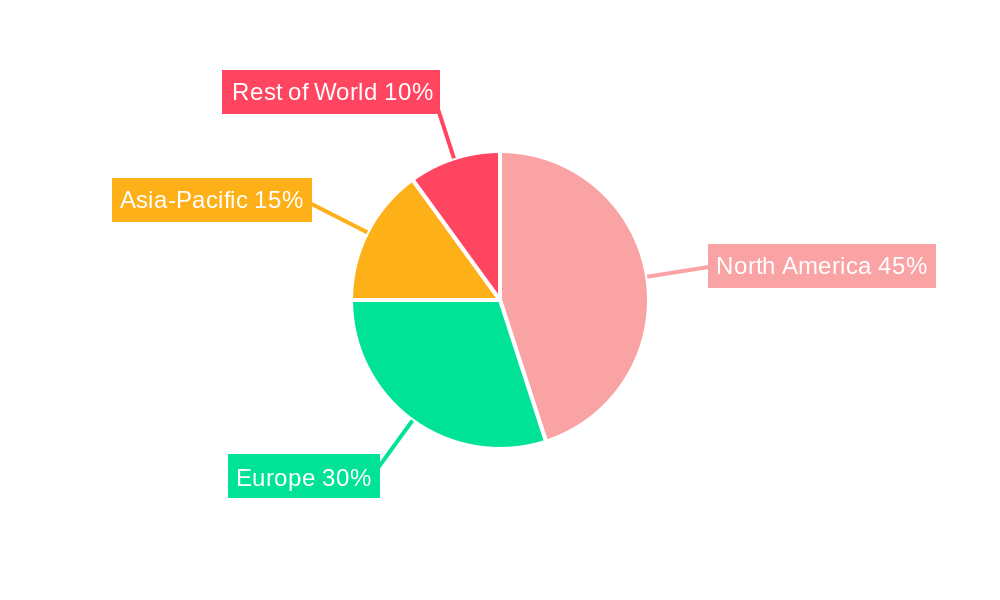
The global Sales Analytics Solutions market is experiencing robust growth, driven by the increasing need for data-driven decision-making within sales organizations. The market, estimated at $15 billion in 2025, is projected to maintain a healthy Compound Annual Growth Rate (CAGR) of 12% from 2025 to 2033, reaching an estimated $45 billion by 2033. This expansion is fueled by several key factors. Firstly, the proliferation of readily available sales data from various sources, such as CRM systems, marketing automation platforms, and social media, necessitates sophisticated analytics tools for effective processing and interpretation. Secondly, the growing adoption of cloud-based solutions offers scalability, accessibility, and cost-effectiveness, making advanced analytics accessible to businesses of all sizes. Thirdly, the rising demand for predictive analytics, enabling businesses to forecast sales trends and optimize resource allocation, further boosts market growth. The competitive landscape is dynamic, with established players like Salesforce and Oracle alongside specialized vendors like Alteryx and Aviso vying for market share. Segmentation within the market includes solutions based on deployment (cloud, on-premise), functionality (predictive analytics, sales performance management), and industry vertical. The North American market currently holds the largest share, followed by Europe and Asia-Pacific, with significant growth opportunities expected in emerging economies.
However, the market also faces certain restraints. The high cost of implementation and maintenance of advanced sales analytics solutions can be a barrier to entry for smaller businesses. Furthermore, the need for skilled data analysts and the challenges associated with data integration and security pose significant hurdles. Despite these challenges, the overall market outlook remains positive. The ongoing digital transformation across various industries is further driving the demand for robust sales analytics capabilities, which are crucial for enhancing sales efficiency, improving customer engagement, and ultimately maximizing revenue generation. Continuous innovation in areas like AI and machine learning is likely to further shape the market landscape in the coming years, leading to the emergence of more sophisticated and user-friendly solutions.
Sales Analytics Solution Market Report: 2019-2033
This comprehensive report provides a detailed analysis of the global Sales Analytics Solution market, projecting a market value exceeding $XX million by 2033. The study covers the period from 2019 to 2033, with a base year of 2025 and a forecast period from 2025 to 2033. This report is crucial for businesses seeking to understand market trends, competitive dynamics, and future growth opportunities in the rapidly evolving sales analytics landscape.
Sales Analytics Solution Market Structure & Competitive Landscape
The global Sales Analytics Solution market is characterized by a moderately concentrated landscape, with a few major players holding significant market share. The Herfindahl-Hirschman Index (HHI) for 2024 is estimated at xx, indicating a moderately consolidated market. Innovation is a key driver, with companies continuously developing advanced analytics capabilities, such as AI-powered predictive modeling and real-time dashboards. Regulatory impacts, particularly concerning data privacy (e.g., GDPR, CCPA), significantly influence market dynamics. Product substitutes, such as traditional CRM systems with basic reporting features, pose a competitive threat, although the demand for sophisticated analytics continues to increase. The market encompasses diverse end-user segments, including large enterprises, SMEs, and various industries. Mergers and acquisitions (M&A) activity has been relatively high, with an estimated xx million dollars worth of transactions recorded between 2019 and 2024.
- Market Concentration: HHI (2024): xx
- Innovation Drivers: AI, Machine Learning, Big Data Analytics
- Regulatory Impacts: GDPR, CCPA
- M&A Activity (2019-2024): $XX million
Sales Analytics Solution Market Trends & Opportunities
The global Sales Analytics Solution market is experiencing robust growth, with a projected Compound Annual Growth Rate (CAGR) of xx% from 2025 to 2033. This growth is driven by several factors, including the increasing adoption of cloud-based solutions, the rising need for data-driven decision-making in sales, and the expanding use of advanced analytics techniques to optimize sales processes and improve forecasting accuracy. Market penetration rates are increasing, especially in developing economies with rapidly growing digital adoption. Technological shifts, such as the proliferation of mobile analytics and the integration of IoT data, are reshaping the market landscape. Consumer preferences are shifting towards more user-friendly, intuitive, and customizable platforms. Competitive dynamics are intensifying, with established players facing challenges from innovative startups. The market size is expected to reach $XX million by 2033, presenting significant opportunities for market participants.
Dominant Markets & Segments in Sales Analytics Solution
The North American region currently dominates the global Sales Analytics Solution market, accounting for approximately xx% of the total revenue in 2024. This dominance is fueled by factors including high technological adoption, strong IT infrastructure, and the presence of major industry players. Within North America, the United States constitutes the largest market, driven by a mature economy, high spending on technology, and well-developed sales and marketing functions.
- Key Growth Drivers (North America):
- Robust IT Infrastructure
- High Technological Adoption
- Strong Presence of Key Players
- Mature Economy and High Spending on Technology
- Well-Developed Sales and Marketing Functions
The European market is also a significant contributor, with substantial growth expected in the forecast period, driven by increasing digitalization and the adoption of advanced analytics across various industries. Other regions, such as Asia-Pacific and Latin America, are showing promising growth potential due to rising internet penetration and expanding business activities.
Sales Analytics Solution Product Analysis
The Sales Analytics Solution market showcases diverse product offerings, ranging from basic reporting tools to advanced predictive analytics platforms. Recent innovations include AI-powered sales forecasting, real-time sales dashboards, and integrated CRM solutions. These advancements enhance sales team efficiency, improve sales forecasting accuracy, and provide actionable insights for optimizing sales strategies. The primary competitive advantage lies in the sophistication of the analytics capabilities, ease of use, integration with existing systems, and the ability to provide valuable insights in a timely manner.
Key Drivers, Barriers & Challenges in Sales Analytics Solution
Key Drivers:
- Technological Advancements: The rise of AI, machine learning, and big data analytics is transforming sales processes, enabling predictive modeling and real-time insights.
- Economic Factors: Growing business emphasis on data-driven decision-making is creating significant demand.
- Regulatory Changes: Policies focused on data privacy and security are driving the adoption of secure and compliant sales analytics solutions.
Challenges and Restraints:
- Data Security and Privacy: Concerns over data breaches and compliance requirements pose a significant hurdle.
- High Implementation Costs: The initial investment in software and implementation services can be substantial for smaller businesses.
- Integration Challenges: Integrating sales analytics solutions with existing CRM and other enterprise systems can be complex. This can lead to implementation delays and increased costs, potentially hindering market growth.
Growth Drivers in the Sales Analytics Solution Market
The market is driven by increasing adoption of cloud-based solutions, rising need for data-driven sales decisions, and expanding use of advanced analytics for sales optimization and forecasting accuracy. Economic growth, particularly in developing markets, also contributes to market expansion.
Challenges Impacting Sales Analytics Solution Growth
High implementation costs, data security and privacy concerns, and integration complexities present significant challenges. Competition among established vendors and emerging startups further complicates market growth.
Key Players Shaping the Sales Analytics Solution Market
- Alteryx
- Aviso
- Brandwise
- SAP
- Ciena
- Collective[i]
- Datapine
- GoodData
- InsightSquared
- Golden Source
- Oracle
- SalesChoice
- Salesforce
Significant Sales Analytics Solution Industry Milestones
- 2020, Q4: Salesforce launches Einstein Analytics enhancements, boosting AI-powered insights.
- 2022, Q1: Alteryx acquires a smaller analytics firm, expanding its market reach.
- 2023, Q3: Significant increase in investment in AI-powered sales analytics solutions. (Note: This is a predicted milestone based on current trends.)
Future Outlook for Sales Analytics Solution Market
The Sales Analytics Solution market is poised for continued growth, driven by ongoing technological innovation, increasing data availability, and the growing demand for data-driven decision-making in the sales function. Strategic opportunities exist for companies that can provide robust, user-friendly, and scalable solutions. The market potential is substantial, with further expansion expected across various industries and geographic regions.
Sales Analytics Solution Segmentation
-
1. Application
- 1.1. Large Enterprises
- 1.2. SMEs
-
2. Type
- 2.1. On-Premises
- 2.2. Cloud-Based
Sales Analytics Solution Segmentation By Geography
-
1. North America
- 1.1. United States
- 1.2. Canada
- 1.3. Mexico
-
2. South America
- 2.1. Brazil
- 2.2. Argentina
- 2.3. Rest of South America
-
3. Europe
- 3.1. United Kingdom
- 3.2. Germany
- 3.3. France
- 3.4. Italy
- 3.5. Spain
- 3.6. Russia
- 3.7. Benelux
- 3.8. Nordics
- 3.9. Rest of Europe
-
4. Middle East & Africa
- 4.1. Turkey
- 4.2. Israel
- 4.3. GCC
- 4.4. North Africa
- 4.5. South Africa
- 4.6. Rest of Middle East & Africa
-
5. Asia Pacific
- 5.1. China
- 5.2. India
- 5.3. Japan
- 5.4. South Korea
- 5.5. ASEAN
- 5.6. Oceania
- 5.7. Rest of Asia Pacific
Sales Analytics Solution REPORT HIGHLIGHTS
| Aspects | Details |
|---|---|
| Study Period | 2019-2033 |
| Base Year | 2024 |
| Estimated Year | 2025 |
| Forecast Period | 2025-2033 |
| Historical Period | 2019-2024 |
| Growth Rate | CAGR of XXX% from 2019-2033 |
| Segmentation |
|
Table of Contents
- 1. Introduction
- 1.1. Research Scope
- 1.2. Market Segmentation
- 1.3. Research Methodology
- 1.4. Definitions and Assumptions
- 2. Executive Summary
- 2.1. Introduction
- 3. Market Dynamics
- 3.1. Introduction
- 3.2. Market Drivers
- 3.3. Market Restrains
- 3.4. Market Trends
- 4. Market Factor Analysis
- 4.1. Porters Five Forces
- 4.2. Supply/Value Chain
- 4.3. PESTEL analysis
- 4.4. Market Entropy
- 4.5. Patent/Trademark Analysis
- 5. Global Sales Analytics Solution Analysis, Insights and Forecast, 2019-2031
- 5.1. Market Analysis, Insights and Forecast - by Application
- 5.1.1. Large Enterprises
- 5.1.2. SMEs
- 5.2. Market Analysis, Insights and Forecast - by Type
- 5.2.1. On-Premises
- 5.2.2. Cloud-Based
- 5.3. Market Analysis, Insights and Forecast - by Region
- 5.3.1. North America
- 5.3.2. South America
- 5.3.3. Europe
- 5.3.4. Middle East & Africa
- 5.3.5. Asia Pacific
- 5.1. Market Analysis, Insights and Forecast - by Application
- 6. North America Sales Analytics Solution Analysis, Insights and Forecast, 2019-2031
- 6.1. Market Analysis, Insights and Forecast - by Application
- 6.1.1. Large Enterprises
- 6.1.2. SMEs
- 6.2. Market Analysis, Insights and Forecast - by Type
- 6.2.1. On-Premises
- 6.2.2. Cloud-Based
- 6.1. Market Analysis, Insights and Forecast - by Application
- 7. South America Sales Analytics Solution Analysis, Insights and Forecast, 2019-2031
- 7.1. Market Analysis, Insights and Forecast - by Application
- 7.1.1. Large Enterprises
- 7.1.2. SMEs
- 7.2. Market Analysis, Insights and Forecast - by Type
- 7.2.1. On-Premises
- 7.2.2. Cloud-Based
- 7.1. Market Analysis, Insights and Forecast - by Application
- 8. Europe Sales Analytics Solution Analysis, Insights and Forecast, 2019-2031
- 8.1. Market Analysis, Insights and Forecast - by Application
- 8.1.1. Large Enterprises
- 8.1.2. SMEs
- 8.2. Market Analysis, Insights and Forecast - by Type
- 8.2.1. On-Premises
- 8.2.2. Cloud-Based
- 8.1. Market Analysis, Insights and Forecast - by Application
- 9. Middle East & Africa Sales Analytics Solution Analysis, Insights and Forecast, 2019-2031
- 9.1. Market Analysis, Insights and Forecast - by Application
- 9.1.1. Large Enterprises
- 9.1.2. SMEs
- 9.2. Market Analysis, Insights and Forecast - by Type
- 9.2.1. On-Premises
- 9.2.2. Cloud-Based
- 9.1. Market Analysis, Insights and Forecast - by Application
- 10. Asia Pacific Sales Analytics Solution Analysis, Insights and Forecast, 2019-2031
- 10.1. Market Analysis, Insights and Forecast - by Application
- 10.1.1. Large Enterprises
- 10.1.2. SMEs
- 10.2. Market Analysis, Insights and Forecast - by Type
- 10.2.1. On-Premises
- 10.2.2. Cloud-Based
- 10.1. Market Analysis, Insights and Forecast - by Application
- 11. Competitive Analysis
- 11.1. Global Market Share Analysis 2024
- 11.2. Company Profiles
- 11.2.1 Alteryx
- 11.2.1.1. Overview
- 11.2.1.2. Products
- 11.2.1.3. SWOT Analysis
- 11.2.1.4. Recent Developments
- 11.2.1.5. Financials (Based on Availability)
- 11.2.2 Aviso
- 11.2.2.1. Overview
- 11.2.2.2. Products
- 11.2.2.3. SWOT Analysis
- 11.2.2.4. Recent Developments
- 11.2.2.5. Financials (Based on Availability)
- 11.2.3 Brandwise
- 11.2.3.1. Overview
- 11.2.3.2. Products
- 11.2.3.3. SWOT Analysis
- 11.2.3.4. Recent Developments
- 11.2.3.5. Financials (Based on Availability)
- 11.2.4 SAP
- 11.2.4.1. Overview
- 11.2.4.2. Products
- 11.2.4.3. SWOT Analysis
- 11.2.4.4. Recent Developments
- 11.2.4.5. Financials (Based on Availability)
- 11.2.5 Ciena
- 11.2.5.1. Overview
- 11.2.5.2. Products
- 11.2.5.3. SWOT Analysis
- 11.2.5.4. Recent Developments
- 11.2.5.5. Financials (Based on Availability)
- 11.2.6 Collective[i]
- 11.2.6.1. Overview
- 11.2.6.2. Products
- 11.2.6.3. SWOT Analysis
- 11.2.6.4. Recent Developments
- 11.2.6.5. Financials (Based on Availability)
- 11.2.7 Datapine
- 11.2.7.1. Overview
- 11.2.7.2. Products
- 11.2.7.3. SWOT Analysis
- 11.2.7.4. Recent Developments
- 11.2.7.5. Financials (Based on Availability)
- 11.2.8 GoodData
- 11.2.8.1. Overview
- 11.2.8.2. Products
- 11.2.8.3. SWOT Analysis
- 11.2.8.4. Recent Developments
- 11.2.8.5. Financials (Based on Availability)
- 11.2.9 InsightSquared
- 11.2.9.1. Overview
- 11.2.9.2. Products
- 11.2.9.3. SWOT Analysis
- 11.2.9.4. Recent Developments
- 11.2.9.5. Financials (Based on Availability)
- 11.2.10 Golden Source
- 11.2.10.1. Overview
- 11.2.10.2. Products
- 11.2.10.3. SWOT Analysis
- 11.2.10.4. Recent Developments
- 11.2.10.5. Financials (Based on Availability)
- 11.2.11 Oracle
- 11.2.11.1. Overview
- 11.2.11.2. Products
- 11.2.11.3. SWOT Analysis
- 11.2.11.4. Recent Developments
- 11.2.11.5. Financials (Based on Availability)
- 11.2.12 SalesChoice
- 11.2.12.1. Overview
- 11.2.12.2. Products
- 11.2.12.3. SWOT Analysis
- 11.2.12.4. Recent Developments
- 11.2.12.5. Financials (Based on Availability)
- 11.2.13 Salesforce
- 11.2.13.1. Overview
- 11.2.13.2. Products
- 11.2.13.3. SWOT Analysis
- 11.2.13.4. Recent Developments
- 11.2.13.5. Financials (Based on Availability)
- 11.2.1 Alteryx
List of Figures
- Figure 1: Global Sales Analytics Solution Revenue Breakdown (million, %) by Region 2024 & 2032
- Figure 2: North America Sales Analytics Solution Revenue (million), by Application 2024 & 2032
- Figure 3: North America Sales Analytics Solution Revenue Share (%), by Application 2024 & 2032
- Figure 4: North America Sales Analytics Solution Revenue (million), by Type 2024 & 2032
- Figure 5: North America Sales Analytics Solution Revenue Share (%), by Type 2024 & 2032
- Figure 6: North America Sales Analytics Solution Revenue (million), by Country 2024 & 2032
- Figure 7: North America Sales Analytics Solution Revenue Share (%), by Country 2024 & 2032
- Figure 8: South America Sales Analytics Solution Revenue (million), by Application 2024 & 2032
- Figure 9: South America Sales Analytics Solution Revenue Share (%), by Application 2024 & 2032
- Figure 10: South America Sales Analytics Solution Revenue (million), by Type 2024 & 2032
- Figure 11: South America Sales Analytics Solution Revenue Share (%), by Type 2024 & 2032
- Figure 12: South America Sales Analytics Solution Revenue (million), by Country 2024 & 2032
- Figure 13: South America Sales Analytics Solution Revenue Share (%), by Country 2024 & 2032
- Figure 14: Europe Sales Analytics Solution Revenue (million), by Application 2024 & 2032
- Figure 15: Europe Sales Analytics Solution Revenue Share (%), by Application 2024 & 2032
- Figure 16: Europe Sales Analytics Solution Revenue (million), by Type 2024 & 2032
- Figure 17: Europe Sales Analytics Solution Revenue Share (%), by Type 2024 & 2032
- Figure 18: Europe Sales Analytics Solution Revenue (million), by Country 2024 & 2032
- Figure 19: Europe Sales Analytics Solution Revenue Share (%), by Country 2024 & 2032
- Figure 20: Middle East & Africa Sales Analytics Solution Revenue (million), by Application 2024 & 2032
- Figure 21: Middle East & Africa Sales Analytics Solution Revenue Share (%), by Application 2024 & 2032
- Figure 22: Middle East & Africa Sales Analytics Solution Revenue (million), by Type 2024 & 2032
- Figure 23: Middle East & Africa Sales Analytics Solution Revenue Share (%), by Type 2024 & 2032
- Figure 24: Middle East & Africa Sales Analytics Solution Revenue (million), by Country 2024 & 2032
- Figure 25: Middle East & Africa Sales Analytics Solution Revenue Share (%), by Country 2024 & 2032
- Figure 26: Asia Pacific Sales Analytics Solution Revenue (million), by Application 2024 & 2032
- Figure 27: Asia Pacific Sales Analytics Solution Revenue Share (%), by Application 2024 & 2032
- Figure 28: Asia Pacific Sales Analytics Solution Revenue (million), by Type 2024 & 2032
- Figure 29: Asia Pacific Sales Analytics Solution Revenue Share (%), by Type 2024 & 2032
- Figure 30: Asia Pacific Sales Analytics Solution Revenue (million), by Country 2024 & 2032
- Figure 31: Asia Pacific Sales Analytics Solution Revenue Share (%), by Country 2024 & 2032
List of Tables
- Table 1: Global Sales Analytics Solution Revenue million Forecast, by Region 2019 & 2032
- Table 2: Global Sales Analytics Solution Revenue million Forecast, by Application 2019 & 2032
- Table 3: Global Sales Analytics Solution Revenue million Forecast, by Type 2019 & 2032
- Table 4: Global Sales Analytics Solution Revenue million Forecast, by Region 2019 & 2032
- Table 5: Global Sales Analytics Solution Revenue million Forecast, by Application 2019 & 2032
- Table 6: Global Sales Analytics Solution Revenue million Forecast, by Type 2019 & 2032
- Table 7: Global Sales Analytics Solution Revenue million Forecast, by Country 2019 & 2032
- Table 8: United States Sales Analytics Solution Revenue (million) Forecast, by Application 2019 & 2032
- Table 9: Canada Sales Analytics Solution Revenue (million) Forecast, by Application 2019 & 2032
- Table 10: Mexico Sales Analytics Solution Revenue (million) Forecast, by Application 2019 & 2032
- Table 11: Global Sales Analytics Solution Revenue million Forecast, by Application 2019 & 2032
- Table 12: Global Sales Analytics Solution Revenue million Forecast, by Type 2019 & 2032
- Table 13: Global Sales Analytics Solution Revenue million Forecast, by Country 2019 & 2032
- Table 14: Brazil Sales Analytics Solution Revenue (million) Forecast, by Application 2019 & 2032
- Table 15: Argentina Sales Analytics Solution Revenue (million) Forecast, by Application 2019 & 2032
- Table 16: Rest of South America Sales Analytics Solution Revenue (million) Forecast, by Application 2019 & 2032
- Table 17: Global Sales Analytics Solution Revenue million Forecast, by Application 2019 & 2032
- Table 18: Global Sales Analytics Solution Revenue million Forecast, by Type 2019 & 2032
- Table 19: Global Sales Analytics Solution Revenue million Forecast, by Country 2019 & 2032
- Table 20: United Kingdom Sales Analytics Solution Revenue (million) Forecast, by Application 2019 & 2032
- Table 21: Germany Sales Analytics Solution Revenue (million) Forecast, by Application 2019 & 2032
- Table 22: France Sales Analytics Solution Revenue (million) Forecast, by Application 2019 & 2032
- Table 23: Italy Sales Analytics Solution Revenue (million) Forecast, by Application 2019 & 2032
- Table 24: Spain Sales Analytics Solution Revenue (million) Forecast, by Application 2019 & 2032
- Table 25: Russia Sales Analytics Solution Revenue (million) Forecast, by Application 2019 & 2032
- Table 26: Benelux Sales Analytics Solution Revenue (million) Forecast, by Application 2019 & 2032
- Table 27: Nordics Sales Analytics Solution Revenue (million) Forecast, by Application 2019 & 2032
- Table 28: Rest of Europe Sales Analytics Solution Revenue (million) Forecast, by Application 2019 & 2032
- Table 29: Global Sales Analytics Solution Revenue million Forecast, by Application 2019 & 2032
- Table 30: Global Sales Analytics Solution Revenue million Forecast, by Type 2019 & 2032
- Table 31: Global Sales Analytics Solution Revenue million Forecast, by Country 2019 & 2032
- Table 32: Turkey Sales Analytics Solution Revenue (million) Forecast, by Application 2019 & 2032
- Table 33: Israel Sales Analytics Solution Revenue (million) Forecast, by Application 2019 & 2032
- Table 34: GCC Sales Analytics Solution Revenue (million) Forecast, by Application 2019 & 2032
- Table 35: North Africa Sales Analytics Solution Revenue (million) Forecast, by Application 2019 & 2032
- Table 36: South Africa Sales Analytics Solution Revenue (million) Forecast, by Application 2019 & 2032
- Table 37: Rest of Middle East & Africa Sales Analytics Solution Revenue (million) Forecast, by Application 2019 & 2032
- Table 38: Global Sales Analytics Solution Revenue million Forecast, by Application 2019 & 2032
- Table 39: Global Sales Analytics Solution Revenue million Forecast, by Type 2019 & 2032
- Table 40: Global Sales Analytics Solution Revenue million Forecast, by Country 2019 & 2032
- Table 41: China Sales Analytics Solution Revenue (million) Forecast, by Application 2019 & 2032
- Table 42: India Sales Analytics Solution Revenue (million) Forecast, by Application 2019 & 2032
- Table 43: Japan Sales Analytics Solution Revenue (million) Forecast, by Application 2019 & 2032
- Table 44: South Korea Sales Analytics Solution Revenue (million) Forecast, by Application 2019 & 2032
- Table 45: ASEAN Sales Analytics Solution Revenue (million) Forecast, by Application 2019 & 2032
- Table 46: Oceania Sales Analytics Solution Revenue (million) Forecast, by Application 2019 & 2032
- Table 47: Rest of Asia Pacific Sales Analytics Solution Revenue (million) Forecast, by Application 2019 & 2032
Frequently Asked Questions
1. What is the projected Compound Annual Growth Rate (CAGR) of the Sales Analytics Solution?
The projected CAGR is approximately XXX%.
2. Which companies are prominent players in the Sales Analytics Solution?
Key companies in the market include Alteryx, Aviso, Brandwise, SAP, Ciena, Collective[i], Datapine, GoodData, InsightSquared, Golden Source, Oracle, SalesChoice, Salesforce.
3. What are the main segments of the Sales Analytics Solution?
The market segments include Application, Type.
4. Can you provide details about the market size?
The market size is estimated to be USD XXX million as of 2022.
5. What are some drivers contributing to market growth?
N/A
6. What are the notable trends driving market growth?
N/A
7. Are there any restraints impacting market growth?
N/A
8. Can you provide examples of recent developments in the market?
N/A
9. What pricing options are available for accessing the report?
Pricing options include single-user, multi-user, and enterprise licenses priced at USD 2900.00, USD 4350.00, and USD 5800.00 respectively.
10. Is the market size provided in terms of value or volume?
The market size is provided in terms of value, measured in million.
11. Are there any specific market keywords associated with the report?
Yes, the market keyword associated with the report is "Sales Analytics Solution," which aids in identifying and referencing the specific market segment covered.
12. How do I determine which pricing option suits my needs best?
The pricing options vary based on user requirements and access needs. Individual users may opt for single-user licenses, while businesses requiring broader access may choose multi-user or enterprise licenses for cost-effective access to the report.
13. Are there any additional resources or data provided in the Sales Analytics Solution report?
While the report offers comprehensive insights, it's advisable to review the specific contents or supplementary materials provided to ascertain if additional resources or data are available.
14. How can I stay updated on further developments or reports in the Sales Analytics Solution?
To stay informed about further developments, trends, and reports in the Sales Analytics Solution, consider subscribing to industry newsletters, following relevant companies and organizations, or regularly checking reputable industry news sources and publications.
Methodology
Step 1 - Identification of Relevant Samples Size from Population Database


Step 2 - Approaches for Defining Global Market Size (Value, Volume* & Price*)

Note*: In applicable scenarios
Step 3 - Data Sources
Primary Research
- Web Analytics
- Survey Reports
- Research Institute
- Latest Research Reports
- Opinion Leaders
Secondary Research
- Annual Reports
- White Paper
- Latest Press Release
- Industry Association
- Paid Database
- Investor Presentations

Step 4 - Data Triangulation
Involves using different sources of information in order to increase the validity of a study
These sources are likely to be stakeholders in a program - participants, other researchers, program staff, other community members, and so on.
Then we put all data in single framework & apply various statistical tools to find out the dynamic on the market.
During the analysis stage, feedback from the stakeholder groups would be compared to determine areas of agreement as well as areas of divergence
