

Key Insights
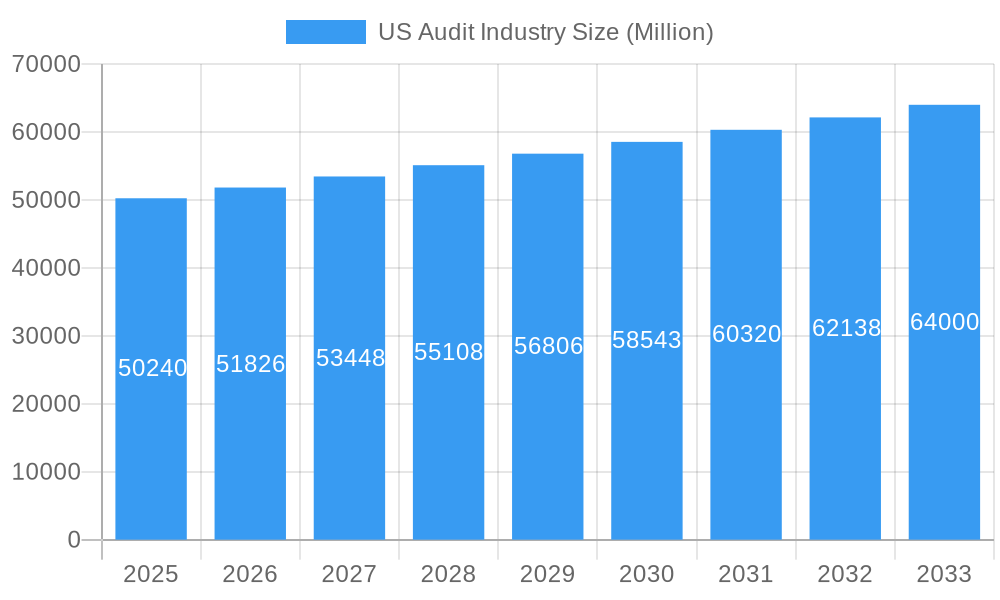
The US audit industry, valued at $50.24 billion in 2025, is experiencing steady growth, projected at a Compound Annual Growth Rate (CAGR) of 3.27% from 2025 to 2033. This growth is fueled by several key drivers. Increased regulatory scrutiny across various sectors, particularly in finance and healthcare, necessitates robust auditing practices, driving demand for professional audit services. Furthermore, the growing complexity of business operations, including globalization and the rise of digital technologies, contributes to the need for specialized audit expertise. The increasing adoption of data analytics and AI within auditing firms is streamlining processes and enhancing efficiency, enabling them to handle larger volumes of data and provide more comprehensive insights. However, the industry faces challenges such as intense competition among established players like Deloitte, EY, KPMG, PwC, and numerous smaller firms. Maintaining talent acquisition and retention in a competitive job market, adapting to evolving accounting standards, and managing cybersecurity risks also pose significant restraints to growth. Segmentation within the industry is diverse, encompassing various specializations based on industry (e.g., financial services, technology, healthcare) and service offerings (e.g., financial statement audits, internal audits, forensic accounting).
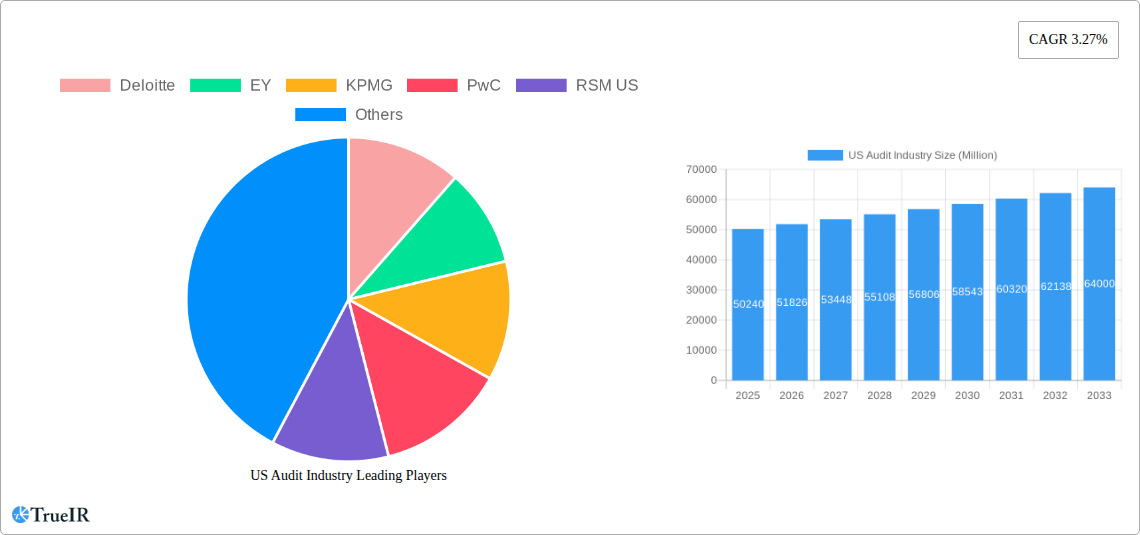
US Audit Industry Market Size (In Billion)
The forecast period (2025-2033) anticipates continued expansion, driven by the factors mentioned above. While precise regional data is unavailable, it's reasonable to assume a significant portion of the market is concentrated within the US, reflecting the nation's large economy and complex regulatory environment. The competitive landscape remains highly consolidated, with the "Big Four" firms maintaining a significant market share. However, mid-tier and niche firms are also playing a crucial role by catering to specific industry needs and leveraging technological advancements. Future growth will likely depend on these firms' ability to adapt to emerging technologies, regulatory changes, and evolving client needs, whilst strategically managing costs and talent.
US Audit Industry Company Market Share
US Audit Industry Market Report: 2019-2033
This comprehensive report provides a detailed analysis of the US audit industry, encompassing market structure, competitive dynamics, growth drivers, challenges, and future outlook. The study period covers 2019-2033, with 2025 as the base and estimated year. The forecast period spans 2025-2033, and the historical period encompasses 2019-2024. This report is crucial for investors, industry professionals, and strategic decision-makers seeking a thorough understanding of this dynamic market. The market size is projected to reach xx Million by 2033, exhibiting a CAGR of xx% during the forecast period.
US Audit Industry Market Structure & Competitive Landscape
The US audit industry is characterized by a highly concentrated market structure dominated by the "Big Four" firms: Deloitte, EY, KPMG, and PwC. These firms collectively hold a significant market share, estimated at over xx%, reflecting economies of scale and established brand recognition. However, mid-tier firms like RSM US, Grant Thornton LLP, BDO USA, and Crowe Horwath also play a significant role, particularly in niche segments and regional markets. The industry exhibits a relatively high barrier to entry due to the stringent regulatory requirements, extensive professional certifications needed, and substantial capital investment for technological advancements.
Market Concentration: The Herfindahl-Hirschman Index (HHI) for the US audit industry is estimated at xx, indicating a highly concentrated market.
Innovation Drivers: Technological advancements, particularly in data analytics and AI, are driving innovation, enabling more efficient audit processes and enhanced risk assessment.
Regulatory Impacts: Stringent regulations from the Public Company Accounting Oversight Board (PCAOB) and the Securities and Exchange Commission (SEC) shape the industry landscape, impacting audit methodologies and operational costs.
Product Substitutes: Limited direct substitutes exist, though technology-driven solutions are emerging that automate certain aspects of the audit process.
End-User Segmentation: The industry caters to a diverse clientele including publicly traded companies, privately held businesses, non-profit organizations, and government entities.
M&A Trends: The industry has witnessed a moderate level of mergers and acquisitions (M&A) activity in recent years, primarily focused on expanding service offerings and geographic reach. The total M&A volume between 2019 and 2024 was estimated at xx Million USD.
US Audit Industry Market Trends & Opportunities
The US audit industry is experiencing significant transformation driven by technological advancements, evolving regulatory landscapes, and shifting client demands. The market size is projected to grow from xx Million in 2025 to xx Million in 2033, driven by increasing demand for assurance services, particularly in high-growth sectors like technology and healthcare. Technological advancements such as Artificial Intelligence (AI), Machine Learning (ML), and blockchain technology are reshaping audit methodologies, leading to increased efficiency and improved accuracy. The rising complexity of business operations and regulatory requirements is also fueling demand for sophisticated audit services. Furthermore, the increasing focus on data security and cybersecurity is creating new opportunities for audit firms specializing in these areas. Market penetration rates vary significantly depending on the segment, with larger firms boasting higher rates in the public company audit space. The market's growth trajectory is significantly influenced by the overall economic climate, with periods of robust economic expansion generally correlating with increased demand for audit services.
Dominant Markets & Segments in US Audit Industry
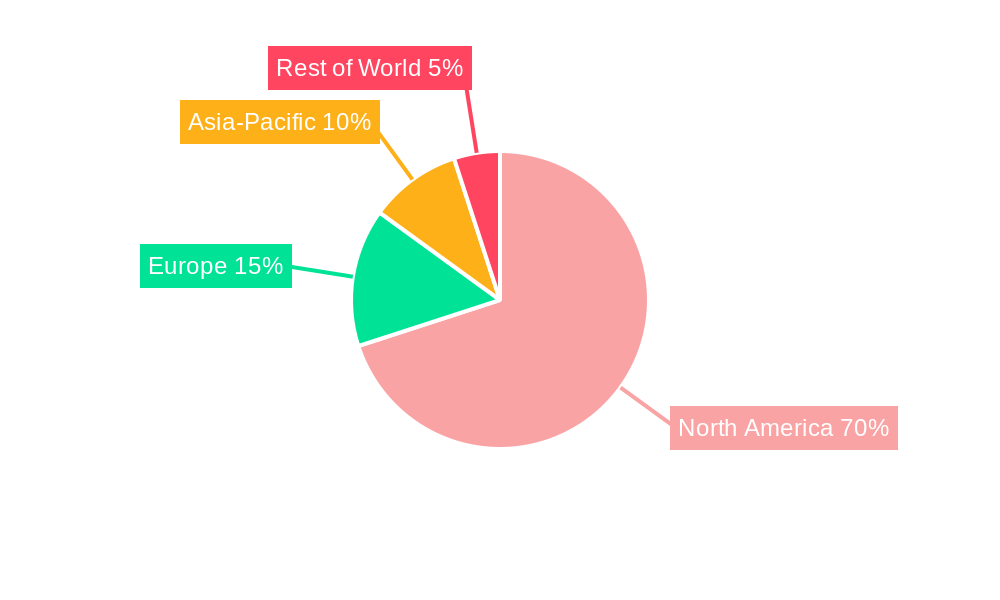
The US audit industry is geographically diverse, with significant activity across all major regions. However, certain segments and regions are experiencing faster growth.
Key Growth Drivers:
- Technological advancements: Increased adoption of data analytics and AI is driving efficiency gains and creating new service offerings.
- Regulatory changes: Stringent regulations are fueling demand for compliance-related audit services.
- Economic growth: Periods of strong economic activity correlate with higher demand for audit services.
Market Dominance Analysis: The largest market segment is the audit of publicly traded companies due to mandatory regulatory requirements. However, the private company audit segment is also experiencing significant growth driven by increasing complexity of operations and investor demands. Within the geographic landscape, major metropolitan areas like New York, San Francisco, Chicago, and Los Angeles represent concentrated areas of high activity, owing to the concentration of large corporations and financial institutions.
US Audit Industry Product Analysis
The US audit industry's product offerings are evolving rapidly, driven by technological innovation. Traditional audit services are being augmented by data analytics, AI-powered risk assessment tools, and cybersecurity consulting. These advancements enhance efficiency, accuracy, and the depth of insights provided to clients. The key competitive advantages lie in the ability to leverage technology effectively, maintain deep industry expertise, and cultivate strong client relationships. The successful integration of these advanced capabilities into existing service offerings distinguishes market leaders and provides a competitive edge.
Key Drivers, Barriers & Challenges in US Audit Industry
Key Drivers: Technological advancements, particularly AI and data analytics, are streamlining processes, improving accuracy, and creating new service opportunities. Economic growth fuels demand for audit services, especially in expanding sectors. Stricter regulations necessitate robust compliance services.
Challenges & Restraints: Regulatory complexity increases operational costs and compliance burdens. Supply chain disruptions can impact the availability of skilled professionals and resources. Intense competition, especially among the largest firms, necessitates continuous innovation and investment.
Growth Drivers in the US Audit Industry Market
The US audit industry's growth is propelled by several key drivers: Technological advancements are improving efficiency and creating new service offerings. Stringent regulations increase the demand for compliance services. Economic expansion boosts the demand for audit and assurance services across various sectors.
Challenges Impacting US Audit Industry Growth
The industry faces significant challenges including escalating regulatory complexity, which necessitates substantial investment in compliance. Supply chain issues impact the availability of skilled professionals. Intense competition requires continuous investment in innovation and talent acquisition.
Significant US Audit Industry Milestones
- May 2023: Deloitte and Google Cloud strengthened their alliance, focusing on integrating Generative AI capabilities.
- May 2023: EY unveiled over 20 new Assurance technology capabilities after partnering with Microsoft, following a USD 1 Billion investment.
Future Outlook for US Audit Industry Market
The US audit industry's future outlook is positive, driven by ongoing technological innovation, increasing regulatory scrutiny, and the growing complexity of business operations. Strategic opportunities exist for firms that effectively leverage technology, specialize in niche areas, and cultivate strong client relationships. The market's continued growth is contingent upon navigating the challenges posed by regulatory complexity, competitive pressures, and the need to attract and retain top talent.
US Audit Industry Segmentation
-
1. Type
- 1.1. Internal Audit
- 1.2. External Audit
-
2. Service line
- 2.1. Operational Audits
- 2.2. Financial Audits
- 2.3. Advisory and Consulting
- 2.4. Investigation Audit
- 2.5. Information System Audit
- 2.6. Compliance Audit
- 2.7. Other
US Audit Industry Segmentation By Geography
-
1. North America
- 1.1. United States
- 1.2. Canada
- 1.3. Mexico
-
2. South America
- 2.1. Brazil
- 2.2. Argentina
- 2.3. Rest of South America
-
3. Europe
- 3.1. United Kingdom
- 3.2. Germany
- 3.3. France
- 3.4. Italy
- 3.5. Spain
- 3.6. Russia
- 3.7. Benelux
- 3.8. Nordics
- 3.9. Rest of Europe
-
4. Middle East & Africa
- 4.1. Turkey
- 4.2. Israel
- 4.3. GCC
- 4.4. North Africa
- 4.5. South Africa
- 4.6. Rest of Middle East & Africa
-
5. Asia Pacific
- 5.1. China
- 5.2. India
- 5.3. Japan
- 5.4. South Korea
- 5.5. ASEAN
- 5.6. Oceania
- 5.7. Rest of Asia Pacific
US Audit Industry Regional Market Share
Geographic Coverage of US Audit Industry
US Audit Industry REPORT HIGHLIGHTS
| Aspects | Details |
|---|---|
| Study Period | 2020-2034 |
| Base Year | 2025 |
| Estimated Year | 2026 |
| Forecast Period | 2026-2034 |
| Historical Period | 2020-2025 |
| Growth Rate | CAGR of 3.27% from 2020-2034 |
| Segmentation |
|
Table of Contents
- 1. Introduction
- 1.1. Research Scope
- 1.2. Market Segmentation
- 1.3. Research Objective
- 1.4. Definitions and Assumptions
- 2. Executive Summary
- 2.1. Market Snapshot
- 3. Market Dynamics
- 3.1. Market Drivers
- 3.2. Market Restrains
- 3.3. Market Trends
- 3.4. Market Opportunities
- 4. Market Factor Analysis
- 4.1. Porters Five Forces
- 4.1.1. Bargaining Power of Suppliers
- 4.1.2. Bargaining Power of Buyers
- 4.1.3. Threat of New Entrants
- 4.1.4. Threat of Substitutes
- 4.1.5. Competitive Rivalry
- 4.2. PESTEL analysis
- 4.3. BCG Analysis
- 4.3.1. Stars (High Growth, High Market Share)
- 4.3.2. Cash Cows (Low Growth, High Market Share)
- 4.3.3. Question Mark (High Growth, Low Market Share)
- 4.3.4. Dogs (Low Growth, Low Market Share)
- 4.4. Ansoff Matrix Analysis
- 4.5. Supply Chain Analysis
- 4.6. Regulatory Landscape
- 4.7. Current Market Potential and Opportunity Assessment (TAM–SAM–SOM Framework)
- 4.8. TIR Analyst Note
- 4.1. Porters Five Forces
- 5. Market Analysis, Insights and Forecast 2021-2033
- 5.1. Market Analysis, Insights and Forecast - by Type
- 5.1.1. Internal Audit
- 5.1.2. External Audit
- 5.2. Market Analysis, Insights and Forecast - by Service line
- 5.2.1. Operational Audits
- 5.2.2. Financial Audits
- 5.2.3. Advisory and Consulting
- 5.2.4. Investigation Audit
- 5.2.5. Information System Audit
- 5.2.6. Compliance Audit
- 5.2.7. Other
- 5.3. Market Analysis, Insights and Forecast - by Region
- 5.3.1. North America
- 5.3.2. South America
- 5.3.3. Europe
- 5.3.4. Middle East & Africa
- 5.3.5. Asia Pacific
- 5.1. Market Analysis, Insights and Forecast - by Type
- 6. Global US Audit Industry Analysis, Insights and Forecast, 2021-2033
- 6.1. Market Analysis, Insights and Forecast - by Type
- 6.1.1. Internal Audit
- 6.1.2. External Audit
- 6.2. Market Analysis, Insights and Forecast - by Service line
- 6.2.1. Operational Audits
- 6.2.2. Financial Audits
- 6.2.3. Advisory and Consulting
- 6.2.4. Investigation Audit
- 6.2.5. Information System Audit
- 6.2.6. Compliance Audit
- 6.2.7. Other
- 6.1. Market Analysis, Insights and Forecast - by Type
- 7. North America US Audit Industry Analysis, Insights and Forecast, 2020-2032
- 7.1. Market Analysis, Insights and Forecast - by Type
- 7.1.1. Internal Audit
- 7.1.2. External Audit
- 7.2. Market Analysis, Insights and Forecast - by Service line
- 7.2.1. Operational Audits
- 7.2.2. Financial Audits
- 7.2.3. Advisory and Consulting
- 7.2.4. Investigation Audit
- 7.2.5. Information System Audit
- 7.2.6. Compliance Audit
- 7.2.7. Other
- 7.1. Market Analysis, Insights and Forecast - by Type
- 8. South America US Audit Industry Analysis, Insights and Forecast, 2020-2032
- 8.1. Market Analysis, Insights and Forecast - by Type
- 8.1.1. Internal Audit
- 8.1.2. External Audit
- 8.2. Market Analysis, Insights and Forecast - by Service line
- 8.2.1. Operational Audits
- 8.2.2. Financial Audits
- 8.2.3. Advisory and Consulting
- 8.2.4. Investigation Audit
- 8.2.5. Information System Audit
- 8.2.6. Compliance Audit
- 8.2.7. Other
- 8.1. Market Analysis, Insights and Forecast - by Type
- 9. Europe US Audit Industry Analysis, Insights and Forecast, 2020-2032
- 9.1. Market Analysis, Insights and Forecast - by Type
- 9.1.1. Internal Audit
- 9.1.2. External Audit
- 9.2. Market Analysis, Insights and Forecast - by Service line
- 9.2.1. Operational Audits
- 9.2.2. Financial Audits
- 9.2.3. Advisory and Consulting
- 9.2.4. Investigation Audit
- 9.2.5. Information System Audit
- 9.2.6. Compliance Audit
- 9.2.7. Other
- 9.1. Market Analysis, Insights and Forecast - by Type
- 10. Middle East & Africa US Audit Industry Analysis, Insights and Forecast, 2020-2032
- 10.1. Market Analysis, Insights and Forecast - by Type
- 10.1.1. Internal Audit
- 10.1.2. External Audit
- 10.2. Market Analysis, Insights and Forecast - by Service line
- 10.2.1. Operational Audits
- 10.2.2. Financial Audits
- 10.2.3. Advisory and Consulting
- 10.2.4. Investigation Audit
- 10.2.5. Information System Audit
- 10.2.6. Compliance Audit
- 10.2.7. Other
- 10.1. Market Analysis, Insights and Forecast - by Type
- 11. Asia Pacific US Audit Industry Analysis, Insights and Forecast, 2020-2032
- 11.1. Market Analysis, Insights and Forecast - by Type
- 11.1.1. Internal Audit
- 11.1.2. External Audit
- 11.2. Market Analysis, Insights and Forecast - by Service line
- 11.2.1. Operational Audits
- 11.2.2. Financial Audits
- 11.2.3. Advisory and Consulting
- 11.2.4. Investigation Audit
- 11.2.5. Information System Audit
- 11.2.6. Compliance Audit
- 11.2.7. Other
- 11.1. Market Analysis, Insights and Forecast - by Type
- 12. Competitive Analysis
- 12.1. Company Profiles
- 12.1.1 Deloitte
- 12.1.1.1. Company Overview
- 12.1.1.2. Products
- 12.1.1.3. Company Financials
- 12.1.1.4. SWOT Analysis
- 12.1.2 EY
- 12.1.2.1. Company Overview
- 12.1.2.2. Products
- 12.1.2.3. Company Financials
- 12.1.2.4. SWOT Analysis
- 12.1.3 KPMG
- 12.1.3.1. Company Overview
- 12.1.3.2. Products
- 12.1.3.3. Company Financials
- 12.1.3.4. SWOT Analysis
- 12.1.4 PwC
- 12.1.4.1. Company Overview
- 12.1.4.2. Products
- 12.1.4.3. Company Financials
- 12.1.4.4. SWOT Analysis
- 12.1.5 RSM US
- 12.1.5.1. Company Overview
- 12.1.5.2. Products
- 12.1.5.3. Company Financials
- 12.1.5.4. SWOT Analysis
- 12.1.6 Grant Thornton LLP
- 12.1.6.1. Company Overview
- 12.1.6.2. Products
- 12.1.6.3. Company Financials
- 12.1.6.4. SWOT Analysis
- 12.1.7 A T Kearney
- 12.1.7.1. Company Overview
- 12.1.7.2. Products
- 12.1.7.3. Company Financials
- 12.1.7.4. SWOT Analysis
- 12.1.8 BDO USA
- 12.1.8.1. Company Overview
- 12.1.8.2. Products
- 12.1.8.3. Company Financials
- 12.1.8.4. SWOT Analysis
- 12.1.9 CBIZ & Mayer Hoffman McCann
- 12.1.9.1. Company Overview
- 12.1.9.2. Products
- 12.1.9.3. Company Financials
- 12.1.9.4. SWOT Analysis
- 12.1.10 Crowe Horwath**List Not Exhaustive
- 12.1.10.1. Company Overview
- 12.1.10.2. Products
- 12.1.10.3. Company Financials
- 12.1.10.4. SWOT Analysis
- 12.1.1 Deloitte
- 12.2. Market Entropy
- 12.2.1 Company's Key Areas Served
- 12.2.2 Recent Developments
- 12.3. Company Market Share Analysis 2025
- 12.3.1 Top 5 Companies Market Share Analysis
- 12.3.2 Top 3 Companies Market Share Analysis
- 12.4. List of Potential Customers
- 13. Research Methodology
List of Figures
- Figure 1: Global US Audit Industry Revenue Breakdown (Million, %) by Region 2025 & 2033
- Figure 2: Global US Audit Industry Volume Breakdown (Billion, %) by Region 2025 & 2033
- Figure 3: North America US Audit Industry Revenue (Million), by Type 2025 & 2033
- Figure 4: North America US Audit Industry Volume (Billion), by Type 2025 & 2033
- Figure 5: North America US Audit Industry Revenue Share (%), by Type 2025 & 2033
- Figure 6: North America US Audit Industry Volume Share (%), by Type 2025 & 2033
- Figure 7: North America US Audit Industry Revenue (Million), by Service line 2025 & 2033
- Figure 8: North America US Audit Industry Volume (Billion), by Service line 2025 & 2033
- Figure 9: North America US Audit Industry Revenue Share (%), by Service line 2025 & 2033
- Figure 10: North America US Audit Industry Volume Share (%), by Service line 2025 & 2033
- Figure 11: North America US Audit Industry Revenue (Million), by Country 2025 & 2033
- Figure 12: North America US Audit Industry Volume (Billion), by Country 2025 & 2033
- Figure 13: North America US Audit Industry Revenue Share (%), by Country 2025 & 2033
- Figure 14: North America US Audit Industry Volume Share (%), by Country 2025 & 2033
- Figure 15: South America US Audit Industry Revenue (Million), by Type 2025 & 2033
- Figure 16: South America US Audit Industry Volume (Billion), by Type 2025 & 2033
- Figure 17: South America US Audit Industry Revenue Share (%), by Type 2025 & 2033
- Figure 18: South America US Audit Industry Volume Share (%), by Type 2025 & 2033
- Figure 19: South America US Audit Industry Revenue (Million), by Service line 2025 & 2033
- Figure 20: South America US Audit Industry Volume (Billion), by Service line 2025 & 2033
- Figure 21: South America US Audit Industry Revenue Share (%), by Service line 2025 & 2033
- Figure 22: South America US Audit Industry Volume Share (%), by Service line 2025 & 2033
- Figure 23: South America US Audit Industry Revenue (Million), by Country 2025 & 2033
- Figure 24: South America US Audit Industry Volume (Billion), by Country 2025 & 2033
- Figure 25: South America US Audit Industry Revenue Share (%), by Country 2025 & 2033
- Figure 26: South America US Audit Industry Volume Share (%), by Country 2025 & 2033
- Figure 27: Europe US Audit Industry Revenue (Million), by Type 2025 & 2033
- Figure 28: Europe US Audit Industry Volume (Billion), by Type 2025 & 2033
- Figure 29: Europe US Audit Industry Revenue Share (%), by Type 2025 & 2033
- Figure 30: Europe US Audit Industry Volume Share (%), by Type 2025 & 2033
- Figure 31: Europe US Audit Industry Revenue (Million), by Service line 2025 & 2033
- Figure 32: Europe US Audit Industry Volume (Billion), by Service line 2025 & 2033
- Figure 33: Europe US Audit Industry Revenue Share (%), by Service line 2025 & 2033
- Figure 34: Europe US Audit Industry Volume Share (%), by Service line 2025 & 2033
- Figure 35: Europe US Audit Industry Revenue (Million), by Country 2025 & 2033
- Figure 36: Europe US Audit Industry Volume (Billion), by Country 2025 & 2033
- Figure 37: Europe US Audit Industry Revenue Share (%), by Country 2025 & 2033
- Figure 38: Europe US Audit Industry Volume Share (%), by Country 2025 & 2033
- Figure 39: Middle East & Africa US Audit Industry Revenue (Million), by Type 2025 & 2033
- Figure 40: Middle East & Africa US Audit Industry Volume (Billion), by Type 2025 & 2033
- Figure 41: Middle East & Africa US Audit Industry Revenue Share (%), by Type 2025 & 2033
- Figure 42: Middle East & Africa US Audit Industry Volume Share (%), by Type 2025 & 2033
- Figure 43: Middle East & Africa US Audit Industry Revenue (Million), by Service line 2025 & 2033
- Figure 44: Middle East & Africa US Audit Industry Volume (Billion), by Service line 2025 & 2033
- Figure 45: Middle East & Africa US Audit Industry Revenue Share (%), by Service line 2025 & 2033
- Figure 46: Middle East & Africa US Audit Industry Volume Share (%), by Service line 2025 & 2033
- Figure 47: Middle East & Africa US Audit Industry Revenue (Million), by Country 2025 & 2033
- Figure 48: Middle East & Africa US Audit Industry Volume (Billion), by Country 2025 & 2033
- Figure 49: Middle East & Africa US Audit Industry Revenue Share (%), by Country 2025 & 2033
- Figure 50: Middle East & Africa US Audit Industry Volume Share (%), by Country 2025 & 2033
- Figure 51: Asia Pacific US Audit Industry Revenue (Million), by Type 2025 & 2033
- Figure 52: Asia Pacific US Audit Industry Volume (Billion), by Type 2025 & 2033
- Figure 53: Asia Pacific US Audit Industry Revenue Share (%), by Type 2025 & 2033
- Figure 54: Asia Pacific US Audit Industry Volume Share (%), by Type 2025 & 2033
- Figure 55: Asia Pacific US Audit Industry Revenue (Million), by Service line 2025 & 2033
- Figure 56: Asia Pacific US Audit Industry Volume (Billion), by Service line 2025 & 2033
- Figure 57: Asia Pacific US Audit Industry Revenue Share (%), by Service line 2025 & 2033
- Figure 58: Asia Pacific US Audit Industry Volume Share (%), by Service line 2025 & 2033
- Figure 59: Asia Pacific US Audit Industry Revenue (Million), by Country 2025 & 2033
- Figure 60: Asia Pacific US Audit Industry Volume (Billion), by Country 2025 & 2033
- Figure 61: Asia Pacific US Audit Industry Revenue Share (%), by Country 2025 & 2033
- Figure 62: Asia Pacific US Audit Industry Volume Share (%), by Country 2025 & 2033
List of Tables
- Table 1: Global US Audit Industry Revenue Million Forecast, by Type 2020 & 2033
- Table 2: Global US Audit Industry Volume Billion Forecast, by Type 2020 & 2033
- Table 3: Global US Audit Industry Revenue Million Forecast, by Service line 2020 & 2033
- Table 4: Global US Audit Industry Volume Billion Forecast, by Service line 2020 & 2033
- Table 5: Global US Audit Industry Revenue Million Forecast, by Region 2020 & 2033
- Table 6: Global US Audit Industry Volume Billion Forecast, by Region 2020 & 2033
- Table 7: Global US Audit Industry Revenue Million Forecast, by Type 2020 & 2033
- Table 8: Global US Audit Industry Volume Billion Forecast, by Type 2020 & 2033
- Table 9: Global US Audit Industry Revenue Million Forecast, by Service line 2020 & 2033
- Table 10: Global US Audit Industry Volume Billion Forecast, by Service line 2020 & 2033
- Table 11: Global US Audit Industry Revenue Million Forecast, by Country 2020 & 2033
- Table 12: Global US Audit Industry Volume Billion Forecast, by Country 2020 & 2033
- Table 13: United States US Audit Industry Revenue (Million) Forecast, by Application 2020 & 2033
- Table 14: United States US Audit Industry Volume (Billion) Forecast, by Application 2020 & 2033
- Table 15: Canada US Audit Industry Revenue (Million) Forecast, by Application 2020 & 2033
- Table 16: Canada US Audit Industry Volume (Billion) Forecast, by Application 2020 & 2033
- Table 17: Mexico US Audit Industry Revenue (Million) Forecast, by Application 2020 & 2033
- Table 18: Mexico US Audit Industry Volume (Billion) Forecast, by Application 2020 & 2033
- Table 19: Global US Audit Industry Revenue Million Forecast, by Type 2020 & 2033
- Table 20: Global US Audit Industry Volume Billion Forecast, by Type 2020 & 2033
- Table 21: Global US Audit Industry Revenue Million Forecast, by Service line 2020 & 2033
- Table 22: Global US Audit Industry Volume Billion Forecast, by Service line 2020 & 2033
- Table 23: Global US Audit Industry Revenue Million Forecast, by Country 2020 & 2033
- Table 24: Global US Audit Industry Volume Billion Forecast, by Country 2020 & 2033
- Table 25: Brazil US Audit Industry Revenue (Million) Forecast, by Application 2020 & 2033
- Table 26: Brazil US Audit Industry Volume (Billion) Forecast, by Application 2020 & 2033
- Table 27: Argentina US Audit Industry Revenue (Million) Forecast, by Application 2020 & 2033
- Table 28: Argentina US Audit Industry Volume (Billion) Forecast, by Application 2020 & 2033
- Table 29: Rest of South America US Audit Industry Revenue (Million) Forecast, by Application 2020 & 2033
- Table 30: Rest of South America US Audit Industry Volume (Billion) Forecast, by Application 2020 & 2033
- Table 31: Global US Audit Industry Revenue Million Forecast, by Type 2020 & 2033
- Table 32: Global US Audit Industry Volume Billion Forecast, by Type 2020 & 2033
- Table 33: Global US Audit Industry Revenue Million Forecast, by Service line 2020 & 2033
- Table 34: Global US Audit Industry Volume Billion Forecast, by Service line 2020 & 2033
- Table 35: Global US Audit Industry Revenue Million Forecast, by Country 2020 & 2033
- Table 36: Global US Audit Industry Volume Billion Forecast, by Country 2020 & 2033
- Table 37: United Kingdom US Audit Industry Revenue (Million) Forecast, by Application 2020 & 2033
- Table 38: United Kingdom US Audit Industry Volume (Billion) Forecast, by Application 2020 & 2033
- Table 39: Germany US Audit Industry Revenue (Million) Forecast, by Application 2020 & 2033
- Table 40: Germany US Audit Industry Volume (Billion) Forecast, by Application 2020 & 2033
- Table 41: France US Audit Industry Revenue (Million) Forecast, by Application 2020 & 2033
- Table 42: France US Audit Industry Volume (Billion) Forecast, by Application 2020 & 2033
- Table 43: Italy US Audit Industry Revenue (Million) Forecast, by Application 2020 & 2033
- Table 44: Italy US Audit Industry Volume (Billion) Forecast, by Application 2020 & 2033
- Table 45: Spain US Audit Industry Revenue (Million) Forecast, by Application 2020 & 2033
- Table 46: Spain US Audit Industry Volume (Billion) Forecast, by Application 2020 & 2033
- Table 47: Russia US Audit Industry Revenue (Million) Forecast, by Application 2020 & 2033
- Table 48: Russia US Audit Industry Volume (Billion) Forecast, by Application 2020 & 2033
- Table 49: Benelux US Audit Industry Revenue (Million) Forecast, by Application 2020 & 2033
- Table 50: Benelux US Audit Industry Volume (Billion) Forecast, by Application 2020 & 2033
- Table 51: Nordics US Audit Industry Revenue (Million) Forecast, by Application 2020 & 2033
- Table 52: Nordics US Audit Industry Volume (Billion) Forecast, by Application 2020 & 2033
- Table 53: Rest of Europe US Audit Industry Revenue (Million) Forecast, by Application 2020 & 2033
- Table 54: Rest of Europe US Audit Industry Volume (Billion) Forecast, by Application 2020 & 2033
- Table 55: Global US Audit Industry Revenue Million Forecast, by Type 2020 & 2033
- Table 56: Global US Audit Industry Volume Billion Forecast, by Type 2020 & 2033
- Table 57: Global US Audit Industry Revenue Million Forecast, by Service line 2020 & 2033
- Table 58: Global US Audit Industry Volume Billion Forecast, by Service line 2020 & 2033
- Table 59: Global US Audit Industry Revenue Million Forecast, by Country 2020 & 2033
- Table 60: Global US Audit Industry Volume Billion Forecast, by Country 2020 & 2033
- Table 61: Turkey US Audit Industry Revenue (Million) Forecast, by Application 2020 & 2033
- Table 62: Turkey US Audit Industry Volume (Billion) Forecast, by Application 2020 & 2033
- Table 63: Israel US Audit Industry Revenue (Million) Forecast, by Application 2020 & 2033
- Table 64: Israel US Audit Industry Volume (Billion) Forecast, by Application 2020 & 2033
- Table 65: GCC US Audit Industry Revenue (Million) Forecast, by Application 2020 & 2033
- Table 66: GCC US Audit Industry Volume (Billion) Forecast, by Application 2020 & 2033
- Table 67: North Africa US Audit Industry Revenue (Million) Forecast, by Application 2020 & 2033
- Table 68: North Africa US Audit Industry Volume (Billion) Forecast, by Application 2020 & 2033
- Table 69: South Africa US Audit Industry Revenue (Million) Forecast, by Application 2020 & 2033
- Table 70: South Africa US Audit Industry Volume (Billion) Forecast, by Application 2020 & 2033
- Table 71: Rest of Middle East & Africa US Audit Industry Revenue (Million) Forecast, by Application 2020 & 2033
- Table 72: Rest of Middle East & Africa US Audit Industry Volume (Billion) Forecast, by Application 2020 & 2033
- Table 73: Global US Audit Industry Revenue Million Forecast, by Type 2020 & 2033
- Table 74: Global US Audit Industry Volume Billion Forecast, by Type 2020 & 2033
- Table 75: Global US Audit Industry Revenue Million Forecast, by Service line 2020 & 2033
- Table 76: Global US Audit Industry Volume Billion Forecast, by Service line 2020 & 2033
- Table 77: Global US Audit Industry Revenue Million Forecast, by Country 2020 & 2033
- Table 78: Global US Audit Industry Volume Billion Forecast, by Country 2020 & 2033
- Table 79: China US Audit Industry Revenue (Million) Forecast, by Application 2020 & 2033
- Table 80: China US Audit Industry Volume (Billion) Forecast, by Application 2020 & 2033
- Table 81: India US Audit Industry Revenue (Million) Forecast, by Application 2020 & 2033
- Table 82: India US Audit Industry Volume (Billion) Forecast, by Application 2020 & 2033
- Table 83: Japan US Audit Industry Revenue (Million) Forecast, by Application 2020 & 2033
- Table 84: Japan US Audit Industry Volume (Billion) Forecast, by Application 2020 & 2033
- Table 85: South Korea US Audit Industry Revenue (Million) Forecast, by Application 2020 & 2033
- Table 86: South Korea US Audit Industry Volume (Billion) Forecast, by Application 2020 & 2033
- Table 87: ASEAN US Audit Industry Revenue (Million) Forecast, by Application 2020 & 2033
- Table 88: ASEAN US Audit Industry Volume (Billion) Forecast, by Application 2020 & 2033
- Table 89: Oceania US Audit Industry Revenue (Million) Forecast, by Application 2020 & 2033
- Table 90: Oceania US Audit Industry Volume (Billion) Forecast, by Application 2020 & 2033
- Table 91: Rest of Asia Pacific US Audit Industry Revenue (Million) Forecast, by Application 2020 & 2033
- Table 92: Rest of Asia Pacific US Audit Industry Volume (Billion) Forecast, by Application 2020 & 2033
Frequently Asked Questions
1. What is the projected Compound Annual Growth Rate (CAGR) of the US Audit Industry?
The projected CAGR is approximately 3.27%.
2. Which companies are prominent players in the US Audit Industry?
Key companies in the market include Deloitte, EY, KPMG, PwC, RSM US, Grant Thornton LLP, A T Kearney, BDO USA, CBIZ & Mayer Hoffman McCann, Crowe Horwath**List Not Exhaustive.
3. What are the main segments of the US Audit Industry?
The market segments include Type, Service line.
4. Can you provide details about the market size?
The market size is estimated to be USD 50.24 Million as of 2022.
5. What are some drivers contributing to market growth?
N/A
6. What are the notable trends driving market growth?
Declining Quality of Auditing from the Big 4.
7. Are there any restraints impacting market growth?
N/A
8. Can you provide examples of recent developments in the market?
In May 2023, Deloitte and Google Cloud have recently bolstered their decade-long alliance, with a specific focus on deploying Google Cloud's cutting-edge Generative AI capabilities across various industries.
9. What pricing options are available for accessing the report?
Pricing options include single-user, multi-user, and enterprise licenses priced at USD 3800, USD 4500, and USD 5800 respectively.
10. Is the market size provided in terms of value or volume?
The market size is provided in terms of value, measured in Million and volume, measured in Billion.
11. Are there any specific market keywords associated with the report?
Yes, the market keyword associated with the report is "US Audit Industry," which aids in identifying and referencing the specific market segment covered.
12. How do I determine which pricing option suits my needs best?
The pricing options vary based on user requirements and access needs. Individual users may opt for single-user licenses, while businesses requiring broader access may choose multi-user or enterprise licenses for cost-effective access to the report.
13. Are there any additional resources or data provided in the US Audit Industry report?
While the report offers comprehensive insights, it's advisable to review the specific contents or supplementary materials provided to ascertain if additional resources or data are available.
14. How can I stay updated on further developments or reports in the US Audit Industry?
To stay informed about further developments, trends, and reports in the US Audit Industry, consider subscribing to industry newsletters, following relevant companies and organizations, or regularly checking reputable industry news sources and publications.
Methodology
Step 1 - Identification of Relevant Samples Size from Population Database


Step 2 - Approaches for Defining Global Market Size (Value, Volume* & Price*)

Note*: In applicable scenarios
Step 3 - Data Sources
Primary Research
- Web Analytics
- Survey Reports
- Research Institute
- Latest Research Reports
- Opinion Leaders
Secondary Research
- Annual Reports
- White Paper
- Latest Press Release
- Industry Association
- Paid Database
- Investor Presentations

Step 4 - Data Triangulation
Involves using different sources of information in order to increase the validity of a study
These sources are likely to be stakeholders in a program - participants, other researchers, program staff, other community members, and so on.
Then we put all data in single framework & apply various statistical tools to find out the dynamic on the market.
During the analysis stage, feedback from the stakeholder groups would be compared to determine areas of agreement as well as areas of divergence