

Key Insights
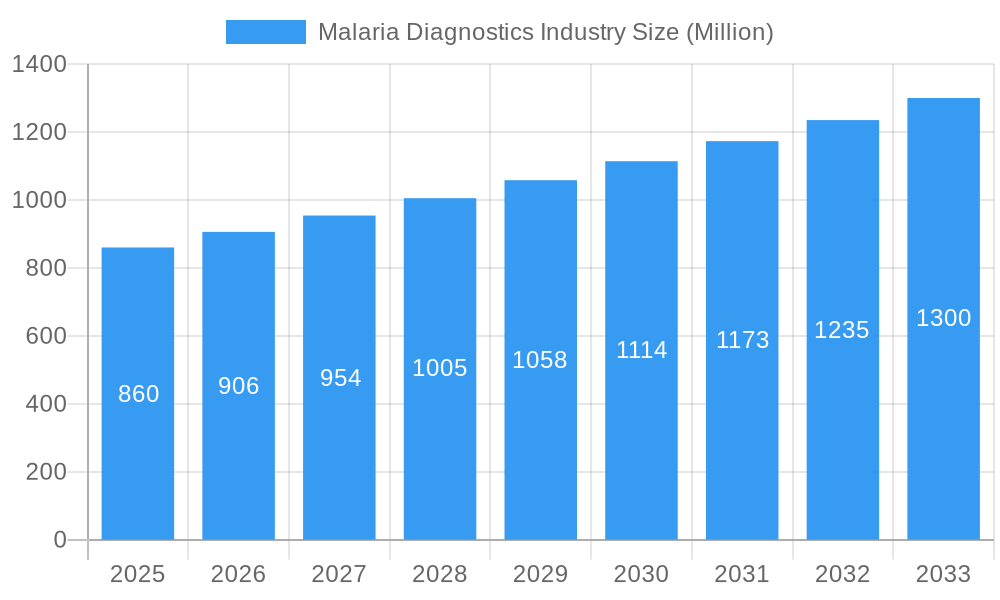
The global malaria diagnostics market, valued at $0.86 billion in 2025, is projected to experience robust growth, driven by increasing malaria prevalence in endemic regions, rising healthcare expenditure, and technological advancements in diagnostic tools. A compound annual growth rate (CAGR) of 5.23% is anticipated from 2025 to 2033, indicating a significant market expansion. Key drivers include the increasing adoption of rapid diagnostic tests (RDTs) due to their ease of use, portability, and affordability, particularly in resource-limited settings. Furthermore, the growing demand for accurate and timely diagnosis to facilitate effective treatment and disease management fuels market growth. Molecular diagnostic techniques, while more expensive, are gaining traction due to their higher sensitivity and specificity, allowing for early detection and improved patient outcomes. Market segmentation reveals significant contributions from clinical diagnostics, microscopic diagnostics, RDTs, and molecular diagnostics. Geographic analysis suggests strong market presence in regions with high malaria burden, such as Africa and Southeast Asia, although North America and Europe also contribute significantly due to advanced healthcare infrastructure and research activities. Market restraints include the emergence of drug-resistant malaria strains requiring more sophisticated diagnostic methods, and inconsistencies in healthcare infrastructure and access across different regions impacting the market's overall growth.
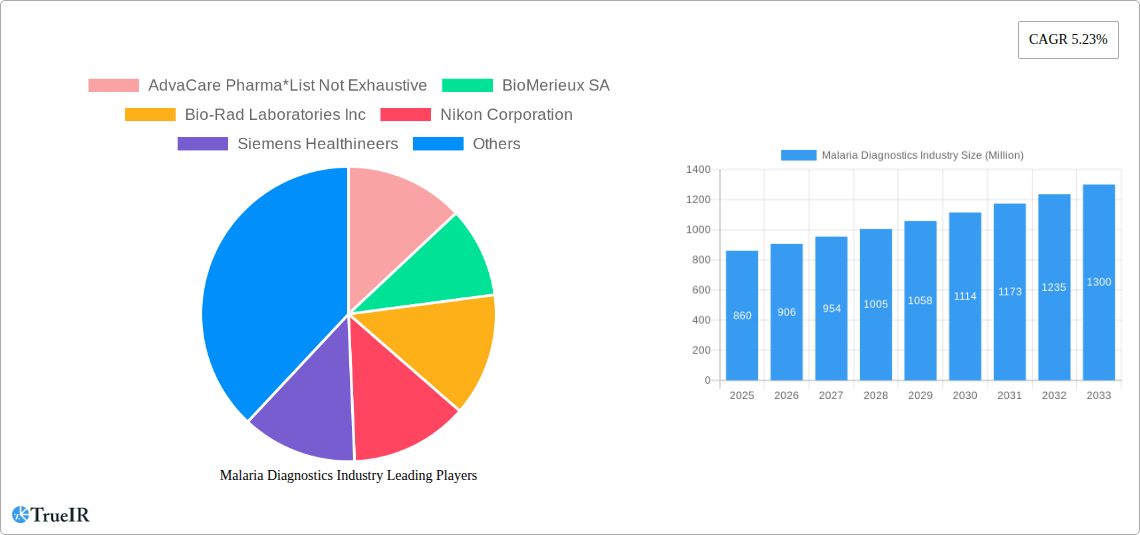
Malaria Diagnostics Industry Market Size (In Million)
The competitive landscape is characterized by a mix of established multinational corporations like Abbott Laboratories, BioMerieux SA, and Thermo Fisher Scientific, alongside smaller players focusing on regional markets. These companies are actively involved in research and development, aiming to introduce innovative diagnostic solutions to improve the accuracy, speed, and accessibility of malaria detection. The market's future depends on sustained investment in R&D, expansion of healthcare infrastructure in endemic areas, effective disease control programs, and the development of cost-effective, highly sensitive, and user-friendly diagnostic tools for widespread adoption. The continuous emergence of new technologies, along with government initiatives to combat malaria, will play a significant role in shaping the market’s trajectory in the coming years.
Malaria Diagnostics Industry Company Market Share
Dynamic Report: Malaria Diagnostics Industry Market Analysis (2019-2033)
This comprehensive report provides a detailed analysis of the Malaria Diagnostics Industry, encompassing market size, trends, competitive landscape, and future projections from 2019 to 2033. Leveraging extensive market research and data analysis, this report is an essential resource for industry stakeholders, investors, and researchers seeking insights into this crucial sector. The study period covers 2019–2033, with 2025 as the base and estimated year, and the forecast period spanning 2025–2033. The historical period analyzed is 2019–2024.
Malaria Diagnostics Industry Market Structure & Competitive Landscape
The Malaria Diagnostics market is characterized by a moderately concentrated structure, with several multinational corporations and regional players dominating various segments. The market concentration ratio (CR4) in 2025 is estimated at xx%, indicating the presence of a few key players holding significant market share. However, the market displays considerable dynamism due to ongoing innovation in diagnostic technologies and the emergence of new entrants.
- Market Concentration: xx% CR4 in 2025 (estimated), with a slight increase projected by 2033.
- Innovation Drivers: Advancements in molecular diagnostics, rapid diagnostic tests (RDTs), and point-of-care testing are driving market growth and competition.
- Regulatory Impacts: Stringent regulatory approvals and quality control standards influence market access and product development. Variations in regulatory landscapes across different regions impact market entry strategies.
- Product Substitutes: While the primary focus remains on accurate and rapid malaria diagnosis, alternative methods may influence market dynamics.
- End-User Segmentation: The market comprises various end-users including hospitals, clinics, research institutions, and public health organizations. Their varying needs and preferences influence product demand.
- M&A Trends: The Malaria Diagnostics sector has witnessed xx M&A deals valued at USD xx Million in the last five years (2019-2024), indicating consolidation trends and strategic expansion among key players. These mergers and acquisitions are primarily driven by the need to expand product portfolios, geographical reach, and technological capabilities.
Malaria Diagnostics Industry Market Trends & Opportunities
The global Malaria Diagnostics market is experiencing significant growth, driven by increasing malaria prevalence, particularly in Sub-Saharan Africa, South Asia, and Southeast Asia. The market size was valued at USD xx Million in 2025 and is projected to reach USD xx Million by 2033, exhibiting a Compound Annual Growth Rate (CAGR) of xx% during the forecast period (2025-2033). This growth is propelled by several factors, including rising healthcare expenditure, increasing government initiatives for malaria eradication, and advancements in diagnostic technologies. Technological shifts towards more accurate, rapid, and cost-effective diagnostic tools are reshaping the market landscape, creating new opportunities for companies specializing in molecular diagnostics and point-of-care testing. Consumer preferences are shifting towards user-friendly, rapid, and reliable diagnostic solutions, impacting product development and market adoption. Competitive dynamics are characterized by ongoing innovation, strategic partnerships, and market consolidation through mergers and acquisitions. Market penetration rates are increasing in underserved regions, driven by targeted public health interventions. The increasing demand for better diagnostic tools and treatment strategies creates substantial opportunities for market expansion.
Dominant Markets & Segments in Malaria Diagnostics Industry
The African continent remains the dominant market for malaria diagnostics due to the high prevalence of the disease. Specific countries like Nigeria, the Democratic Republic of Congo, and Tanzania represent significant growth areas. Within diagnostic technologies, Rapid Diagnostic Tests (RDTs) currently hold the largest market share due to their ease of use, affordability, and suitability for point-of-care testing in resource-limited settings. However, the molecular diagnostics segment is poised for significant growth owing to its superior accuracy and ability to detect drug resistance.
Key Growth Drivers:
- High Malaria Prevalence: Sub-Saharan Africa, South Asia, and Southeast Asia are key regions.
- Government Initiatives: Increased funding for malaria control programs.
- Improved Infrastructure: Expanding healthcare access in underserved areas.
- Technological Advancements: Development of accurate, rapid, and cost-effective diagnostics.
Market Dominance Analysis: The RDT segment’s dominance stems from its cost-effectiveness and suitability for point-of-care settings. However, the molecular diagnostics segment is projected to gain significant traction due to increasing demand for accurate and faster results. The shift towards higher-accuracy diagnostics is a significant market trend.
Malaria Diagnostics Industry Product Analysis
Technological advancements are leading to the development of more sophisticated malaria diagnostic tools. These innovations include improved RDTs with enhanced sensitivity and specificity, advanced molecular diagnostic platforms offering rapid and accurate results, and point-of-care devices designed for use in remote areas. The key competitive advantage lies in delivering accurate, rapid, and cost-effective diagnostics while meeting the specific needs of different healthcare settings and patient populations. This includes ease of use, portability, and integration with existing healthcare infrastructure.
Key Drivers, Barriers & Challenges in Malaria Diagnostics Industry
Key Drivers: Increased funding for malaria control programs, technological advancements resulting in improved diagnostic tools, and growing awareness of malaria's impact are driving market growth. Government initiatives focusing on improved healthcare access and malaria eradication efforts also significantly contribute.
Challenges: Supply chain disruptions impacting the availability of raw materials and diagnostic kits, stringent regulatory approvals, and high costs associated with advanced diagnostic technologies pose significant challenges. Competition from established players also influences market dynamics. Regulatory hurdles and inconsistent healthcare infrastructure in many endemic areas present further obstacles to growth. The estimated impact of supply chain issues on market growth is a reduction of xx% in 2025.
Growth Drivers in the Malaria Diagnostics Industry Market
The increasing prevalence of malaria in many regions of the world, coupled with heightened government funding for malaria control and eradication programs, is a major driver of market growth. Advances in diagnostic technologies, such as more sensitive RDTs and molecular diagnostic methods, are also boosting the market. Improvements in healthcare infrastructure, particularly in developing countries, are further contributing factors.
Challenges Impacting Malaria Diagnostics Industry Growth
Regulatory hurdles, especially concerning the approval and registration of new diagnostic technologies, present challenges. Supply chain complexities, including the procurement and distribution of diagnostic kits in remote areas, create significant obstacles. The high cost associated with advanced technologies, such as molecular diagnostics, limits accessibility in resource-constrained settings. Competition among existing players also restricts market growth.
Key Players Shaping the Malaria Diagnostics Industry Market
- AdvaCare Pharma
- BioMerieux SA
- Bio-Rad Laboratories Inc
- Nikon Corporation
- Siemens Healthineers
- Abbott Laboratories
- Ortho Clinical Diagnostics
- Premier Medical Corporation Pvt Ltd
- Advy Chemical Pvt Ltd
- Zephyr Biomedicals
- Access Bio Inc
- Thermo Fisher Scientific
Significant Malaria Diagnostics Industry Milestones
- June 2022: SC Johnson and the Global Fund partnered to eradicate malaria. The Global Fund's investment of over USD 16 billion highlights the commitment to combating malaria.
- February 2022: The Kenya Medical Research Institute (KEMRI) launched the Plasmochek diagnostic kit, demonstrating ongoing innovation in malaria diagnostics.
Future Outlook for Malaria Diagnostics Industry Market
The Malaria Diagnostics market is poised for continued growth, driven by ongoing innovation, increased investment in malaria control programs, and expansion of healthcare infrastructure. Strategic partnerships between public and private sector stakeholders will be key to achieving widespread access to accurate and affordable diagnostic tools. Focus on developing user-friendly, point-of-care solutions tailored for resource-limited settings will be critical for effective malaria control. The market presents significant opportunities for companies to develop and deploy innovative diagnostic solutions.
Malaria Diagnostics Industry Segmentation
-
1. Technology
- 1.1. Clinical Diagnostics
- 1.2. Microscopic Diagnostics
- 1.3. Rapid Diagnostic Tests (RDTs)
- 1.4. Molecular Diagnostics
- 1.5. Other Technologies
Malaria Diagnostics Industry Segmentation By Geography
-
1. Americas
- 1.1. Venezuela
- 1.2. Brazil
- 1.3. Colombia
- 1.4. Rest of the Americas
-
2. Europe
- 2.1. Germany
- 2.2. United Kingdom
- 2.3. France
- 2.4. Turkey
- 2.5. Spain
- 2.6. Rest of Europe
- 3. Asia Pacific
-
4. India
- 4.1. Myanmar
- 4.2. Indonesia
- 4.3. Pakistan
- 4.4. China
- 4.5. Papua New Guinea
- 4.6. Cambodia
- 4.7. Rest of Asia Pacific
-
5. Africa
- 5.1. Democratic Republic of Congo
- 5.2. Nigeria
- 5.3. Uganda
- 5.4. Rest of Africa
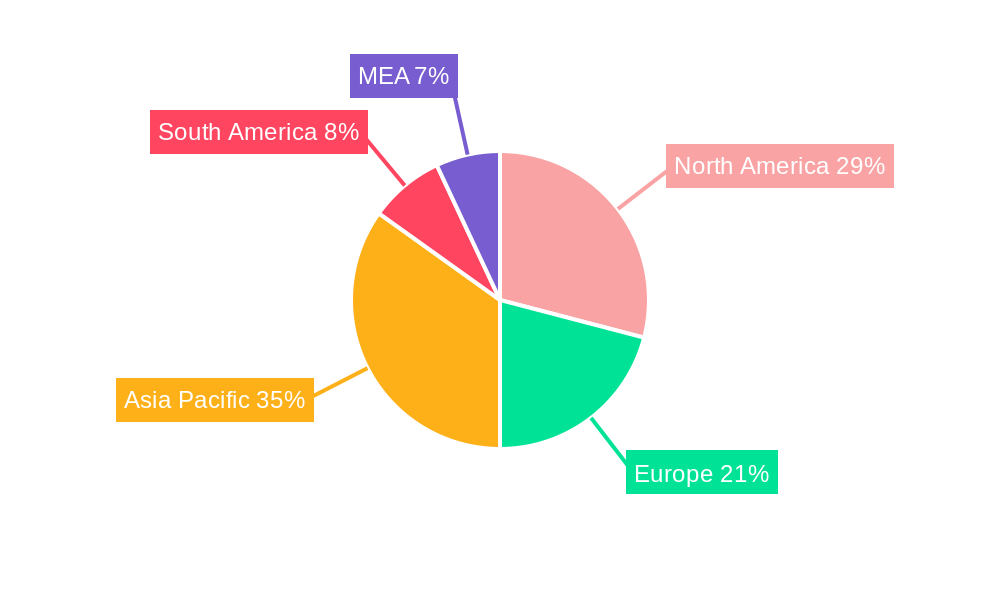
Malaria Diagnostics Industry Regional Market Share
Geographic Coverage of Malaria Diagnostics Industry
Malaria Diagnostics Industry REPORT HIGHLIGHTS
| Aspects | Details |
|---|---|
| Study Period | 2020-2034 |
| Base Year | 2025 |
| Estimated Year | 2026 |
| Forecast Period | 2026-2034 |
| Historical Period | 2020-2025 |
| Growth Rate | CAGR of 5.23% from 2020-2034 |
| Segmentation |
|
Table of Contents
- 1. Introduction
- 1.1. Research Scope
- 1.2. Market Segmentation
- 1.3. Research Objective
- 1.4. Definitions and Assumptions
- 2. Executive Summary
- 2.1. Market Snapshot
- 3. Market Dynamics
- 3.1. Market Drivers
- 3.2. Market Restrains
- 3.3. Market Trends
- 3.4. Market Opportunities
- 4. Market Factor Analysis
- 4.1. Porters Five Forces
- 4.1.1. Bargaining Power of Suppliers
- 4.1.2. Bargaining Power of Buyers
- 4.1.3. Threat of New Entrants
- 4.1.4. Threat of Substitutes
- 4.1.5. Competitive Rivalry
- 4.2. PESTEL analysis
- 4.3. BCG Analysis
- 4.3.1. Stars (High Growth, High Market Share)
- 4.3.2. Cash Cows (Low Growth, High Market Share)
- 4.3.3. Question Mark (High Growth, Low Market Share)
- 4.3.4. Dogs (Low Growth, Low Market Share)
- 4.4. Ansoff Matrix Analysis
- 4.5. Supply Chain Analysis
- 4.6. Regulatory Landscape
- 4.7. Current Market Potential and Opportunity Assessment (TAM–SAM–SOM Framework)
- 4.8. TIR Analyst Note
- 4.1. Porters Five Forces
- 5. Market Analysis, Insights and Forecast 2021-2033
- 5.1. Market Analysis, Insights and Forecast - by Technology
- 5.1.1. Clinical Diagnostics
- 5.1.2. Microscopic Diagnostics
- 5.1.3. Rapid Diagnostic Tests (RDTs)
- 5.1.4. Molecular Diagnostics
- 5.1.5. Other Technologies
- 5.2. Market Analysis, Insights and Forecast - by Region
- 5.2.1. Americas
- 5.2.2. Europe
- 5.2.3. Asia Pacific
- 5.2.4. India
- 5.2.5. Africa
- 5.1. Market Analysis, Insights and Forecast - by Technology
- 6. Global Malaria Diagnostics Industry Analysis, Insights and Forecast, 2021-2033
- 6.1. Market Analysis, Insights and Forecast - by Technology
- 6.1.1. Clinical Diagnostics
- 6.1.2. Microscopic Diagnostics
- 6.1.3. Rapid Diagnostic Tests (RDTs)
- 6.1.4. Molecular Diagnostics
- 6.1.5. Other Technologies
- 6.1. Market Analysis, Insights and Forecast - by Technology
- 7. Americas Malaria Diagnostics Industry Analysis, Insights and Forecast, 2020-2032
- 7.1. Market Analysis, Insights and Forecast - by Technology
- 7.1.1. Clinical Diagnostics
- 7.1.2. Microscopic Diagnostics
- 7.1.3. Rapid Diagnostic Tests (RDTs)
- 7.1.4. Molecular Diagnostics
- 7.1.5. Other Technologies
- 7.1. Market Analysis, Insights and Forecast - by Technology
- 8. Europe Malaria Diagnostics Industry Analysis, Insights and Forecast, 2020-2032
- 8.1. Market Analysis, Insights and Forecast - by Technology
- 8.1.1. Clinical Diagnostics
- 8.1.2. Microscopic Diagnostics
- 8.1.3. Rapid Diagnostic Tests (RDTs)
- 8.1.4. Molecular Diagnostics
- 8.1.5. Other Technologies
- 8.1. Market Analysis, Insights and Forecast - by Technology
- 9. Asia Pacific Malaria Diagnostics Industry Analysis, Insights and Forecast, 2020-2032
- 9.1. Market Analysis, Insights and Forecast - by Technology
- 9.1.1. Clinical Diagnostics
- 9.1.2. Microscopic Diagnostics
- 9.1.3. Rapid Diagnostic Tests (RDTs)
- 9.1.4. Molecular Diagnostics
- 9.1.5. Other Technologies
- 9.1. Market Analysis, Insights and Forecast - by Technology
- 10. India Malaria Diagnostics Industry Analysis, Insights and Forecast, 2020-2032
- 10.1. Market Analysis, Insights and Forecast - by Technology
- 10.1.1. Clinical Diagnostics
- 10.1.2. Microscopic Diagnostics
- 10.1.3. Rapid Diagnostic Tests (RDTs)
- 10.1.4. Molecular Diagnostics
- 10.1.5. Other Technologies
- 10.1. Market Analysis, Insights and Forecast - by Technology
- 11. Africa Malaria Diagnostics Industry Analysis, Insights and Forecast, 2020-2032
- 11.1. Market Analysis, Insights and Forecast - by Technology
- 11.1.1. Clinical Diagnostics
- 11.1.2. Microscopic Diagnostics
- 11.1.3. Rapid Diagnostic Tests (RDTs)
- 11.1.4. Molecular Diagnostics
- 11.1.5. Other Technologies
- 11.1. Market Analysis, Insights and Forecast - by Technology
- 12. Competitive Analysis
- 12.1. Company Profiles
- 12.1.1 AdvaCare Pharma*List Not Exhaustive
- 12.1.1.1. Company Overview
- 12.1.1.2. Products
- 12.1.1.3. Company Financials
- 12.1.1.4. SWOT Analysis
- 12.1.2 BioMerieux SA
- 12.1.2.1. Company Overview
- 12.1.2.2. Products
- 12.1.2.3. Company Financials
- 12.1.2.4. SWOT Analysis
- 12.1.3 Bio-Rad Laboratories Inc
- 12.1.3.1. Company Overview
- 12.1.3.2. Products
- 12.1.3.3. Company Financials
- 12.1.3.4. SWOT Analysis
- 12.1.4 Nikon Corporation
- 12.1.4.1. Company Overview
- 12.1.4.2. Products
- 12.1.4.3. Company Financials
- 12.1.4.4. SWOT Analysis
- 12.1.5 Siemens Healthineers
- 12.1.5.1. Company Overview
- 12.1.5.2. Products
- 12.1.5.3. Company Financials
- 12.1.5.4. SWOT Analysis
- 12.1.6 Abbott Laboratories
- 12.1.6.1. Company Overview
- 12.1.6.2. Products
- 12.1.6.3. Company Financials
- 12.1.6.4. SWOT Analysis
- 12.1.7 Ortho Clinical Diagnostics
- 12.1.7.1. Company Overview
- 12.1.7.2. Products
- 12.1.7.3. Company Financials
- 12.1.7.4. SWOT Analysis
- 12.1.8 Premier Medical Corporation Pvt Ltd
- 12.1.8.1. Company Overview
- 12.1.8.2. Products
- 12.1.8.3. Company Financials
- 12.1.8.4. SWOT Analysis
- 12.1.9 Advy Chemical Pvt Ltd
- 12.1.9.1. Company Overview
- 12.1.9.2. Products
- 12.1.9.3. Company Financials
- 12.1.9.4. SWOT Analysis
- 12.1.10 Zephyr Biomedicals
- 12.1.10.1. Company Overview
- 12.1.10.2. Products
- 12.1.10.3. Company Financials
- 12.1.10.4. SWOT Analysis
- 12.1.11 Access Bio Inc
- 12.1.11.1. Company Overview
- 12.1.11.2. Products
- 12.1.11.3. Company Financials
- 12.1.11.4. SWOT Analysis
- 12.1.12 Thermo Fisher Scientific
- 12.1.12.1. Company Overview
- 12.1.12.2. Products
- 12.1.12.3. Company Financials
- 12.1.12.4. SWOT Analysis
- 12.1.1 AdvaCare Pharma*List Not Exhaustive
- 12.2. Market Entropy
- 12.2.1 Company's Key Areas Served
- 12.2.2 Recent Developments
- 12.3. Company Market Share Analysis 2025
- 12.3.1 Top 5 Companies Market Share Analysis
- 12.3.2 Top 3 Companies Market Share Analysis
- 12.4. List of Potential Customers
- 13. Research Methodology
List of Figures
- Figure 1: Global Malaria Diagnostics Industry Revenue Breakdown (Million, %) by Region 2025 & 2033
- Figure 2: Americas Malaria Diagnostics Industry Revenue (Million), by Technology 2025 & 2033
- Figure 3: Americas Malaria Diagnostics Industry Revenue Share (%), by Technology 2025 & 2033
- Figure 4: Americas Malaria Diagnostics Industry Revenue (Million), by Country 2025 & 2033
- Figure 5: Americas Malaria Diagnostics Industry Revenue Share (%), by Country 2025 & 2033
- Figure 6: Europe Malaria Diagnostics Industry Revenue (Million), by Technology 2025 & 2033
- Figure 7: Europe Malaria Diagnostics Industry Revenue Share (%), by Technology 2025 & 2033
- Figure 8: Europe Malaria Diagnostics Industry Revenue (Million), by Country 2025 & 2033
- Figure 9: Europe Malaria Diagnostics Industry Revenue Share (%), by Country 2025 & 2033
- Figure 10: Asia Pacific Malaria Diagnostics Industry Revenue (Million), by Technology 2025 & 2033
- Figure 11: Asia Pacific Malaria Diagnostics Industry Revenue Share (%), by Technology 2025 & 2033
- Figure 12: Asia Pacific Malaria Diagnostics Industry Revenue (Million), by Country 2025 & 2033
- Figure 13: Asia Pacific Malaria Diagnostics Industry Revenue Share (%), by Country 2025 & 2033
- Figure 14: India Malaria Diagnostics Industry Revenue (Million), by Technology 2025 & 2033
- Figure 15: India Malaria Diagnostics Industry Revenue Share (%), by Technology 2025 & 2033
- Figure 16: India Malaria Diagnostics Industry Revenue (Million), by Country 2025 & 2033
- Figure 17: India Malaria Diagnostics Industry Revenue Share (%), by Country 2025 & 2033
- Figure 18: Africa Malaria Diagnostics Industry Revenue (Million), by Technology 2025 & 2033
- Figure 19: Africa Malaria Diagnostics Industry Revenue Share (%), by Technology 2025 & 2033
- Figure 20: Africa Malaria Diagnostics Industry Revenue (Million), by Country 2025 & 2033
- Figure 21: Africa Malaria Diagnostics Industry Revenue Share (%), by Country 2025 & 2033
List of Tables
- Table 1: Global Malaria Diagnostics Industry Revenue Million Forecast, by Technology 2020 & 2033
- Table 2: Global Malaria Diagnostics Industry Revenue Million Forecast, by Region 2020 & 2033
- Table 3: Global Malaria Diagnostics Industry Revenue Million Forecast, by Technology 2020 & 2033
- Table 4: Global Malaria Diagnostics Industry Revenue Million Forecast, by Country 2020 & 2033
- Table 5: Venezuela Malaria Diagnostics Industry Revenue (Million) Forecast, by Application 2020 & 2033
- Table 6: Brazil Malaria Diagnostics Industry Revenue (Million) Forecast, by Application 2020 & 2033
- Table 7: Colombia Malaria Diagnostics Industry Revenue (Million) Forecast, by Application 2020 & 2033
- Table 8: Rest of the Americas Malaria Diagnostics Industry Revenue (Million) Forecast, by Application 2020 & 2033
- Table 9: Global Malaria Diagnostics Industry Revenue Million Forecast, by Technology 2020 & 2033
- Table 10: Global Malaria Diagnostics Industry Revenue Million Forecast, by Country 2020 & 2033
- Table 11: Germany Malaria Diagnostics Industry Revenue (Million) Forecast, by Application 2020 & 2033
- Table 12: United Kingdom Malaria Diagnostics Industry Revenue (Million) Forecast, by Application 2020 & 2033
- Table 13: France Malaria Diagnostics Industry Revenue (Million) Forecast, by Application 2020 & 2033
- Table 14: Turkey Malaria Diagnostics Industry Revenue (Million) Forecast, by Application 2020 & 2033
- Table 15: Spain Malaria Diagnostics Industry Revenue (Million) Forecast, by Application 2020 & 2033
- Table 16: Rest of Europe Malaria Diagnostics Industry Revenue (Million) Forecast, by Application 2020 & 2033
- Table 17: Global Malaria Diagnostics Industry Revenue Million Forecast, by Technology 2020 & 2033
- Table 18: Global Malaria Diagnostics Industry Revenue Million Forecast, by Country 2020 & 2033
- Table 19: Global Malaria Diagnostics Industry Revenue Million Forecast, by Technology 2020 & 2033
- Table 20: Global Malaria Diagnostics Industry Revenue Million Forecast, by Country 2020 & 2033
- Table 21: Myanmar Malaria Diagnostics Industry Revenue (Million) Forecast, by Application 2020 & 2033
- Table 22: Indonesia Malaria Diagnostics Industry Revenue (Million) Forecast, by Application 2020 & 2033
- Table 23: Pakistan Malaria Diagnostics Industry Revenue (Million) Forecast, by Application 2020 & 2033
- Table 24: China Malaria Diagnostics Industry Revenue (Million) Forecast, by Application 2020 & 2033
- Table 25: Papua New Guinea Malaria Diagnostics Industry Revenue (Million) Forecast, by Application 2020 & 2033
- Table 26: Cambodia Malaria Diagnostics Industry Revenue (Million) Forecast, by Application 2020 & 2033
- Table 27: Rest of Asia Pacific Malaria Diagnostics Industry Revenue (Million) Forecast, by Application 2020 & 2033
- Table 28: Global Malaria Diagnostics Industry Revenue Million Forecast, by Technology 2020 & 2033
- Table 29: Global Malaria Diagnostics Industry Revenue Million Forecast, by Country 2020 & 2033
- Table 30: Democratic Republic of Congo Malaria Diagnostics Industry Revenue (Million) Forecast, by Application 2020 & 2033
- Table 31: Nigeria Malaria Diagnostics Industry Revenue (Million) Forecast, by Application 2020 & 2033
- Table 32: Uganda Malaria Diagnostics Industry Revenue (Million) Forecast, by Application 2020 & 2033
- Table 33: Rest of Africa Malaria Diagnostics Industry Revenue (Million) Forecast, by Application 2020 & 2033
Frequently Asked Questions
1. What is the projected Compound Annual Growth Rate (CAGR) of the Malaria Diagnostics Industry?
The projected CAGR is approximately 5.23%.
2. Which companies are prominent players in the Malaria Diagnostics Industry?
Key companies in the market include AdvaCare Pharma*List Not Exhaustive, BioMerieux SA, Bio-Rad Laboratories Inc, Nikon Corporation, Siemens Healthineers, Abbott Laboratories, Ortho Clinical Diagnostics, Premier Medical Corporation Pvt Ltd, Advy Chemical Pvt Ltd, Zephyr Biomedicals, Access Bio Inc, Thermo Fisher Scientific.
3. What are the main segments of the Malaria Diagnostics Industry?
The market segments include Technology.
4. Can you provide details about the market size?
The market size is estimated to be USD 0.86 Million as of 2022.
5. What are some drivers contributing to market growth?
Growing Demand for Diagnostic Tools in Malaria-endemic Regions; Increasing Technological Advancements and Efficient Diagnostics; Scale-up of Rapid Diagnostic Tests and Universal Access to Diagnosis.
6. What are the notable trends driving market growth?
Microscopic Diagnostics is Expected to Hold the Highest Market Share in the Technology Segment.
7. Are there any restraints impacting market growth?
Increasing Number of Malaria-free Countries; Rising Demand for Low-cost Diagnostic Tools.
8. Can you provide examples of recent developments in the market?
In June 2022, SC Johnson and Global Fund partnered to eradicate malaria. The Global Fund provides 56% of all international financing for malaria programs (39% of total available resources) and invested more than USD 16 billion in malaria control programs to date.
9. What pricing options are available for accessing the report?
Pricing options include single-user, multi-user, and enterprise licenses priced at USD 4750, USD 5250, and USD 8750 respectively.
10. Is the market size provided in terms of value or volume?
The market size is provided in terms of value, measured in Million.
11. Are there any specific market keywords associated with the report?
Yes, the market keyword associated with the report is "Malaria Diagnostics Industry," which aids in identifying and referencing the specific market segment covered.
12. How do I determine which pricing option suits my needs best?
The pricing options vary based on user requirements and access needs. Individual users may opt for single-user licenses, while businesses requiring broader access may choose multi-user or enterprise licenses for cost-effective access to the report.
13. Are there any additional resources or data provided in the Malaria Diagnostics Industry report?
While the report offers comprehensive insights, it's advisable to review the specific contents or supplementary materials provided to ascertain if additional resources or data are available.
14. How can I stay updated on further developments or reports in the Malaria Diagnostics Industry?
To stay informed about further developments, trends, and reports in the Malaria Diagnostics Industry, consider subscribing to industry newsletters, following relevant companies and organizations, or regularly checking reputable industry news sources and publications.
Methodology
Step 1 - Identification of Relevant Samples Size from Population Database


Step 2 - Approaches for Defining Global Market Size (Value, Volume* & Price*)

Note*: In applicable scenarios
Step 3 - Data Sources
Primary Research
- Web Analytics
- Survey Reports
- Research Institute
- Latest Research Reports
- Opinion Leaders
Secondary Research
- Annual Reports
- White Paper
- Latest Press Release
- Industry Association
- Paid Database
- Investor Presentations

Step 4 - Data Triangulation
Involves using different sources of information in order to increase the validity of a study
These sources are likely to be stakeholders in a program - participants, other researchers, program staff, other community members, and so on.
Then we put all data in single framework & apply various statistical tools to find out the dynamic on the market.
During the analysis stage, feedback from the stakeholder groups would be compared to determine areas of agreement as well as areas of divergence