

Key Insights
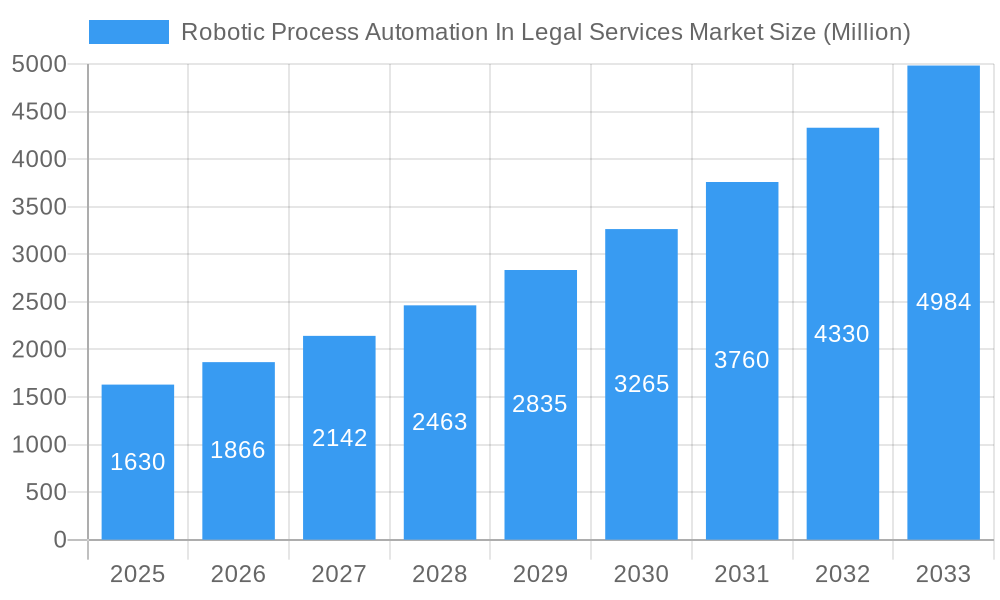
The Robotic Process Automation (RPA) in Legal Services market is experiencing significant growth, driven by the increasing need for efficiency and accuracy in legal processes. With a market size of $1.63 billion in 2025 and a Compound Annual Growth Rate (CAGR) of 14.65%, the market is projected to reach substantial value by 2033. Key drivers include the rising volume of legal documents, the need to reduce operational costs, and the increasing adoption of cloud-based solutions. Trends such as the integration of AI and machine learning capabilities within RPA platforms are further fueling market expansion. While challenges like data security concerns and the need for skilled professionals exist, the overall market outlook remains positive. Leading players like UiPath, Blue Prism, Automation Anywhere, and others are actively contributing to innovation and market penetration. The market is segmented based on deployment (cloud, on-premise), service type (consulting, implementation), and application (e-discovery, contract management). The legal sector's increasing reliance on technology to handle large volumes of data and complex processes provides a fertile ground for RPA adoption, fostering continued market expansion. The historical period (2019-2024) witnessed a strong foundational growth paving the way for the projected exponential increase in the forecast period (2025-2033).
Robotic Process Automation In Legal Services Market Market Size (In Billion)
The strong CAGR indicates consistent growth trajectory and anticipates higher adoption of RPA across various legal domains including law firms, corporate legal departments, and government agencies. Increased investment in research and development by key players, coupled with strategic partnerships and mergers and acquisitions, will further propel the market growth. Regional analysis reveals strong market penetration in North America and Europe, with Asia-Pacific expected to witness significant growth in the coming years. This growth is expected to be fueled by the increasing adoption of advanced technologies, rising disposable incomes, and improved digital infrastructure across the region. Continuous improvements in RPA software, particularly in the areas of natural language processing (NLP) and intelligent document processing (IDP), are enhancing the functionality and usefulness of these solutions for legal professionals.
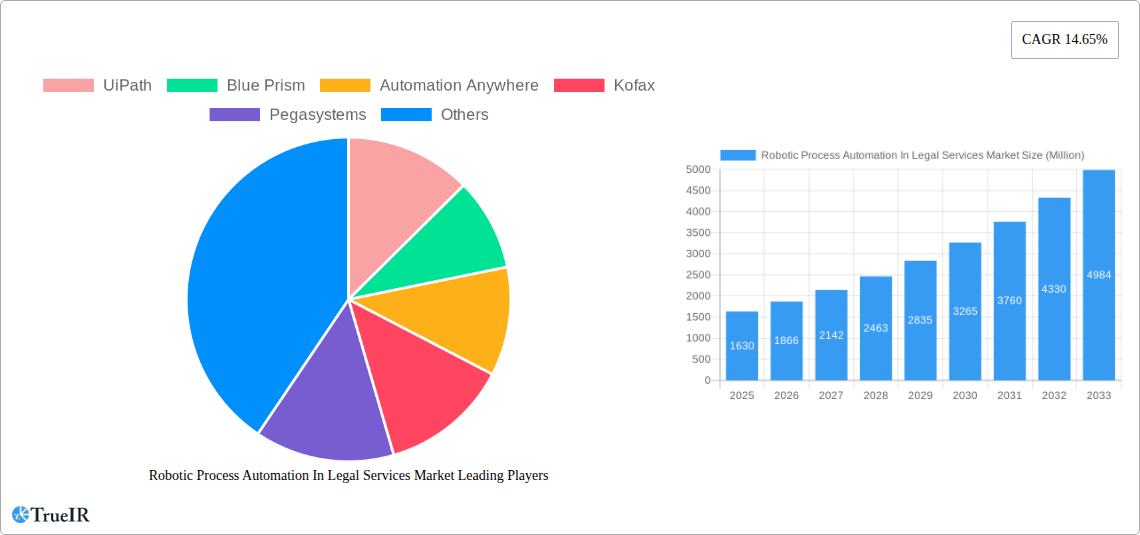
Robotic Process Automation In Legal Services Market Company Market Share
Robotic Process Automation in Legal Services Market: A Comprehensive Report (2019-2033)
This dynamic report provides a detailed analysis of the Robotic Process Automation (RPA) in Legal Services market, offering invaluable insights for stakeholders seeking to navigate this rapidly evolving landscape. Leveraging extensive research and data analysis covering the period 2019-2033 (with a base year of 2025 and forecast period 2025-2033), this report unravels market trends, competitive dynamics, and future growth potential. The market is projected to reach xx Million by 2033, exhibiting a significant CAGR of xx% during the forecast period.
Robotic Process Automation In Legal Services Market Market Structure & Competitive Landscape
The Robotic Process Automation in Legal Services market exhibits a moderately concentrated structure, with key players vying for market share through innovation and strategic acquisitions. The market concentration ratio (CR4) is estimated at xx%, indicating the influence of leading vendors. Major players include UiPath, Blue Prism, Automation Anywhere, Kofax, Pegasystems, NICE, IBM, WorkFusion, EdgeVerve, and Kira Systems, though the list is not exhaustive.
Key Factors Shaping the Market Structure:
- Innovation Drivers: Continuous advancements in AI, machine learning, and natural language processing are driving the development of sophisticated RPA solutions tailored to the specific needs of legal professionals.
- Regulatory Impacts: Data privacy regulations (e.g., GDPR) are influencing the adoption of secure and compliant RPA solutions.
- Product Substitutes: While RPA offers distinct advantages, alternative solutions like traditional outsourcing and manual processes continue to exist, creating competitive pressure.
- End-User Segmentation: The market caters to diverse legal entities, including law firms of varying sizes, corporate legal departments, and government agencies, each with unique RPA requirements.
- M&A Trends: The market has witnessed a moderate level of mergers and acquisitions (M&A) activity, with xx major deals recorded between 2019 and 2024, driven by companies seeking to expand their capabilities and market reach.
Robotic Process Automation In Legal Services Market Market Trends & Opportunities
The RPA in Legal Services market is experiencing robust growth, driven by several key factors. The market size reached xx Million in 2024 and is projected to reach xx Million by 2025. This growth is fueled by the increasing adoption of automation technologies within legal firms to enhance efficiency, reduce operational costs, and improve accuracy. Technological advancements, such as the integration of AI and machine learning, are further augmenting the capabilities of RPA solutions, leading to greater market penetration.
Technological advancements, particularly in AI and machine learning, are improving RPA solutions' ability to handle complex legal tasks, such as contract review and due diligence. Consumer preference is shifting towards automation solutions that offer improved efficiency, cost savings, and reduced human error, further fueling market growth. This creates significant opportunities for RPA vendors to expand their offerings and cater to the evolving needs of the legal sector. The competitive dynamics are characterized by a mix of established players and emerging innovative companies.
Dominant Markets & Segments in Robotic Process Automation In Legal Services Market
The North American region currently holds the dominant position in the RPA in Legal Services market, driven by factors such as high technological adoption rates, a robust legal infrastructure, and the presence of major RPA vendors. Within North America, the United States dominates due to the high concentration of large law firms and corporate legal departments.
Key Growth Drivers in North America:
- Well-developed legal infrastructure: Supporting high RPA adoption.
- High investment in technology: Leading to faster adoption and innovation.
- Presence of major RPA vendors: Creates a competitive landscape.
- Government initiatives: Promoting digital transformation.
Europe is the second largest market, with growth driven by the increasing adoption of cloud-based RPA solutions and regulatory requirements like GDPR. The Asia-Pacific region is emerging as a key growth area, propelled by rising digitalization, increased investment in technology, and growing legal sectors in countries like India and China.
Robotic Process Automation In Legal Services Market Product Analysis
RPA solutions in the legal sector are evolving beyond basic task automation. Innovative products now incorporate AI and machine learning to perform complex tasks such as contract analysis, legal research, and due diligence with enhanced accuracy and speed. These advanced solutions offer substantial competitive advantages by streamlining workflows, improving decision-making, and enhancing compliance.
Key Drivers, Barriers & Challenges in Robotic Process Automation In Legal Services Market
Key Drivers:
The legal industry's increasing need for efficiency and cost reduction drives RPA adoption. Technological advancements, particularly AI and machine learning integration, enhance RPA's capabilities, leading to broader application. Regulatory pressures, such as compliance requirements, also push companies toward adopting RPA for improved data security and accuracy.
Challenges:
High initial investment costs, integration complexities with existing systems, and a lack of skilled professionals to implement and manage RPA solutions are significant barriers. Data security concerns and the risk of unforeseen errors also pose challenges. Furthermore, competitive pressure from other automation technologies requires constant innovation to maintain a market edge. The impact is quantifiable as it can slow down adoption rates and market expansion.
Growth Drivers in the Robotic Process Automation In Legal Services Market Market
Technological advancements like AI and machine learning, coupled with the increasing need for efficiency and accuracy within the legal sector, are primary drivers. Government initiatives promoting digital transformation and cost-reduction strategies in legal operations further stimulate growth. Regulations driving data security and compliance are also contributing factors.
Challenges Impacting Robotic Process Automation In Legal Services Market Growth
High implementation costs, the need for specialized expertise, and concerns regarding data security and the potential for errors are significant barriers. Integration complexities with legacy systems and the ongoing competition from alternative automation technologies also present hurdles to growth. These challenges affect market expansion and adoption rates.
Key Players Shaping the Robotic Process Automation In Legal Services Market Market
- UiPath
- Blue Prism
- Automation Anywhere
- Kofax
- Pegasystems
- NICE
- IBM
- WorkFusion
- EdgeVerve
- Kira Systems
Significant Robotic Process Automation In Legal Services Market Industry Milestones
- July 2024: One Equity Partners (OEP) invested in Comau, strengthening the industrial automation sector's ties to RPA.
- June 2023: Expert.ai partnered with SS&C Blue Prism, integrating AI-powered language solutions with RPA. This enhances the capabilities of RPA in legal applications, boosting market growth.
Future Outlook for Robotic Process Automation In Legal Services Market Market
The RPA in Legal Services market is poised for continued growth, driven by ongoing technological innovations and increasing demand for efficiency and cost reduction. Strategic partnerships and acquisitions will shape the competitive landscape, while the expansion into new applications and geographies will open up lucrative opportunities for market participants. The market's future hinges on addressing challenges related to integration, data security, and workforce training to fully realize its potential.
Robotic Process Automation In Legal Services Market Segmentation
-
1. Deployment Mode
- 1.1. On-premise
- 1.2. Cloud
-
2. Solution
- 2.1. Software
- 2.2. Service
Robotic Process Automation In Legal Services Market Segmentation By Geography
-
1. North America
- 1.1. United States
- 1.2. Canada
- 1.3. Rest of North America
-
2. Europe
- 2.1. Germany
- 2.2. United Kingdom
- 2.3. France
- 2.4. Russia
- 2.5. Spain
- 2.6. Rest of Europe
-
3. Asia Pacific
- 3.1. India
- 3.2. China
- 3.3. Japan
- 3.4. Rest of Asia Pacific
-
4. South America
- 4.1. Brazil
- 4.2. Argentina
- 4.3. Rest of South America
-
5. Middle East and Africa
- 5.1. United Arab Emirates
- 5.2. Saudi Arabia
- 5.3. Rest of Middle East and Africa
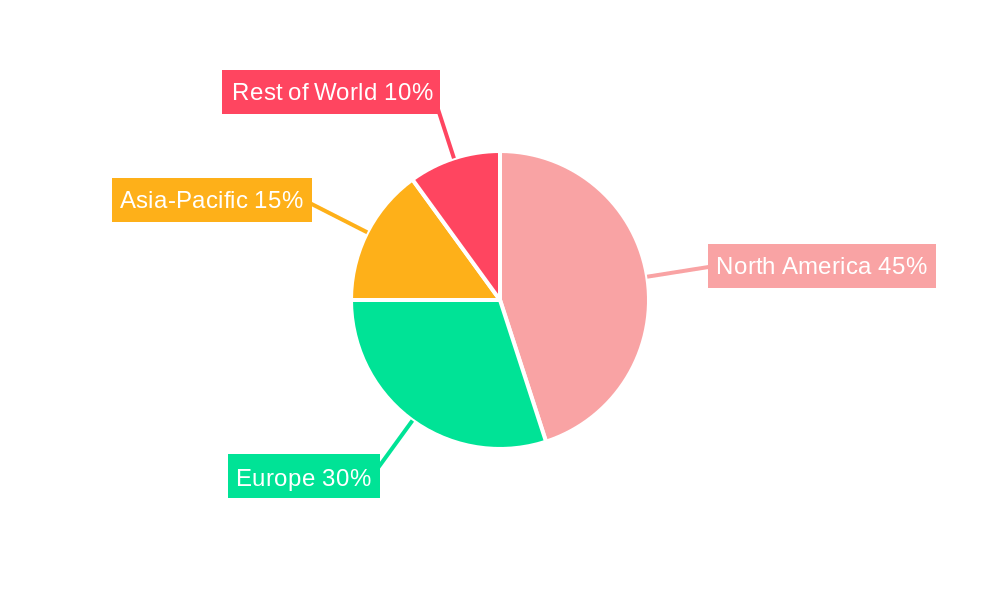
Robotic Process Automation In Legal Services Market Regional Market Share
Geographic Coverage of Robotic Process Automation In Legal Services Market
Robotic Process Automation In Legal Services Market REPORT HIGHLIGHTS
| Aspects | Details |
|---|---|
| Study Period | 2020-2034 |
| Base Year | 2025 |
| Estimated Year | 2026 |
| Forecast Period | 2026-2034 |
| Historical Period | 2020-2025 |
| Growth Rate | CAGR of 14.65% from 2020-2034 |
| Segmentation |
|
Table of Contents
- 1. Introduction
- 1.1. Research Scope
- 1.2. Market Segmentation
- 1.3. Research Objective
- 1.4. Definitions and Assumptions
- 2. Executive Summary
- 2.1. Market Snapshot
- 3. Market Dynamics
- 3.1. Market Drivers
- 3.2. Market Restrains
- 3.3. Market Trends
- 3.4. Market Opportunities
- 4. Market Factor Analysis
- 4.1. Porters Five Forces
- 4.1.1. Bargaining Power of Suppliers
- 4.1.2. Bargaining Power of Buyers
- 4.1.3. Threat of New Entrants
- 4.1.4. Threat of Substitutes
- 4.1.5. Competitive Rivalry
- 4.2. PESTEL analysis
- 4.3. BCG Analysis
- 4.3.1. Stars (High Growth, High Market Share)
- 4.3.2. Cash Cows (Low Growth, High Market Share)
- 4.3.3. Question Mark (High Growth, Low Market Share)
- 4.3.4. Dogs (Low Growth, Low Market Share)
- 4.4. Ansoff Matrix Analysis
- 4.5. Supply Chain Analysis
- 4.6. Regulatory Landscape
- 4.7. Current Market Potential and Opportunity Assessment (TAM–SAM–SOM Framework)
- 4.8. TIR Analyst Note
- 4.1. Porters Five Forces
- 5. Market Analysis, Insights and Forecast 2021-2033
- 5.1. Market Analysis, Insights and Forecast - by Deployment Mode
- 5.1.1. On-premise
- 5.1.2. Cloud
- 5.2. Market Analysis, Insights and Forecast - by Solution
- 5.2.1. Software
- 5.2.2. Service
- 5.3. Market Analysis, Insights and Forecast - by Region
- 5.3.1. North America
- 5.3.2. Europe
- 5.3.3. Asia Pacific
- 5.3.4. South America
- 5.3.5. Middle East and Africa
- 5.1. Market Analysis, Insights and Forecast - by Deployment Mode
- 6. Global Robotic Process Automation In Legal Services Market Analysis, Insights and Forecast, 2021-2033
- 6.1. Market Analysis, Insights and Forecast - by Deployment Mode
- 6.1.1. On-premise
- 6.1.2. Cloud
- 6.2. Market Analysis, Insights and Forecast - by Solution
- 6.2.1. Software
- 6.2.2. Service
- 6.1. Market Analysis, Insights and Forecast - by Deployment Mode
- 7. North America Robotic Process Automation In Legal Services Market Analysis, Insights and Forecast, 2020-2032
- 7.1. Market Analysis, Insights and Forecast - by Deployment Mode
- 7.1.1. On-premise
- 7.1.2. Cloud
- 7.2. Market Analysis, Insights and Forecast - by Solution
- 7.2.1. Software
- 7.2.2. Service
- 7.1. Market Analysis, Insights and Forecast - by Deployment Mode
- 8. Europe Robotic Process Automation In Legal Services Market Analysis, Insights and Forecast, 2020-2032
- 8.1. Market Analysis, Insights and Forecast - by Deployment Mode
- 8.1.1. On-premise
- 8.1.2. Cloud
- 8.2. Market Analysis, Insights and Forecast - by Solution
- 8.2.1. Software
- 8.2.2. Service
- 8.1. Market Analysis, Insights and Forecast - by Deployment Mode
- 9. Asia Pacific Robotic Process Automation In Legal Services Market Analysis, Insights and Forecast, 2020-2032
- 9.1. Market Analysis, Insights and Forecast - by Deployment Mode
- 9.1.1. On-premise
- 9.1.2. Cloud
- 9.2. Market Analysis, Insights and Forecast - by Solution
- 9.2.1. Software
- 9.2.2. Service
- 9.1. Market Analysis, Insights and Forecast - by Deployment Mode
- 10. South America Robotic Process Automation In Legal Services Market Analysis, Insights and Forecast, 2020-2032
- 10.1. Market Analysis, Insights and Forecast - by Deployment Mode
- 10.1.1. On-premise
- 10.1.2. Cloud
- 10.2. Market Analysis, Insights and Forecast - by Solution
- 10.2.1. Software
- 10.2.2. Service
- 10.1. Market Analysis, Insights and Forecast - by Deployment Mode
- 11. Middle East and Africa Robotic Process Automation In Legal Services Market Analysis, Insights and Forecast, 2020-2032
- 11.1. Market Analysis, Insights and Forecast - by Deployment Mode
- 11.1.1. On-premise
- 11.1.2. Cloud
- 11.2. Market Analysis, Insights and Forecast - by Solution
- 11.2.1. Software
- 11.2.2. Service
- 11.1. Market Analysis, Insights and Forecast - by Deployment Mode
- 12. Competitive Analysis
- 12.1. Company Profiles
- 12.1.1 UiPath
- 12.1.1.1. Company Overview
- 12.1.1.2. Products
- 12.1.1.3. Company Financials
- 12.1.1.4. SWOT Analysis
- 12.1.2 Blue Prism
- 12.1.2.1. Company Overview
- 12.1.2.2. Products
- 12.1.2.3. Company Financials
- 12.1.2.4. SWOT Analysis
- 12.1.3 Automation Anywhere
- 12.1.3.1. Company Overview
- 12.1.3.2. Products
- 12.1.3.3. Company Financials
- 12.1.3.4. SWOT Analysis
- 12.1.4 Kofax
- 12.1.4.1. Company Overview
- 12.1.4.2. Products
- 12.1.4.3. Company Financials
- 12.1.4.4. SWOT Analysis
- 12.1.5 Pegasystems
- 12.1.5.1. Company Overview
- 12.1.5.2. Products
- 12.1.5.3. Company Financials
- 12.1.5.4. SWOT Analysis
- 12.1.6 NICE
- 12.1.6.1. Company Overview
- 12.1.6.2. Products
- 12.1.6.3. Company Financials
- 12.1.6.4. SWOT Analysis
- 12.1.7 IBM
- 12.1.7.1. Company Overview
- 12.1.7.2. Products
- 12.1.7.3. Company Financials
- 12.1.7.4. SWOT Analysis
- 12.1.8 WorkFusion
- 12.1.8.1. Company Overview
- 12.1.8.2. Products
- 12.1.8.3. Company Financials
- 12.1.8.4. SWOT Analysis
- 12.1.9 EdgeVerve
- 12.1.9.1. Company Overview
- 12.1.9.2. Products
- 12.1.9.3. Company Financials
- 12.1.9.4. SWOT Analysis
- 12.1.10 Kira Systems**List Not Exhaustive
- 12.1.10.1. Company Overview
- 12.1.10.2. Products
- 12.1.10.3. Company Financials
- 12.1.10.4. SWOT Analysis
- 12.1.1 UiPath
- 12.2. Market Entropy
- 12.2.1 Company's Key Areas Served
- 12.2.2 Recent Developments
- 12.3. Company Market Share Analysis 2025
- 12.3.1 Top 5 Companies Market Share Analysis
- 12.3.2 Top 3 Companies Market Share Analysis
- 12.4. List of Potential Customers
- 13. Research Methodology
List of Figures
- Figure 1: Global Robotic Process Automation In Legal Services Market Revenue Breakdown (Million, %) by Region 2025 & 2033
- Figure 2: Global Robotic Process Automation In Legal Services Market Volume Breakdown (Billion, %) by Region 2025 & 2033
- Figure 3: North America Robotic Process Automation In Legal Services Market Revenue (Million), by Deployment Mode 2025 & 2033
- Figure 4: North America Robotic Process Automation In Legal Services Market Volume (Billion), by Deployment Mode 2025 & 2033
- Figure 5: North America Robotic Process Automation In Legal Services Market Revenue Share (%), by Deployment Mode 2025 & 2033
- Figure 6: North America Robotic Process Automation In Legal Services Market Volume Share (%), by Deployment Mode 2025 & 2033
- Figure 7: North America Robotic Process Automation In Legal Services Market Revenue (Million), by Solution 2025 & 2033
- Figure 8: North America Robotic Process Automation In Legal Services Market Volume (Billion), by Solution 2025 & 2033
- Figure 9: North America Robotic Process Automation In Legal Services Market Revenue Share (%), by Solution 2025 & 2033
- Figure 10: North America Robotic Process Automation In Legal Services Market Volume Share (%), by Solution 2025 & 2033
- Figure 11: North America Robotic Process Automation In Legal Services Market Revenue (Million), by Country 2025 & 2033
- Figure 12: North America Robotic Process Automation In Legal Services Market Volume (Billion), by Country 2025 & 2033
- Figure 13: North America Robotic Process Automation In Legal Services Market Revenue Share (%), by Country 2025 & 2033
- Figure 14: North America Robotic Process Automation In Legal Services Market Volume Share (%), by Country 2025 & 2033
- Figure 15: Europe Robotic Process Automation In Legal Services Market Revenue (Million), by Deployment Mode 2025 & 2033
- Figure 16: Europe Robotic Process Automation In Legal Services Market Volume (Billion), by Deployment Mode 2025 & 2033
- Figure 17: Europe Robotic Process Automation In Legal Services Market Revenue Share (%), by Deployment Mode 2025 & 2033
- Figure 18: Europe Robotic Process Automation In Legal Services Market Volume Share (%), by Deployment Mode 2025 & 2033
- Figure 19: Europe Robotic Process Automation In Legal Services Market Revenue (Million), by Solution 2025 & 2033
- Figure 20: Europe Robotic Process Automation In Legal Services Market Volume (Billion), by Solution 2025 & 2033
- Figure 21: Europe Robotic Process Automation In Legal Services Market Revenue Share (%), by Solution 2025 & 2033
- Figure 22: Europe Robotic Process Automation In Legal Services Market Volume Share (%), by Solution 2025 & 2033
- Figure 23: Europe Robotic Process Automation In Legal Services Market Revenue (Million), by Country 2025 & 2033
- Figure 24: Europe Robotic Process Automation In Legal Services Market Volume (Billion), by Country 2025 & 2033
- Figure 25: Europe Robotic Process Automation In Legal Services Market Revenue Share (%), by Country 2025 & 2033
- Figure 26: Europe Robotic Process Automation In Legal Services Market Volume Share (%), by Country 2025 & 2033
- Figure 27: Asia Pacific Robotic Process Automation In Legal Services Market Revenue (Million), by Deployment Mode 2025 & 2033
- Figure 28: Asia Pacific Robotic Process Automation In Legal Services Market Volume (Billion), by Deployment Mode 2025 & 2033
- Figure 29: Asia Pacific Robotic Process Automation In Legal Services Market Revenue Share (%), by Deployment Mode 2025 & 2033
- Figure 30: Asia Pacific Robotic Process Automation In Legal Services Market Volume Share (%), by Deployment Mode 2025 & 2033
- Figure 31: Asia Pacific Robotic Process Automation In Legal Services Market Revenue (Million), by Solution 2025 & 2033
- Figure 32: Asia Pacific Robotic Process Automation In Legal Services Market Volume (Billion), by Solution 2025 & 2033
- Figure 33: Asia Pacific Robotic Process Automation In Legal Services Market Revenue Share (%), by Solution 2025 & 2033
- Figure 34: Asia Pacific Robotic Process Automation In Legal Services Market Volume Share (%), by Solution 2025 & 2033
- Figure 35: Asia Pacific Robotic Process Automation In Legal Services Market Revenue (Million), by Country 2025 & 2033
- Figure 36: Asia Pacific Robotic Process Automation In Legal Services Market Volume (Billion), by Country 2025 & 2033
- Figure 37: Asia Pacific Robotic Process Automation In Legal Services Market Revenue Share (%), by Country 2025 & 2033
- Figure 38: Asia Pacific Robotic Process Automation In Legal Services Market Volume Share (%), by Country 2025 & 2033
- Figure 39: South America Robotic Process Automation In Legal Services Market Revenue (Million), by Deployment Mode 2025 & 2033
- Figure 40: South America Robotic Process Automation In Legal Services Market Volume (Billion), by Deployment Mode 2025 & 2033
- Figure 41: South America Robotic Process Automation In Legal Services Market Revenue Share (%), by Deployment Mode 2025 & 2033
- Figure 42: South America Robotic Process Automation In Legal Services Market Volume Share (%), by Deployment Mode 2025 & 2033
- Figure 43: South America Robotic Process Automation In Legal Services Market Revenue (Million), by Solution 2025 & 2033
- Figure 44: South America Robotic Process Automation In Legal Services Market Volume (Billion), by Solution 2025 & 2033
- Figure 45: South America Robotic Process Automation In Legal Services Market Revenue Share (%), by Solution 2025 & 2033
- Figure 46: South America Robotic Process Automation In Legal Services Market Volume Share (%), by Solution 2025 & 2033
- Figure 47: South America Robotic Process Automation In Legal Services Market Revenue (Million), by Country 2025 & 2033
- Figure 48: South America Robotic Process Automation In Legal Services Market Volume (Billion), by Country 2025 & 2033
- Figure 49: South America Robotic Process Automation In Legal Services Market Revenue Share (%), by Country 2025 & 2033
- Figure 50: South America Robotic Process Automation In Legal Services Market Volume Share (%), by Country 2025 & 2033
- Figure 51: Middle East and Africa Robotic Process Automation In Legal Services Market Revenue (Million), by Deployment Mode 2025 & 2033
- Figure 52: Middle East and Africa Robotic Process Automation In Legal Services Market Volume (Billion), by Deployment Mode 2025 & 2033
- Figure 53: Middle East and Africa Robotic Process Automation In Legal Services Market Revenue Share (%), by Deployment Mode 2025 & 2033
- Figure 54: Middle East and Africa Robotic Process Automation In Legal Services Market Volume Share (%), by Deployment Mode 2025 & 2033
- Figure 55: Middle East and Africa Robotic Process Automation In Legal Services Market Revenue (Million), by Solution 2025 & 2033
- Figure 56: Middle East and Africa Robotic Process Automation In Legal Services Market Volume (Billion), by Solution 2025 & 2033
- Figure 57: Middle East and Africa Robotic Process Automation In Legal Services Market Revenue Share (%), by Solution 2025 & 2033
- Figure 58: Middle East and Africa Robotic Process Automation In Legal Services Market Volume Share (%), by Solution 2025 & 2033
- Figure 59: Middle East and Africa Robotic Process Automation In Legal Services Market Revenue (Million), by Country 2025 & 2033
- Figure 60: Middle East and Africa Robotic Process Automation In Legal Services Market Volume (Billion), by Country 2025 & 2033
- Figure 61: Middle East and Africa Robotic Process Automation In Legal Services Market Revenue Share (%), by Country 2025 & 2033
- Figure 62: Middle East and Africa Robotic Process Automation In Legal Services Market Volume Share (%), by Country 2025 & 2033
List of Tables
- Table 1: Global Robotic Process Automation In Legal Services Market Revenue Million Forecast, by Deployment Mode 2020 & 2033
- Table 2: Global Robotic Process Automation In Legal Services Market Volume Billion Forecast, by Deployment Mode 2020 & 2033
- Table 3: Global Robotic Process Automation In Legal Services Market Revenue Million Forecast, by Solution 2020 & 2033
- Table 4: Global Robotic Process Automation In Legal Services Market Volume Billion Forecast, by Solution 2020 & 2033
- Table 5: Global Robotic Process Automation In Legal Services Market Revenue Million Forecast, by Region 2020 & 2033
- Table 6: Global Robotic Process Automation In Legal Services Market Volume Billion Forecast, by Region 2020 & 2033
- Table 7: Global Robotic Process Automation In Legal Services Market Revenue Million Forecast, by Deployment Mode 2020 & 2033
- Table 8: Global Robotic Process Automation In Legal Services Market Volume Billion Forecast, by Deployment Mode 2020 & 2033
- Table 9: Global Robotic Process Automation In Legal Services Market Revenue Million Forecast, by Solution 2020 & 2033
- Table 10: Global Robotic Process Automation In Legal Services Market Volume Billion Forecast, by Solution 2020 & 2033
- Table 11: Global Robotic Process Automation In Legal Services Market Revenue Million Forecast, by Country 2020 & 2033
- Table 12: Global Robotic Process Automation In Legal Services Market Volume Billion Forecast, by Country 2020 & 2033
- Table 13: United States Robotic Process Automation In Legal Services Market Revenue (Million) Forecast, by Application 2020 & 2033
- Table 14: United States Robotic Process Automation In Legal Services Market Volume (Billion) Forecast, by Application 2020 & 2033
- Table 15: Canada Robotic Process Automation In Legal Services Market Revenue (Million) Forecast, by Application 2020 & 2033
- Table 16: Canada Robotic Process Automation In Legal Services Market Volume (Billion) Forecast, by Application 2020 & 2033
- Table 17: Rest of North America Robotic Process Automation In Legal Services Market Revenue (Million) Forecast, by Application 2020 & 2033
- Table 18: Rest of North America Robotic Process Automation In Legal Services Market Volume (Billion) Forecast, by Application 2020 & 2033
- Table 19: Global Robotic Process Automation In Legal Services Market Revenue Million Forecast, by Deployment Mode 2020 & 2033
- Table 20: Global Robotic Process Automation In Legal Services Market Volume Billion Forecast, by Deployment Mode 2020 & 2033
- Table 21: Global Robotic Process Automation In Legal Services Market Revenue Million Forecast, by Solution 2020 & 2033
- Table 22: Global Robotic Process Automation In Legal Services Market Volume Billion Forecast, by Solution 2020 & 2033
- Table 23: Global Robotic Process Automation In Legal Services Market Revenue Million Forecast, by Country 2020 & 2033
- Table 24: Global Robotic Process Automation In Legal Services Market Volume Billion Forecast, by Country 2020 & 2033
- Table 25: Germany Robotic Process Automation In Legal Services Market Revenue (Million) Forecast, by Application 2020 & 2033
- Table 26: Germany Robotic Process Automation In Legal Services Market Volume (Billion) Forecast, by Application 2020 & 2033
- Table 27: United Kingdom Robotic Process Automation In Legal Services Market Revenue (Million) Forecast, by Application 2020 & 2033
- Table 28: United Kingdom Robotic Process Automation In Legal Services Market Volume (Billion) Forecast, by Application 2020 & 2033
- Table 29: France Robotic Process Automation In Legal Services Market Revenue (Million) Forecast, by Application 2020 & 2033
- Table 30: France Robotic Process Automation In Legal Services Market Volume (Billion) Forecast, by Application 2020 & 2033
- Table 31: Russia Robotic Process Automation In Legal Services Market Revenue (Million) Forecast, by Application 2020 & 2033
- Table 32: Russia Robotic Process Automation In Legal Services Market Volume (Billion) Forecast, by Application 2020 & 2033
- Table 33: Spain Robotic Process Automation In Legal Services Market Revenue (Million) Forecast, by Application 2020 & 2033
- Table 34: Spain Robotic Process Automation In Legal Services Market Volume (Billion) Forecast, by Application 2020 & 2033
- Table 35: Rest of Europe Robotic Process Automation In Legal Services Market Revenue (Million) Forecast, by Application 2020 & 2033
- Table 36: Rest of Europe Robotic Process Automation In Legal Services Market Volume (Billion) Forecast, by Application 2020 & 2033
- Table 37: Global Robotic Process Automation In Legal Services Market Revenue Million Forecast, by Deployment Mode 2020 & 2033
- Table 38: Global Robotic Process Automation In Legal Services Market Volume Billion Forecast, by Deployment Mode 2020 & 2033
- Table 39: Global Robotic Process Automation In Legal Services Market Revenue Million Forecast, by Solution 2020 & 2033
- Table 40: Global Robotic Process Automation In Legal Services Market Volume Billion Forecast, by Solution 2020 & 2033
- Table 41: Global Robotic Process Automation In Legal Services Market Revenue Million Forecast, by Country 2020 & 2033
- Table 42: Global Robotic Process Automation In Legal Services Market Volume Billion Forecast, by Country 2020 & 2033
- Table 43: India Robotic Process Automation In Legal Services Market Revenue (Million) Forecast, by Application 2020 & 2033
- Table 44: India Robotic Process Automation In Legal Services Market Volume (Billion) Forecast, by Application 2020 & 2033
- Table 45: China Robotic Process Automation In Legal Services Market Revenue (Million) Forecast, by Application 2020 & 2033
- Table 46: China Robotic Process Automation In Legal Services Market Volume (Billion) Forecast, by Application 2020 & 2033
- Table 47: Japan Robotic Process Automation In Legal Services Market Revenue (Million) Forecast, by Application 2020 & 2033
- Table 48: Japan Robotic Process Automation In Legal Services Market Volume (Billion) Forecast, by Application 2020 & 2033
- Table 49: Rest of Asia Pacific Robotic Process Automation In Legal Services Market Revenue (Million) Forecast, by Application 2020 & 2033
- Table 50: Rest of Asia Pacific Robotic Process Automation In Legal Services Market Volume (Billion) Forecast, by Application 2020 & 2033
- Table 51: Global Robotic Process Automation In Legal Services Market Revenue Million Forecast, by Deployment Mode 2020 & 2033
- Table 52: Global Robotic Process Automation In Legal Services Market Volume Billion Forecast, by Deployment Mode 2020 & 2033
- Table 53: Global Robotic Process Automation In Legal Services Market Revenue Million Forecast, by Solution 2020 & 2033
- Table 54: Global Robotic Process Automation In Legal Services Market Volume Billion Forecast, by Solution 2020 & 2033
- Table 55: Global Robotic Process Automation In Legal Services Market Revenue Million Forecast, by Country 2020 & 2033
- Table 56: Global Robotic Process Automation In Legal Services Market Volume Billion Forecast, by Country 2020 & 2033
- Table 57: Brazil Robotic Process Automation In Legal Services Market Revenue (Million) Forecast, by Application 2020 & 2033
- Table 58: Brazil Robotic Process Automation In Legal Services Market Volume (Billion) Forecast, by Application 2020 & 2033
- Table 59: Argentina Robotic Process Automation In Legal Services Market Revenue (Million) Forecast, by Application 2020 & 2033
- Table 60: Argentina Robotic Process Automation In Legal Services Market Volume (Billion) Forecast, by Application 2020 & 2033
- Table 61: Rest of South America Robotic Process Automation In Legal Services Market Revenue (Million) Forecast, by Application 2020 & 2033
- Table 62: Rest of South America Robotic Process Automation In Legal Services Market Volume (Billion) Forecast, by Application 2020 & 2033
- Table 63: Global Robotic Process Automation In Legal Services Market Revenue Million Forecast, by Deployment Mode 2020 & 2033
- Table 64: Global Robotic Process Automation In Legal Services Market Volume Billion Forecast, by Deployment Mode 2020 & 2033
- Table 65: Global Robotic Process Automation In Legal Services Market Revenue Million Forecast, by Solution 2020 & 2033
- Table 66: Global Robotic Process Automation In Legal Services Market Volume Billion Forecast, by Solution 2020 & 2033
- Table 67: Global Robotic Process Automation In Legal Services Market Revenue Million Forecast, by Country 2020 & 2033
- Table 68: Global Robotic Process Automation In Legal Services Market Volume Billion Forecast, by Country 2020 & 2033
- Table 69: United Arab Emirates Robotic Process Automation In Legal Services Market Revenue (Million) Forecast, by Application 2020 & 2033
- Table 70: United Arab Emirates Robotic Process Automation In Legal Services Market Volume (Billion) Forecast, by Application 2020 & 2033
- Table 71: Saudi Arabia Robotic Process Automation In Legal Services Market Revenue (Million) Forecast, by Application 2020 & 2033
- Table 72: Saudi Arabia Robotic Process Automation In Legal Services Market Volume (Billion) Forecast, by Application 2020 & 2033
- Table 73: Rest of Middle East and Africa Robotic Process Automation In Legal Services Market Revenue (Million) Forecast, by Application 2020 & 2033
- Table 74: Rest of Middle East and Africa Robotic Process Automation In Legal Services Market Volume (Billion) Forecast, by Application 2020 & 2033
Frequently Asked Questions
1. What is the projected Compound Annual Growth Rate (CAGR) of the Robotic Process Automation In Legal Services Market?
The projected CAGR is approximately 14.65%.
2. Which companies are prominent players in the Robotic Process Automation In Legal Services Market?
Key companies in the market include UiPath, Blue Prism, Automation Anywhere, Kofax, Pegasystems, NICE, IBM, WorkFusion, EdgeVerve, Kira Systems**List Not Exhaustive.
3. What are the main segments of the Robotic Process Automation In Legal Services Market?
The market segments include Deployment Mode , Solution.
4. Can you provide details about the market size?
The market size is estimated to be USD 1.63 Million as of 2022.
5. What are some drivers contributing to market growth?
Digital Transformation Initiatives is Driving the Market.
6. What are the notable trends driving market growth?
Rise in Software Technology.
7. Are there any restraints impacting market growth?
Digital Transformation Initiatives is Driving the Market.
8. Can you provide examples of recent developments in the market?
July 2024: One Equity Partners (OEP) strategically invested in Comau, an Italian industrial automation and advanced robotics leader. This move positions OEP as Comau's majority shareholder while Stellantis retains its role as an active minority shareholder.June 2023: Expert.ai, the industry leader in providing AI-powered language solutions to enterprises, partnered with SS&C Blue Prism’s intelligent automation platform.
9. What pricing options are available for accessing the report?
Pricing options include single-user, multi-user, and enterprise licenses priced at USD 4750, USD 5250, and USD 8750 respectively.
10. Is the market size provided in terms of value or volume?
The market size is provided in terms of value, measured in Million and volume, measured in Billion.
11. Are there any specific market keywords associated with the report?
Yes, the market keyword associated with the report is "Robotic Process Automation In Legal Services Market," which aids in identifying and referencing the specific market segment covered.
12. How do I determine which pricing option suits my needs best?
The pricing options vary based on user requirements and access needs. Individual users may opt for single-user licenses, while businesses requiring broader access may choose multi-user or enterprise licenses for cost-effective access to the report.
13. Are there any additional resources or data provided in the Robotic Process Automation In Legal Services Market report?
While the report offers comprehensive insights, it's advisable to review the specific contents or supplementary materials provided to ascertain if additional resources or data are available.
14. How can I stay updated on further developments or reports in the Robotic Process Automation In Legal Services Market?
To stay informed about further developments, trends, and reports in the Robotic Process Automation In Legal Services Market, consider subscribing to industry newsletters, following relevant companies and organizations, or regularly checking reputable industry news sources and publications.
Methodology
Step 1 - Identification of Relevant Samples Size from Population Database


Step 2 - Approaches for Defining Global Market Size (Value, Volume* & Price*)

Note*: In applicable scenarios
Step 3 - Data Sources
Primary Research
- Web Analytics
- Survey Reports
- Research Institute
- Latest Research Reports
- Opinion Leaders
Secondary Research
- Annual Reports
- White Paper
- Latest Press Release
- Industry Association
- Paid Database
- Investor Presentations

Step 4 - Data Triangulation
Involves using different sources of information in order to increase the validity of a study
These sources are likely to be stakeholders in a program - participants, other researchers, program staff, other community members, and so on.
Then we put all data in single framework & apply various statistical tools to find out the dynamic on the market.
During the analysis stage, feedback from the stakeholder groups would be compared to determine areas of agreement as well as areas of divergence