

Key Insights
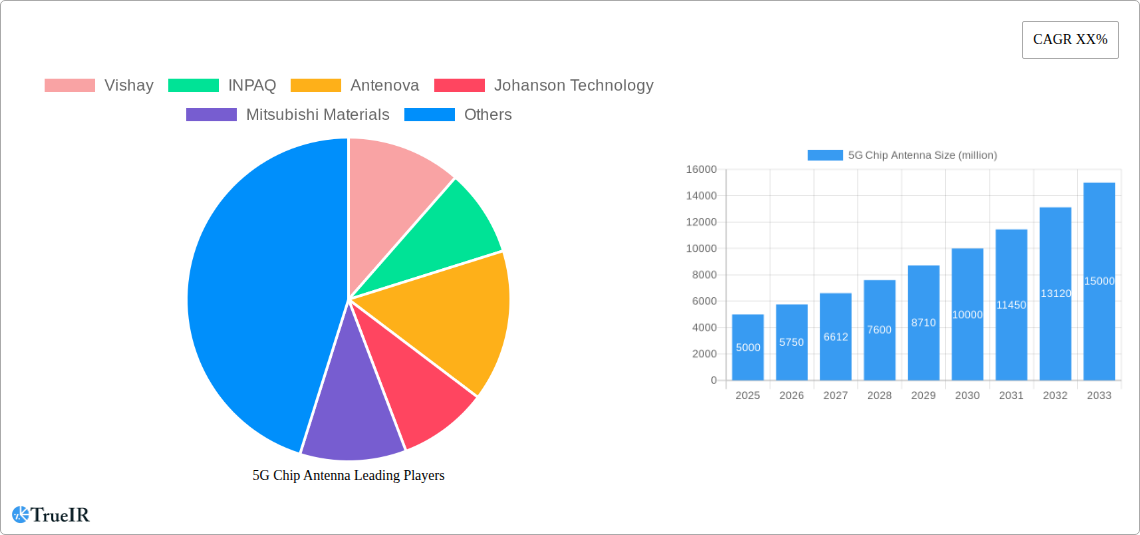
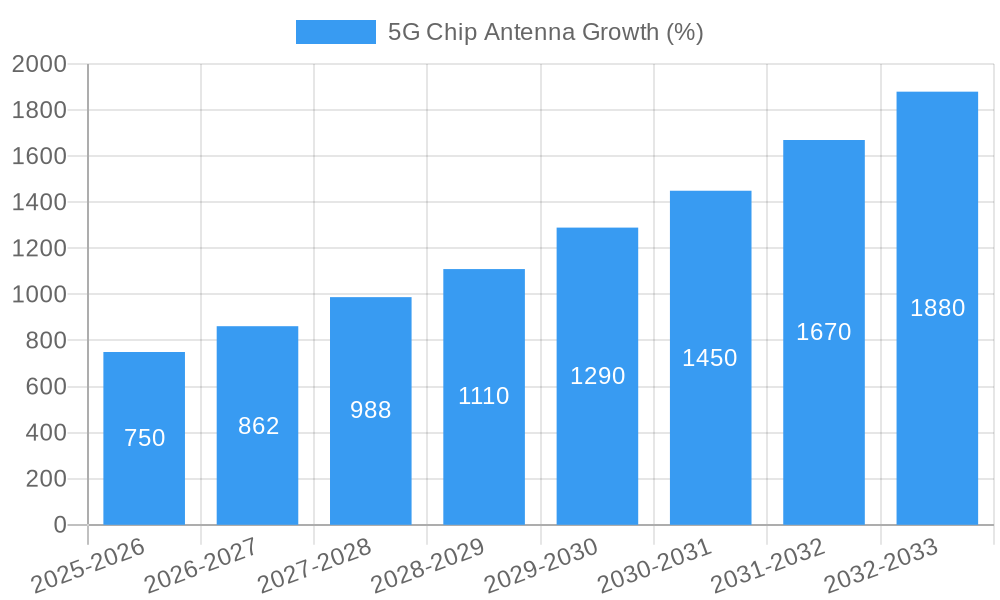
The 5G chip antenna market is experiencing robust growth, driven by the rapid expansion of 5G network infrastructure globally and the increasing demand for high-speed data connectivity across various devices. The market, estimated at $5 billion in 2025, is projected to witness a Compound Annual Growth Rate (CAGR) of 15% from 2025 to 2033, reaching approximately $15 billion by 2033. This growth is fueled by several key factors including the proliferation of 5G-enabled smartphones, the deployment of private 5G networks in industries like manufacturing and healthcare, and the ongoing development of advanced antenna technologies like mmWave and massive MIMO. Key players like Vishay, Antenova, and TDK are strategically investing in research and development to enhance antenna performance, miniaturization, and integration with other components, contributing significantly to market expansion.
Market segmentation reveals strong growth across various sectors. The automotive sector, driven by the increasing adoption of connected car technologies and autonomous driving features, presents a significant opportunity. Furthermore, the Internet of Things (IoT) sector, with its diverse applications in smart homes, wearables, and industrial automation, is a key driver of demand for compact and efficient 5G chip antennas. However, challenges remain, including the high cost of mmWave technology and the complexities associated with integrating antennas into increasingly smaller devices. Overcoming these restraints through technological advancements and economies of scale will be crucial for sustained market growth. The competitive landscape is characterized by a mix of established players and emerging companies, fostering innovation and competition, ultimately benefiting consumers through improved performance and affordability.
Unlocking Billions: A Comprehensive Analysis of the 5G Chip Antenna Market (2019-2033)
This in-depth report provides a comprehensive analysis of the 5G Chip Antenna market, projecting a market size exceeding $XX billion by 2033. The study covers the period from 2019 to 2033, with 2025 serving as both the base and estimated year. The forecast period spans from 2025 to 2033, while the historical period encompasses 2019-2024. Key players like Vishay, INPAQ, Antenova, Johanson Technology, and others are analyzed in detail, offering invaluable insights for investors, manufacturers, and industry stakeholders.
5G Chip Antenna Market Structure & Competitive Landscape
The 5G Chip Antenna market exhibits a moderately concentrated structure, with the top five players holding an estimated xx% market share in 2025. This concentration is driven by significant investments in R&D, resulting in technological innovation and the emergence of differentiated products. Regulatory impacts, including spectrum allocation and standardization efforts, significantly shape market dynamics. Product substitutes, such as traditional antenna technologies, face increasing pressure due to 5G's superior performance. End-user segmentation is primarily driven by the mobile device, infrastructure, and automotive sectors. The market has witnessed a moderate number of M&A activities in recent years, with an estimated xx number of transactions exceeding $xx million between 2019 and 2024. These activities primarily focus on expanding product portfolios, acquiring specialized technologies, and enhancing global reach.
- Market Concentration: Top 5 players hold xx% market share (2025).
- Innovation Drivers: High R&D investment, miniaturization, and performance improvements.
- Regulatory Impacts: Spectrum allocation policies significantly influence market growth.
- Product Substitutes: Traditional antenna technologies face declining market share.
- End-User Segmentation: Dominated by mobile devices, infrastructure, and automotive sectors.
- M&A Trends: xx transactions exceeding $xx million (2019-2024), primarily focused on expansion and technology acquisition.
5G Chip Antenna Market Trends & Opportunities
The global 5G chip antenna market is experiencing robust growth, driven by the widespread adoption of 5G technology and the increasing demand for high-speed data connectivity. The market is projected to achieve a CAGR of xx% during the forecast period (2025-2033), reaching a market size exceeding $XX billion by 2033. This expansion is fueled by several key trends, including the rapid proliferation of 5G-enabled smartphones, the deployment of 5G infrastructure in various regions, and the rising demand for high-bandwidth applications like video streaming and augmented reality. Technological advancements, such as the development of advanced antenna designs and materials, are further propelling market growth. The market penetration rate of 5G chip antennas is expected to increase significantly in the coming years, driven by rising consumer demand for enhanced connectivity experiences and the increasing affordability of 5G devices. Competitive dynamics are intense, with numerous established and emerging players vying for market share through product innovation, strategic partnerships, and aggressive pricing strategies. These factors collectively present significant opportunities for growth and innovation in the 5G chip antenna market.
Dominant Markets & Segments in 5G Chip Antenna
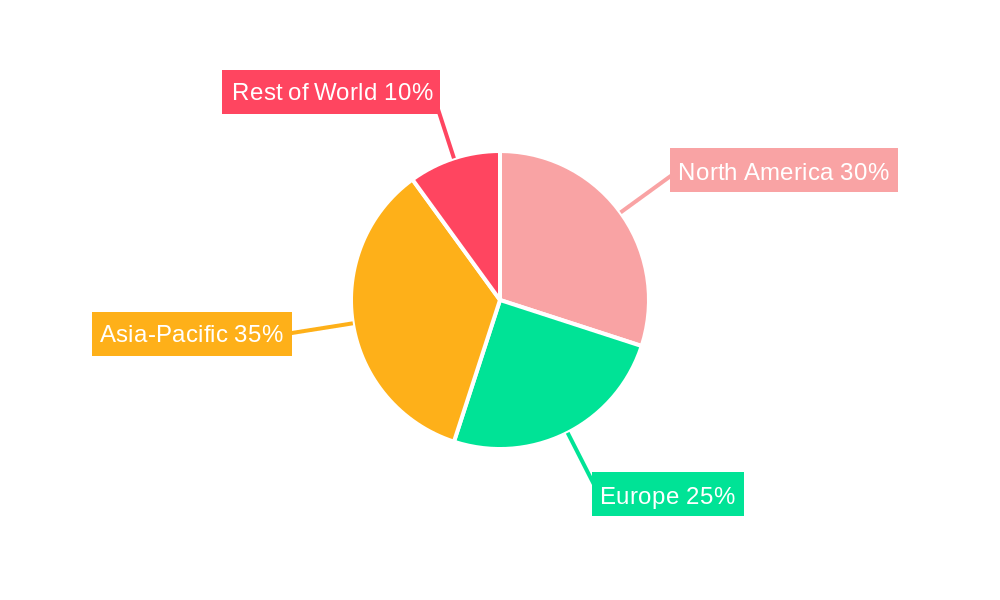
The North American and Asian regions are currently leading the 5G chip antenna market, driven by robust 5G infrastructure development and high consumer demand. Within these regions, specific countries like the United States, China, and South Korea are showing particularly strong growth.
- Key Growth Drivers in North America: Extensive 5G network deployment, high smartphone penetration, and strong consumer demand for advanced mobile technologies.
- Key Growth Drivers in Asia: Rapid 5G infrastructure development, large consumer base, and government initiatives promoting technological advancements.
- Market Dominance: North America and Asia represent the largest market share, with significant growth potential in other regions as 5G adoption expands.
5G Chip Antenna Product Analysis
Technological advancements in 5G chip antenna design focus on miniaturization, increased efficiency, and improved performance in diverse environments. The integration of advanced materials, such as high-frequency dielectrics and novel conductive substrates, is enhancing antenna characteristics, enabling better signal reception and transmission. The adaptability of these antennas to various applications, ranging from smartphones and wearables to base stations and autonomous vehicles, contributes to their widespread adoption. Competitive advantages arise from superior signal quality, reduced size and weight, and optimized power consumption.
Key Drivers, Barriers & Challenges in 5G Chip Antenna
Key Drivers:
The market is propelled by the rapid expansion of 5G networks globally, the burgeoning demand for high-speed data and seamless connectivity, and continuous technological advancements leading to smaller, more efficient antenna designs. Government initiatives promoting 5G infrastructure development further fuel this growth.
Challenges & Restraints:
Supply chain disruptions and escalating material costs present significant challenges, impacting production and potentially increasing prices. Complex regulatory frameworks and stringent standardization requirements can hinder market entry for new players. Intense competition among established players also limits profit margins. The estimated impact of these restraints on market growth is xx% by 2033.
Growth Drivers in the 5G Chip Antenna Market
Technological advancements, such as the development of advanced antenna designs and materials (e.g., metamaterials), are driving market growth. The increasing demand for high-speed data connectivity across various applications, coupled with expanding 5G network infrastructure globally, fuels market expansion. Supportive government policies and investments in 5G technology further accelerate this trend.
Challenges Impacting 5G Chip Antenna Growth
Supply chain disruptions and material cost fluctuations pose major challenges. Stringent regulatory requirements and standardization processes can restrict market entry and innovation. Intense competition from established players may limit profit margins for new entrants.
Key Players Shaping the 5G Chip Antenna Market
- Vishay
- INPAQ
- Antenova
- Johanson Technology
- Mitsubishi Materials
- Abracon
- TAIYO YUDEN
- Linx Technologies
- Würth Elektronik
- Taoglas
- Partron
- Yageo
- Rainsun
- Fractus
- Cirocomm
- Microgate
- TDK
- Sunlord
Significant 5G Chip Antenna Industry Milestones
- 2020-Q4: Antenova launches its miniaturized 5G antenna for smartphones.
- 2021-Q2: Vishay introduces a new series of high-performance chip antennas.
- 2022-Q3: Johanson Technology acquires a smaller antenna manufacturer, expanding its product portfolio.
- 2023-Q1: Significant investment in 5G infrastructure development announced by multiple governments.
Future Outlook for 5G Chip Antenna Market
The 5G chip antenna market is poised for continued expansion, driven by the ongoing rollout of 5G networks worldwide and the growing demand for high-bandwidth applications. Strategic opportunities exist for companies to leverage technological advancements, such as the development of innovative antenna designs and materials, to improve antenna performance and reduce costs. The market's potential for significant growth in various sectors, including consumer electronics, automotive, and industrial IoT, presents significant opportunities for innovation and investment.
5G Chip Antenna Segmentation
-
1. Application
- 1.1. Bluetooth Applications
- 1.2. WiFi Applications
- 1.3. GPS/Glonass Applications
- 1.4. IMT Applications
-
2. Types
- 2.1. Dielectric Chip Antenna
- 2.2. LTCC Chip Antenna
5G Chip Antenna Segmentation By Geography
-
1. North America
- 1.1. United States
- 1.2. Canada
- 1.3. Mexico
-
2. South America
- 2.1. Brazil
- 2.2. Argentina
- 2.3. Rest of South America
-
3. Europe
- 3.1. United Kingdom
- 3.2. Germany
- 3.3. France
- 3.4. Italy
- 3.5. Spain
- 3.6. Russia
- 3.7. Benelux
- 3.8. Nordics
- 3.9. Rest of Europe
-
4. Middle East & Africa
- 4.1. Turkey
- 4.2. Israel
- 4.3. GCC
- 4.4. North Africa
- 4.5. South Africa
- 4.6. Rest of Middle East & Africa
-
5. Asia Pacific
- 5.1. China
- 5.2. India
- 5.3. Japan
- 5.4. South Korea
- 5.5. ASEAN
- 5.6. Oceania
- 5.7. Rest of Asia Pacific
5G Chip Antenna REPORT HIGHLIGHTS
| Aspects | Details |
|---|---|
| Study Period | 2019-2033 |
| Base Year | 2024 |
| Estimated Year | 2025 |
| Forecast Period | 2025-2033 |
| Historical Period | 2019-2024 |
| Growth Rate | CAGR of XX% from 2019-2033 |
| Segmentation |
|
Table of Contents
- 1. Introduction
- 1.1. Research Scope
- 1.2. Market Segmentation
- 1.3. Research Methodology
- 1.4. Definitions and Assumptions
- 2. Executive Summary
- 2.1. Introduction
- 3. Market Dynamics
- 3.1. Introduction
- 3.2. Market Drivers
- 3.3. Market Restrains
- 3.4. Market Trends
- 4. Market Factor Analysis
- 4.1. Porters Five Forces
- 4.2. Supply/Value Chain
- 4.3. PESTEL analysis
- 4.4. Market Entropy
- 4.5. Patent/Trademark Analysis
- 5. Global 5G Chip Antenna Analysis, Insights and Forecast, 2019-2031
- 5.1. Market Analysis, Insights and Forecast - by Application
- 5.1.1. Bluetooth Applications
- 5.1.2. WiFi Applications
- 5.1.3. GPS/Glonass Applications
- 5.1.4. IMT Applications
- 5.2. Market Analysis, Insights and Forecast - by Types
- 5.2.1. Dielectric Chip Antenna
- 5.2.2. LTCC Chip Antenna
- 5.3. Market Analysis, Insights and Forecast - by Region
- 5.3.1. North America
- 5.3.2. South America
- 5.3.3. Europe
- 5.3.4. Middle East & Africa
- 5.3.5. Asia Pacific
- 5.1. Market Analysis, Insights and Forecast - by Application
- 6. North America 5G Chip Antenna Analysis, Insights and Forecast, 2019-2031
- 6.1. Market Analysis, Insights and Forecast - by Application
- 6.1.1. Bluetooth Applications
- 6.1.2. WiFi Applications
- 6.1.3. GPS/Glonass Applications
- 6.1.4. IMT Applications
- 6.2. Market Analysis, Insights and Forecast - by Types
- 6.2.1. Dielectric Chip Antenna
- 6.2.2. LTCC Chip Antenna
- 6.1. Market Analysis, Insights and Forecast - by Application
- 7. South America 5G Chip Antenna Analysis, Insights and Forecast, 2019-2031
- 7.1. Market Analysis, Insights and Forecast - by Application
- 7.1.1. Bluetooth Applications
- 7.1.2. WiFi Applications
- 7.1.3. GPS/Glonass Applications
- 7.1.4. IMT Applications
- 7.2. Market Analysis, Insights and Forecast - by Types
- 7.2.1. Dielectric Chip Antenna
- 7.2.2. LTCC Chip Antenna
- 7.1. Market Analysis, Insights and Forecast - by Application
- 8. Europe 5G Chip Antenna Analysis, Insights and Forecast, 2019-2031
- 8.1. Market Analysis, Insights and Forecast - by Application
- 8.1.1. Bluetooth Applications
- 8.1.2. WiFi Applications
- 8.1.3. GPS/Glonass Applications
- 8.1.4. IMT Applications
- 8.2. Market Analysis, Insights and Forecast - by Types
- 8.2.1. Dielectric Chip Antenna
- 8.2.2. LTCC Chip Antenna
- 8.1. Market Analysis, Insights and Forecast - by Application
- 9. Middle East & Africa 5G Chip Antenna Analysis, Insights and Forecast, 2019-2031
- 9.1. Market Analysis, Insights and Forecast - by Application
- 9.1.1. Bluetooth Applications
- 9.1.2. WiFi Applications
- 9.1.3. GPS/Glonass Applications
- 9.1.4. IMT Applications
- 9.2. Market Analysis, Insights and Forecast - by Types
- 9.2.1. Dielectric Chip Antenna
- 9.2.2. LTCC Chip Antenna
- 9.1. Market Analysis, Insights and Forecast - by Application
- 10. Asia Pacific 5G Chip Antenna Analysis, Insights and Forecast, 2019-2031
- 10.1. Market Analysis, Insights and Forecast - by Application
- 10.1.1. Bluetooth Applications
- 10.1.2. WiFi Applications
- 10.1.3. GPS/Glonass Applications
- 10.1.4. IMT Applications
- 10.2. Market Analysis, Insights and Forecast - by Types
- 10.2.1. Dielectric Chip Antenna
- 10.2.2. LTCC Chip Antenna
- 10.1. Market Analysis, Insights and Forecast - by Application
- 11. Competitive Analysis
- 11.1. Global Market Share Analysis 2024
- 11.2. Company Profiles
- 11.2.1 Vishay
- 11.2.1.1. Overview
- 11.2.1.2. Products
- 11.2.1.3. SWOT Analysis
- 11.2.1.4. Recent Developments
- 11.2.1.5. Financials (Based on Availability)
- 11.2.2 INPAQ
- 11.2.2.1. Overview
- 11.2.2.2. Products
- 11.2.2.3. SWOT Analysis
- 11.2.2.4. Recent Developments
- 11.2.2.5. Financials (Based on Availability)
- 11.2.3 Antenova
- 11.2.3.1. Overview
- 11.2.3.2. Products
- 11.2.3.3. SWOT Analysis
- 11.2.3.4. Recent Developments
- 11.2.3.5. Financials (Based on Availability)
- 11.2.4 Johanson Technology
- 11.2.4.1. Overview
- 11.2.4.2. Products
- 11.2.4.3. SWOT Analysis
- 11.2.4.4. Recent Developments
- 11.2.4.5. Financials (Based on Availability)
- 11.2.5 Mitsubishi Materials
- 11.2.5.1. Overview
- 11.2.5.2. Products
- 11.2.5.3. SWOT Analysis
- 11.2.5.4. Recent Developments
- 11.2.5.5. Financials (Based on Availability)
- 11.2.6 Abracon
- 11.2.6.1. Overview
- 11.2.6.2. Products
- 11.2.6.3. SWOT Analysis
- 11.2.6.4. Recent Developments
- 11.2.6.5. Financials (Based on Availability)
- 11.2.7 TAIYO YUDEN
- 11.2.7.1. Overview
- 11.2.7.2. Products
- 11.2.7.3. SWOT Analysis
- 11.2.7.4. Recent Developments
- 11.2.7.5. Financials (Based on Availability)
- 11.2.8 Linx Technologies
- 11.2.8.1. Overview
- 11.2.8.2. Products
- 11.2.8.3. SWOT Analysis
- 11.2.8.4. Recent Developments
- 11.2.8.5. Financials (Based on Availability)
- 11.2.9 Wrth Elektronik
- 11.2.9.1. Overview
- 11.2.9.2. Products
- 11.2.9.3. SWOT Analysis
- 11.2.9.4. Recent Developments
- 11.2.9.5. Financials (Based on Availability)
- 11.2.10 Taoglas
- 11.2.10.1. Overview
- 11.2.10.2. Products
- 11.2.10.3. SWOT Analysis
- 11.2.10.4. Recent Developments
- 11.2.10.5. Financials (Based on Availability)
- 11.2.11 Partron
- 11.2.11.1. Overview
- 11.2.11.2. Products
- 11.2.11.3. SWOT Analysis
- 11.2.11.4. Recent Developments
- 11.2.11.5. Financials (Based on Availability)
- 11.2.12 Yageo
- 11.2.12.1. Overview
- 11.2.12.2. Products
- 11.2.12.3. SWOT Analysis
- 11.2.12.4. Recent Developments
- 11.2.12.5. Financials (Based on Availability)
- 11.2.13 Rainsun
- 11.2.13.1. Overview
- 11.2.13.2. Products
- 11.2.13.3. SWOT Analysis
- 11.2.13.4. Recent Developments
- 11.2.13.5. Financials (Based on Availability)
- 11.2.14 Fractus
- 11.2.14.1. Overview
- 11.2.14.2. Products
- 11.2.14.3. SWOT Analysis
- 11.2.14.4. Recent Developments
- 11.2.14.5. Financials (Based on Availability)
- 11.2.15 Cirocomm
- 11.2.15.1. Overview
- 11.2.15.2. Products
- 11.2.15.3. SWOT Analysis
- 11.2.15.4. Recent Developments
- 11.2.15.5. Financials (Based on Availability)
- 11.2.16 Microgate
- 11.2.16.1. Overview
- 11.2.16.2. Products
- 11.2.16.3. SWOT Analysis
- 11.2.16.4. Recent Developments
- 11.2.16.5. Financials (Based on Availability)
- 11.2.17 TDK
- 11.2.17.1. Overview
- 11.2.17.2. Products
- 11.2.17.3. SWOT Analysis
- 11.2.17.4. Recent Developments
- 11.2.17.5. Financials (Based on Availability)
- 11.2.18 Sunlord
- 11.2.18.1. Overview
- 11.2.18.2. Products
- 11.2.18.3. SWOT Analysis
- 11.2.18.4. Recent Developments
- 11.2.18.5. Financials (Based on Availability)
- 11.2.1 Vishay
List of Figures
- Figure 1: Global 5G Chip Antenna Revenue Breakdown (million, %) by Region 2024 & 2032
- Figure 2: Global 5G Chip Antenna Volume Breakdown (K, %) by Region 2024 & 2032
- Figure 3: North America 5G Chip Antenna Revenue (million), by Application 2024 & 2032
- Figure 4: North America 5G Chip Antenna Volume (K), by Application 2024 & 2032
- Figure 5: North America 5G Chip Antenna Revenue Share (%), by Application 2024 & 2032
- Figure 6: North America 5G Chip Antenna Volume Share (%), by Application 2024 & 2032
- Figure 7: North America 5G Chip Antenna Revenue (million), by Types 2024 & 2032
- Figure 8: North America 5G Chip Antenna Volume (K), by Types 2024 & 2032
- Figure 9: North America 5G Chip Antenna Revenue Share (%), by Types 2024 & 2032
- Figure 10: North America 5G Chip Antenna Volume Share (%), by Types 2024 & 2032
- Figure 11: North America 5G Chip Antenna Revenue (million), by Country 2024 & 2032
- Figure 12: North America 5G Chip Antenna Volume (K), by Country 2024 & 2032
- Figure 13: North America 5G Chip Antenna Revenue Share (%), by Country 2024 & 2032
- Figure 14: North America 5G Chip Antenna Volume Share (%), by Country 2024 & 2032
- Figure 15: South America 5G Chip Antenna Revenue (million), by Application 2024 & 2032
- Figure 16: South America 5G Chip Antenna Volume (K), by Application 2024 & 2032
- Figure 17: South America 5G Chip Antenna Revenue Share (%), by Application 2024 & 2032
- Figure 18: South America 5G Chip Antenna Volume Share (%), by Application 2024 & 2032
- Figure 19: South America 5G Chip Antenna Revenue (million), by Types 2024 & 2032
- Figure 20: South America 5G Chip Antenna Volume (K), by Types 2024 & 2032
- Figure 21: South America 5G Chip Antenna Revenue Share (%), by Types 2024 & 2032
- Figure 22: South America 5G Chip Antenna Volume Share (%), by Types 2024 & 2032
- Figure 23: South America 5G Chip Antenna Revenue (million), by Country 2024 & 2032
- Figure 24: South America 5G Chip Antenna Volume (K), by Country 2024 & 2032
- Figure 25: South America 5G Chip Antenna Revenue Share (%), by Country 2024 & 2032
- Figure 26: South America 5G Chip Antenna Volume Share (%), by Country 2024 & 2032
- Figure 27: Europe 5G Chip Antenna Revenue (million), by Application 2024 & 2032
- Figure 28: Europe 5G Chip Antenna Volume (K), by Application 2024 & 2032
- Figure 29: Europe 5G Chip Antenna Revenue Share (%), by Application 2024 & 2032
- Figure 30: Europe 5G Chip Antenna Volume Share (%), by Application 2024 & 2032
- Figure 31: Europe 5G Chip Antenna Revenue (million), by Types 2024 & 2032
- Figure 32: Europe 5G Chip Antenna Volume (K), by Types 2024 & 2032
- Figure 33: Europe 5G Chip Antenna Revenue Share (%), by Types 2024 & 2032
- Figure 34: Europe 5G Chip Antenna Volume Share (%), by Types 2024 & 2032
- Figure 35: Europe 5G Chip Antenna Revenue (million), by Country 2024 & 2032
- Figure 36: Europe 5G Chip Antenna Volume (K), by Country 2024 & 2032
- Figure 37: Europe 5G Chip Antenna Revenue Share (%), by Country 2024 & 2032
- Figure 38: Europe 5G Chip Antenna Volume Share (%), by Country 2024 & 2032
- Figure 39: Middle East & Africa 5G Chip Antenna Revenue (million), by Application 2024 & 2032
- Figure 40: Middle East & Africa 5G Chip Antenna Volume (K), by Application 2024 & 2032
- Figure 41: Middle East & Africa 5G Chip Antenna Revenue Share (%), by Application 2024 & 2032
- Figure 42: Middle East & Africa 5G Chip Antenna Volume Share (%), by Application 2024 & 2032
- Figure 43: Middle East & Africa 5G Chip Antenna Revenue (million), by Types 2024 & 2032
- Figure 44: Middle East & Africa 5G Chip Antenna Volume (K), by Types 2024 & 2032
- Figure 45: Middle East & Africa 5G Chip Antenna Revenue Share (%), by Types 2024 & 2032
- Figure 46: Middle East & Africa 5G Chip Antenna Volume Share (%), by Types 2024 & 2032
- Figure 47: Middle East & Africa 5G Chip Antenna Revenue (million), by Country 2024 & 2032
- Figure 48: Middle East & Africa 5G Chip Antenna Volume (K), by Country 2024 & 2032
- Figure 49: Middle East & Africa 5G Chip Antenna Revenue Share (%), by Country 2024 & 2032
- Figure 50: Middle East & Africa 5G Chip Antenna Volume Share (%), by Country 2024 & 2032
- Figure 51: Asia Pacific 5G Chip Antenna Revenue (million), by Application 2024 & 2032
- Figure 52: Asia Pacific 5G Chip Antenna Volume (K), by Application 2024 & 2032
- Figure 53: Asia Pacific 5G Chip Antenna Revenue Share (%), by Application 2024 & 2032
- Figure 54: Asia Pacific 5G Chip Antenna Volume Share (%), by Application 2024 & 2032
- Figure 55: Asia Pacific 5G Chip Antenna Revenue (million), by Types 2024 & 2032
- Figure 56: Asia Pacific 5G Chip Antenna Volume (K), by Types 2024 & 2032
- Figure 57: Asia Pacific 5G Chip Antenna Revenue Share (%), by Types 2024 & 2032
- Figure 58: Asia Pacific 5G Chip Antenna Volume Share (%), by Types 2024 & 2032
- Figure 59: Asia Pacific 5G Chip Antenna Revenue (million), by Country 2024 & 2032
- Figure 60: Asia Pacific 5G Chip Antenna Volume (K), by Country 2024 & 2032
- Figure 61: Asia Pacific 5G Chip Antenna Revenue Share (%), by Country 2024 & 2032
- Figure 62: Asia Pacific 5G Chip Antenna Volume Share (%), by Country 2024 & 2032
List of Tables
- Table 1: Global 5G Chip Antenna Revenue million Forecast, by Region 2019 & 2032
- Table 2: Global 5G Chip Antenna Volume K Forecast, by Region 2019 & 2032
- Table 3: Global 5G Chip Antenna Revenue million Forecast, by Application 2019 & 2032
- Table 4: Global 5G Chip Antenna Volume K Forecast, by Application 2019 & 2032
- Table 5: Global 5G Chip Antenna Revenue million Forecast, by Types 2019 & 2032
- Table 6: Global 5G Chip Antenna Volume K Forecast, by Types 2019 & 2032
- Table 7: Global 5G Chip Antenna Revenue million Forecast, by Region 2019 & 2032
- Table 8: Global 5G Chip Antenna Volume K Forecast, by Region 2019 & 2032
- Table 9: Global 5G Chip Antenna Revenue million Forecast, by Application 2019 & 2032
- Table 10: Global 5G Chip Antenna Volume K Forecast, by Application 2019 & 2032
- Table 11: Global 5G Chip Antenna Revenue million Forecast, by Types 2019 & 2032
- Table 12: Global 5G Chip Antenna Volume K Forecast, by Types 2019 & 2032
- Table 13: Global 5G Chip Antenna Revenue million Forecast, by Country 2019 & 2032
- Table 14: Global 5G Chip Antenna Volume K Forecast, by Country 2019 & 2032
- Table 15: United States 5G Chip Antenna Revenue (million) Forecast, by Application 2019 & 2032
- Table 16: United States 5G Chip Antenna Volume (K) Forecast, by Application 2019 & 2032
- Table 17: Canada 5G Chip Antenna Revenue (million) Forecast, by Application 2019 & 2032
- Table 18: Canada 5G Chip Antenna Volume (K) Forecast, by Application 2019 & 2032
- Table 19: Mexico 5G Chip Antenna Revenue (million) Forecast, by Application 2019 & 2032
- Table 20: Mexico 5G Chip Antenna Volume (K) Forecast, by Application 2019 & 2032
- Table 21: Global 5G Chip Antenna Revenue million Forecast, by Application 2019 & 2032
- Table 22: Global 5G Chip Antenna Volume K Forecast, by Application 2019 & 2032
- Table 23: Global 5G Chip Antenna Revenue million Forecast, by Types 2019 & 2032
- Table 24: Global 5G Chip Antenna Volume K Forecast, by Types 2019 & 2032
- Table 25: Global 5G Chip Antenna Revenue million Forecast, by Country 2019 & 2032
- Table 26: Global 5G Chip Antenna Volume K Forecast, by Country 2019 & 2032
- Table 27: Brazil 5G Chip Antenna Revenue (million) Forecast, by Application 2019 & 2032
- Table 28: Brazil 5G Chip Antenna Volume (K) Forecast, by Application 2019 & 2032
- Table 29: Argentina 5G Chip Antenna Revenue (million) Forecast, by Application 2019 & 2032
- Table 30: Argentina 5G Chip Antenna Volume (K) Forecast, by Application 2019 & 2032
- Table 31: Rest of South America 5G Chip Antenna Revenue (million) Forecast, by Application 2019 & 2032
- Table 32: Rest of South America 5G Chip Antenna Volume (K) Forecast, by Application 2019 & 2032
- Table 33: Global 5G Chip Antenna Revenue million Forecast, by Application 2019 & 2032
- Table 34: Global 5G Chip Antenna Volume K Forecast, by Application 2019 & 2032
- Table 35: Global 5G Chip Antenna Revenue million Forecast, by Types 2019 & 2032
- Table 36: Global 5G Chip Antenna Volume K Forecast, by Types 2019 & 2032
- Table 37: Global 5G Chip Antenna Revenue million Forecast, by Country 2019 & 2032
- Table 38: Global 5G Chip Antenna Volume K Forecast, by Country 2019 & 2032
- Table 39: United Kingdom 5G Chip Antenna Revenue (million) Forecast, by Application 2019 & 2032
- Table 40: United Kingdom 5G Chip Antenna Volume (K) Forecast, by Application 2019 & 2032
- Table 41: Germany 5G Chip Antenna Revenue (million) Forecast, by Application 2019 & 2032
- Table 42: Germany 5G Chip Antenna Volume (K) Forecast, by Application 2019 & 2032
- Table 43: France 5G Chip Antenna Revenue (million) Forecast, by Application 2019 & 2032
- Table 44: France 5G Chip Antenna Volume (K) Forecast, by Application 2019 & 2032
- Table 45: Italy 5G Chip Antenna Revenue (million) Forecast, by Application 2019 & 2032
- Table 46: Italy 5G Chip Antenna Volume (K) Forecast, by Application 2019 & 2032
- Table 47: Spain 5G Chip Antenna Revenue (million) Forecast, by Application 2019 & 2032
- Table 48: Spain 5G Chip Antenna Volume (K) Forecast, by Application 2019 & 2032
- Table 49: Russia 5G Chip Antenna Revenue (million) Forecast, by Application 2019 & 2032
- Table 50: Russia 5G Chip Antenna Volume (K) Forecast, by Application 2019 & 2032
- Table 51: Benelux 5G Chip Antenna Revenue (million) Forecast, by Application 2019 & 2032
- Table 52: Benelux 5G Chip Antenna Volume (K) Forecast, by Application 2019 & 2032
- Table 53: Nordics 5G Chip Antenna Revenue (million) Forecast, by Application 2019 & 2032
- Table 54: Nordics 5G Chip Antenna Volume (K) Forecast, by Application 2019 & 2032
- Table 55: Rest of Europe 5G Chip Antenna Revenue (million) Forecast, by Application 2019 & 2032
- Table 56: Rest of Europe 5G Chip Antenna Volume (K) Forecast, by Application 2019 & 2032
- Table 57: Global 5G Chip Antenna Revenue million Forecast, by Application 2019 & 2032
- Table 58: Global 5G Chip Antenna Volume K Forecast, by Application 2019 & 2032
- Table 59: Global 5G Chip Antenna Revenue million Forecast, by Types 2019 & 2032
- Table 60: Global 5G Chip Antenna Volume K Forecast, by Types 2019 & 2032
- Table 61: Global 5G Chip Antenna Revenue million Forecast, by Country 2019 & 2032
- Table 62: Global 5G Chip Antenna Volume K Forecast, by Country 2019 & 2032
- Table 63: Turkey 5G Chip Antenna Revenue (million) Forecast, by Application 2019 & 2032
- Table 64: Turkey 5G Chip Antenna Volume (K) Forecast, by Application 2019 & 2032
- Table 65: Israel 5G Chip Antenna Revenue (million) Forecast, by Application 2019 & 2032
- Table 66: Israel 5G Chip Antenna Volume (K) Forecast, by Application 2019 & 2032
- Table 67: GCC 5G Chip Antenna Revenue (million) Forecast, by Application 2019 & 2032
- Table 68: GCC 5G Chip Antenna Volume (K) Forecast, by Application 2019 & 2032
- Table 69: North Africa 5G Chip Antenna Revenue (million) Forecast, by Application 2019 & 2032
- Table 70: North Africa 5G Chip Antenna Volume (K) Forecast, by Application 2019 & 2032
- Table 71: South Africa 5G Chip Antenna Revenue (million) Forecast, by Application 2019 & 2032
- Table 72: South Africa 5G Chip Antenna Volume (K) Forecast, by Application 2019 & 2032
- Table 73: Rest of Middle East & Africa 5G Chip Antenna Revenue (million) Forecast, by Application 2019 & 2032
- Table 74: Rest of Middle East & Africa 5G Chip Antenna Volume (K) Forecast, by Application 2019 & 2032
- Table 75: Global 5G Chip Antenna Revenue million Forecast, by Application 2019 & 2032
- Table 76: Global 5G Chip Antenna Volume K Forecast, by Application 2019 & 2032
- Table 77: Global 5G Chip Antenna Revenue million Forecast, by Types 2019 & 2032
- Table 78: Global 5G Chip Antenna Volume K Forecast, by Types 2019 & 2032
- Table 79: Global 5G Chip Antenna Revenue million Forecast, by Country 2019 & 2032
- Table 80: Global 5G Chip Antenna Volume K Forecast, by Country 2019 & 2032
- Table 81: China 5G Chip Antenna Revenue (million) Forecast, by Application 2019 & 2032
- Table 82: China 5G Chip Antenna Volume (K) Forecast, by Application 2019 & 2032
- Table 83: India 5G Chip Antenna Revenue (million) Forecast, by Application 2019 & 2032
- Table 84: India 5G Chip Antenna Volume (K) Forecast, by Application 2019 & 2032
- Table 85: Japan 5G Chip Antenna Revenue (million) Forecast, by Application 2019 & 2032
- Table 86: Japan 5G Chip Antenna Volume (K) Forecast, by Application 2019 & 2032
- Table 87: South Korea 5G Chip Antenna Revenue (million) Forecast, by Application 2019 & 2032
- Table 88: South Korea 5G Chip Antenna Volume (K) Forecast, by Application 2019 & 2032
- Table 89: ASEAN 5G Chip Antenna Revenue (million) Forecast, by Application 2019 & 2032
- Table 90: ASEAN 5G Chip Antenna Volume (K) Forecast, by Application 2019 & 2032
- Table 91: Oceania 5G Chip Antenna Revenue (million) Forecast, by Application 2019 & 2032
- Table 92: Oceania 5G Chip Antenna Volume (K) Forecast, by Application 2019 & 2032
- Table 93: Rest of Asia Pacific 5G Chip Antenna Revenue (million) Forecast, by Application 2019 & 2032
- Table 94: Rest of Asia Pacific 5G Chip Antenna Volume (K) Forecast, by Application 2019 & 2032
Frequently Asked Questions
1. What is the projected Compound Annual Growth Rate (CAGR) of the 5G Chip Antenna?
The projected CAGR is approximately XX%.
2. Which companies are prominent players in the 5G Chip Antenna?
Key companies in the market include Vishay, INPAQ, Antenova, Johanson Technology, Mitsubishi Materials, Abracon, TAIYO YUDEN, Linx Technologies, Wrth Elektronik, Taoglas, Partron, Yageo, Rainsun, Fractus, Cirocomm, Microgate, TDK, Sunlord.
3. What are the main segments of the 5G Chip Antenna?
The market segments include Application, Types.
4. Can you provide details about the market size?
The market size is estimated to be USD XXX million as of 2022.
5. What are some drivers contributing to market growth?
N/A
6. What are the notable trends driving market growth?
N/A
7. Are there any restraints impacting market growth?
N/A
8. Can you provide examples of recent developments in the market?
N/A
9. What pricing options are available for accessing the report?
Pricing options include single-user, multi-user, and enterprise licenses priced at USD 3350.00, USD 5025.00, and USD 6700.00 respectively.
10. Is the market size provided in terms of value or volume?
The market size is provided in terms of value, measured in million and volume, measured in K.
11. Are there any specific market keywords associated with the report?
Yes, the market keyword associated with the report is "5G Chip Antenna," which aids in identifying and referencing the specific market segment covered.
12. How do I determine which pricing option suits my needs best?
The pricing options vary based on user requirements and access needs. Individual users may opt for single-user licenses, while businesses requiring broader access may choose multi-user or enterprise licenses for cost-effective access to the report.
13. Are there any additional resources or data provided in the 5G Chip Antenna report?
While the report offers comprehensive insights, it's advisable to review the specific contents or supplementary materials provided to ascertain if additional resources or data are available.
14. How can I stay updated on further developments or reports in the 5G Chip Antenna?
To stay informed about further developments, trends, and reports in the 5G Chip Antenna, consider subscribing to industry newsletters, following relevant companies and organizations, or regularly checking reputable industry news sources and publications.
Methodology
Step 1 - Identification of Relevant Samples Size from Population Database


Step 2 - Approaches for Defining Global Market Size (Value, Volume* & Price*)

Note*: In applicable scenarios
Step 3 - Data Sources
Primary Research
- Web Analytics
- Survey Reports
- Research Institute
- Latest Research Reports
- Opinion Leaders
Secondary Research
- Annual Reports
- White Paper
- Latest Press Release
- Industry Association
- Paid Database
- Investor Presentations

Step 4 - Data Triangulation
Involves using different sources of information in order to increase the validity of a study
These sources are likely to be stakeholders in a program - participants, other researchers, program staff, other community members, and so on.
Then we put all data in single framework & apply various statistical tools to find out the dynamic on the market.
During the analysis stage, feedback from the stakeholder groups would be compared to determine areas of agreement as well as areas of divergence
