

Key Insights
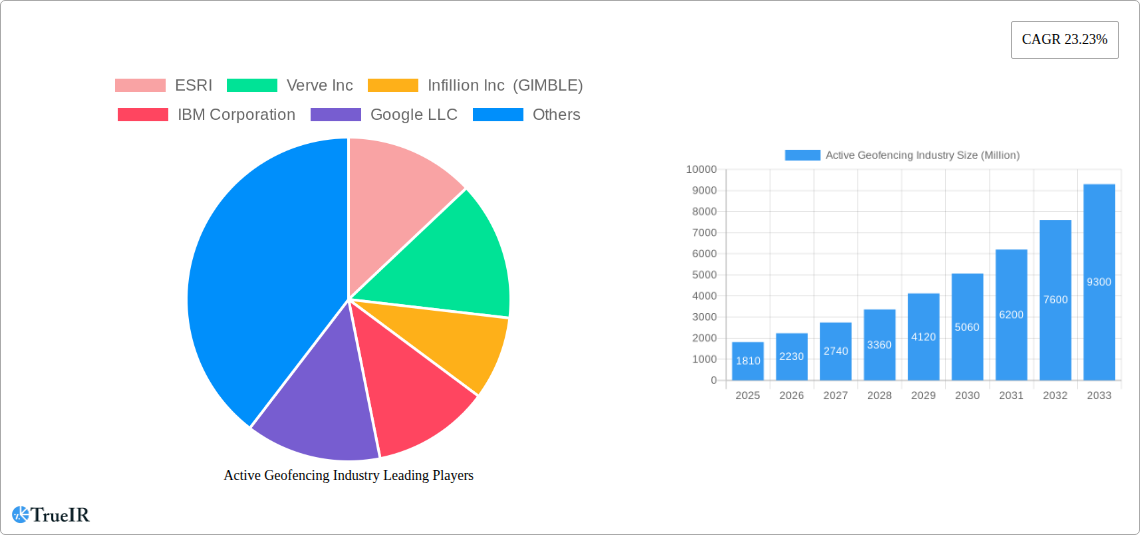
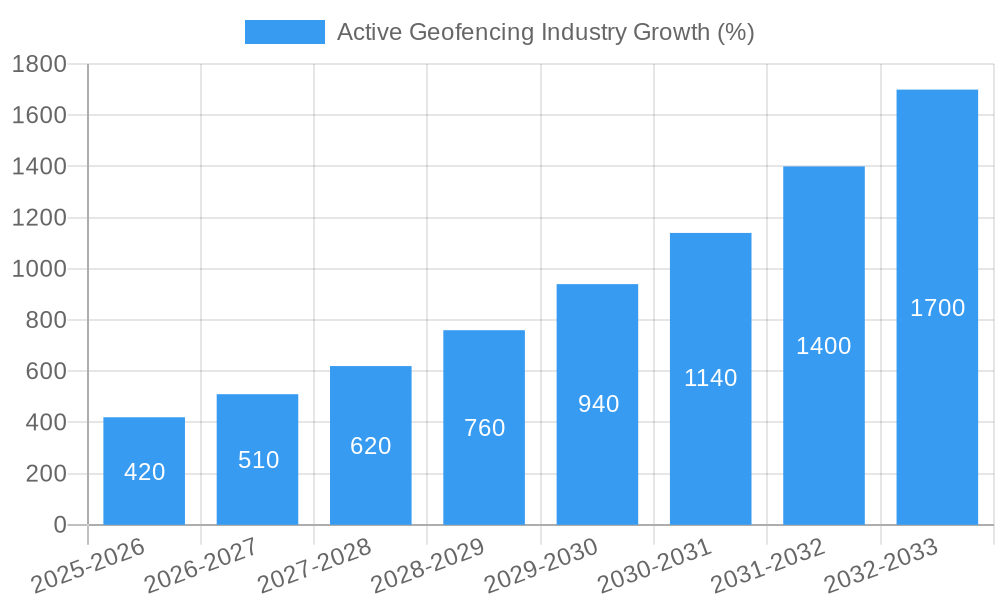
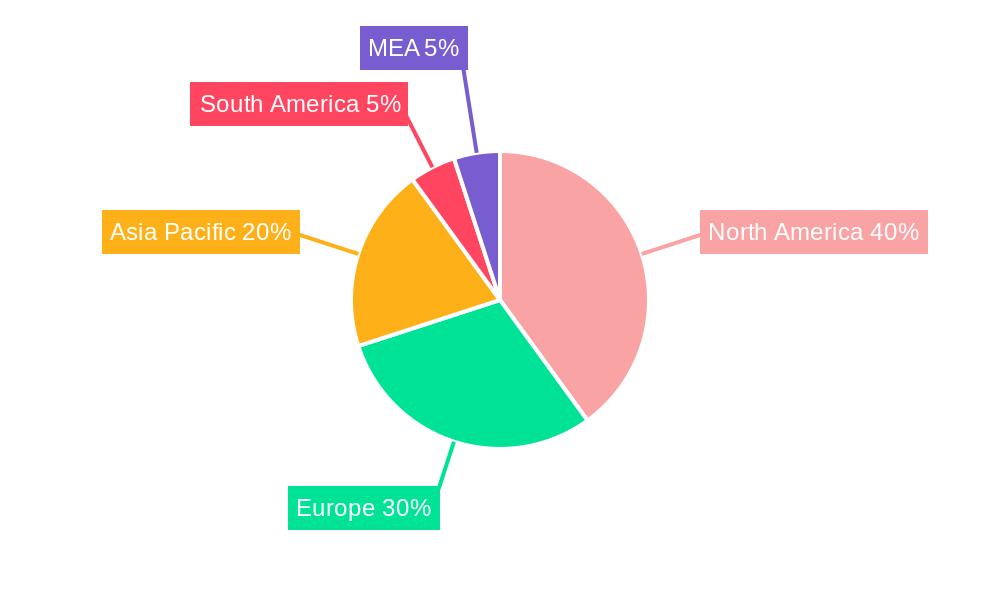
The active geofencing market is experiencing robust growth, projected to reach $1.81 billion in 2025 and exhibiting a compound annual growth rate (CAGR) of 23.23% from 2025 to 2033. This expansion is driven by the increasing adoption of location-based services across diverse sectors. Businesses are leveraging active geofencing for enhanced operational efficiency, improved customer engagement, and streamlined logistics. The retail, banking, financial services, and insurance (BFSI) sectors are key adopters, utilizing geofencing for targeted advertising, fraud prevention, and risk management. Furthermore, the rise of IoT devices and the increasing availability of precise location data are fueling market growth. The market is segmented by organization size (small-to-medium businesses (SMBs), large enterprises) and end-user industry, reflecting the broad applicability of this technology. North America and Europe currently dominate the market, but the Asia-Pacific region is poised for significant growth due to rapid technological advancements and increasing smartphone penetration.
The competitive landscape features a mix of established technology giants like IBM, Google, and Microsoft, alongside specialized geofencing solution providers such as ESRI, Verve Inc., and Infillion Inc. The market's future trajectory will be shaped by ongoing technological innovations, such as the integration of AI and machine learning for more sophisticated geofencing applications. While data privacy concerns and the need for robust security measures represent potential restraints, the overall market outlook remains positive, underpinned by the continuous demand for location-based services and the growing adoption of geofencing across various industries. The increasing integration of geofencing with other technologies like GPS tracking and beacon technology further enhances its utility and expands its market potential.
Active Geofencing Industry Market Report: A Comprehensive Analysis (2019-2033)
This dynamic report provides a comprehensive analysis of the Active Geofencing Industry, projecting a market value exceeding $XX Million by 2033. Leveraging extensive research and data analysis from 2019 to 2024 (Historical Period), with a focus on 2025 (Base Year and Estimated Year), this report offers invaluable insights into market structure, trends, opportunities, and challenges across key segments. The forecast period extends to 2033, providing a long-term perspective for strategic decision-making.
Active Geofencing Industry Market Structure & Competitive Landscape
The Active Geofencing market exhibits a moderately concentrated structure, with key players like Google LLC, Apple Inc, and IBM Corporation holding significant market share. However, the market is dynamic, characterized by ongoing innovation and mergers & acquisitions (M&A). The total M&A volume during the historical period (2019-2024) reached approximately $XX Million. Concentration ratios indicate a moderate level of market consolidation, with the top 5 players accounting for approximately XX% of the market share in 2025.
- Innovation Drivers: Advances in GPS technology, IoT, and AI are driving the adoption of advanced geofencing solutions.
- Regulatory Impacts: Data privacy regulations like GDPR and CCPA influence the development and deployment of geofencing technologies.
- Product Substitutes: While direct substitutes are limited, alternative location-based services pose indirect competition.
- End-User Segmentation: The market is segmented by organization size (small-medium and large businesses) and end-user industry (Banking, Financial Services, and Insurance; Retail; Defense, Government, and Military; Healthcare; Industrial Manufacturing; Transportation and Logistics; Other).
- M&A Trends: Strategic acquisitions are driving consolidation, expanding product portfolios, and enhancing market reach for leading players.
Active Geofencing Industry Market Trends & Opportunities
The Active Geofencing market is experiencing robust growth, with a projected Compound Annual Growth Rate (CAGR) of XX% from 2025 to 2033. Market penetration rates are increasing across various sectors driven by the growing demand for real-time location-based services and the expanding capabilities of geofencing technologies. This growth is fuelled by technological advancements, shifting consumer preferences towards personalized experiences, and intensifying competitive dynamics. Market size is projected to reach $XX Million by 2033, significantly expanding from the $XX Million in 2025. Key growth areas include the adoption of advanced analytics for improved efficiency and security within various industry sectors. Significant opportunities exist in developing innovative applications for diverse industry verticals, leveraging AI and machine learning to improve accuracy and functionalities.
Dominant Markets & Segments in Active Geofencing Industry
The North American region currently dominates the global Active Geofencing market, driven by high technology adoption and a large number of businesses utilizing location-based services. Within the segments, the Large-Scale Businesses segment holds the largest market share, due to their higher investments in advanced technologies. The Retail and Transportation and Logistics end-user industries are witnessing the highest growth rates.
- Key Growth Drivers for Large-Scale Businesses:
- Significant investments in technological advancements.
- Improved operational efficiency and cost reduction.
- Enhanced security and risk management.
- Key Growth Drivers for Retail:
- Increased customer engagement and personalized experiences.
- Improved supply chain management and logistics optimization.
- Enhanced marketing and promotional campaigns.
- Key Growth Drivers for Transportation and Logistics:
- Real-time asset tracking and management.
- Optimized route planning and delivery efficiency.
- Improved fleet management and safety.
Active Geofing Industry Product Analysis
Active geofencing products are evolving rapidly, incorporating advanced features like AI-powered analytics, real-time data integration, and improved accuracy. These advancements enhance the value proposition for businesses across multiple industries, offering better security, efficiency and cost-effectiveness. The market is seeing a shift towards cloud-based solutions and platform-as-a-service (PaaS) models, offering greater scalability and accessibility for businesses of all sizes.
Key Drivers, Barriers & Challenges in Active Geofencing Industry
Key Drivers: The primary drivers are the increasing adoption of IoT devices, advancements in location tracking technologies (GPS, Wi-Fi, Bluetooth), and growing demand for real-time location-based services across diverse sectors. Government initiatives promoting smart city development and increased investments in infrastructure also contribute significantly.
Challenges: Data privacy and security concerns, regulatory complexities around data usage, and potential supply chain disruptions (especially in sourcing specialized hardware) pose significant challenges. Intense competition among established players and emerging startups also restricts market growth for some companies. The dependence on precise location data, which can be affected by factors such as signal strength and interference, represents another key challenge.
Growth Drivers in the Active Geofencing Industry Market
Technological advancements, increasing demand for improved operational efficiency across industries, and supportive government regulations driving the adoption of smart city initiatives are significant growth drivers. The rising adoption of IoT and the increasing availability of affordable and accurate location data are also fueling market growth.
Challenges Impacting Active Geofencing Industry Growth
Stringent data privacy regulations, potential security breaches, and the complexity of integrating geofencing technology with existing systems create hurdles. Furthermore, interoperability issues among different platforms and the relatively high initial investment costs for businesses can hinder market growth.
Key Players Shaping the Active Geofencing Industry Market
- ESRI
- Verve Inc
- Infillion Inc (GIMBLE)
- IBM Corporation
- Google LLC
- SZ DJI Technology Co
- Samsung Electronics Co
- LocationSmart
- Microsoft Corporation
- Radar Labs Inc
- Bluedot Innovation Pty Ltd
- Apple Inc
Significant Active Geofencing Industry Milestones
- July 2023: Radar Labs Inc. launched the Routr Matching API, enhancing the accuracy of location tracking and mileage calculations.
- December 2023: McDonald's announced expansion of its Ready on Arrival pilot program using geofencing to improve order fulfillment efficiency.
Future Outlook for Active Geofencing Industry Market
The Active Geofencing market is poised for continued growth, driven by technological innovations and increasing demand across various sectors. Strategic partnerships, product diversification, and expansion into new markets offer significant opportunities for market players. The focus will shift towards delivering more sophisticated, AI-powered solutions, addressing privacy concerns, and integrating seamlessly with other location-based services. The market is expected to see significant growth in the next decade.
Active Geofencing Industry Segmentation
-
1. Organization Size
- 1.1. Small-Scale and Medium-Scale Businesses
- 1.2. Large-Scale Businesses
-
2. End-user Industry
- 2.1. Banking, Financial Services, and Insurance
- 2.2. Retail
- 2.3. Defense, Government, and Military
- 2.4. Healthcare
- 2.5. Industrial Manufacturing
- 2.6. Transportation and Logistics
- 2.7. Other End-user Industries
Active Geofencing Industry Segmentation By Geography
- 1. North America
- 2. Europe
- 3. Asia Pacific
- 4. Latin America
- 5. Middle East and Africa
Active Geofencing Industry REPORT HIGHLIGHTS
| Aspects | Details |
|---|---|
| Study Period | 2019-2033 |
| Base Year | 2024 |
| Estimated Year | 2025 |
| Forecast Period | 2025-2033 |
| Historical Period | 2019-2024 |
| Growth Rate | CAGR of 23.23% from 2019-2033 |
| Segmentation |
|
Table of Contents
- 1. Introduction
- 1.1. Research Scope
- 1.2. Market Segmentation
- 1.3. Research Methodology
- 1.4. Definitions and Assumptions
- 2. Executive Summary
- 2.1. Introduction
- 3. Market Dynamics
- 3.1. Introduction
- 3.2. Market Drivers
- 3.2.1. Increased Use of Spatial Data and Improved Real-time Location Technology; Higher Adoption of Location-based Application among Consumers
- 3.3. Market Restrains
- 3.3.1. Rising Awareness Regarding Safety and Security among Consumers of Location Tracking
- 3.4. Market Trends
- 3.4.1. Retail Segment to Witness Significant Growth
- 4. Market Factor Analysis
- 4.1. Porters Five Forces
- 4.2. Supply/Value Chain
- 4.3. PESTEL analysis
- 4.4. Market Entropy
- 4.5. Patent/Trademark Analysis
- 5. Global Active Geofencing Industry Analysis, Insights and Forecast, 2019-2031
- 5.1. Market Analysis, Insights and Forecast - by Organization Size
- 5.1.1. Small-Scale and Medium-Scale Businesses
- 5.1.2. Large-Scale Businesses
- 5.2. Market Analysis, Insights and Forecast - by End-user Industry
- 5.2.1. Banking, Financial Services, and Insurance
- 5.2.2. Retail
- 5.2.3. Defense, Government, and Military
- 5.2.4. Healthcare
- 5.2.5. Industrial Manufacturing
- 5.2.6. Transportation and Logistics
- 5.2.7. Other End-user Industries
- 5.3. Market Analysis, Insights and Forecast - by Region
- 5.3.1. North America
- 5.3.2. Europe
- 5.3.3. Asia Pacific
- 5.3.4. Latin America
- 5.3.5. Middle East and Africa
- 5.1. Market Analysis, Insights and Forecast - by Organization Size
- 6. North America Active Geofencing Industry Analysis, Insights and Forecast, 2019-2031
- 6.1. Market Analysis, Insights and Forecast - by Organization Size
- 6.1.1. Small-Scale and Medium-Scale Businesses
- 6.1.2. Large-Scale Businesses
- 6.2. Market Analysis, Insights and Forecast - by End-user Industry
- 6.2.1. Banking, Financial Services, and Insurance
- 6.2.2. Retail
- 6.2.3. Defense, Government, and Military
- 6.2.4. Healthcare
- 6.2.5. Industrial Manufacturing
- 6.2.6. Transportation and Logistics
- 6.2.7. Other End-user Industries
- 6.1. Market Analysis, Insights and Forecast - by Organization Size
- 7. Europe Active Geofencing Industry Analysis, Insights and Forecast, 2019-2031
- 7.1. Market Analysis, Insights and Forecast - by Organization Size
- 7.1.1. Small-Scale and Medium-Scale Businesses
- 7.1.2. Large-Scale Businesses
- 7.2. Market Analysis, Insights and Forecast - by End-user Industry
- 7.2.1. Banking, Financial Services, and Insurance
- 7.2.2. Retail
- 7.2.3. Defense, Government, and Military
- 7.2.4. Healthcare
- 7.2.5. Industrial Manufacturing
- 7.2.6. Transportation and Logistics
- 7.2.7. Other End-user Industries
- 7.1. Market Analysis, Insights and Forecast - by Organization Size
- 8. Asia Pacific Active Geofencing Industry Analysis, Insights and Forecast, 2019-2031
- 8.1. Market Analysis, Insights and Forecast - by Organization Size
- 8.1.1. Small-Scale and Medium-Scale Businesses
- 8.1.2. Large-Scale Businesses
- 8.2. Market Analysis, Insights and Forecast - by End-user Industry
- 8.2.1. Banking, Financial Services, and Insurance
- 8.2.2. Retail
- 8.2.3. Defense, Government, and Military
- 8.2.4. Healthcare
- 8.2.5. Industrial Manufacturing
- 8.2.6. Transportation and Logistics
- 8.2.7. Other End-user Industries
- 8.1. Market Analysis, Insights and Forecast - by Organization Size
- 9. Latin America Active Geofencing Industry Analysis, Insights and Forecast, 2019-2031
- 9.1. Market Analysis, Insights and Forecast - by Organization Size
- 9.1.1. Small-Scale and Medium-Scale Businesses
- 9.1.2. Large-Scale Businesses
- 9.2. Market Analysis, Insights and Forecast - by End-user Industry
- 9.2.1. Banking, Financial Services, and Insurance
- 9.2.2. Retail
- 9.2.3. Defense, Government, and Military
- 9.2.4. Healthcare
- 9.2.5. Industrial Manufacturing
- 9.2.6. Transportation and Logistics
- 9.2.7. Other End-user Industries
- 9.1. Market Analysis, Insights and Forecast - by Organization Size
- 10. Middle East and Africa Active Geofencing Industry Analysis, Insights and Forecast, 2019-2031
- 10.1. Market Analysis, Insights and Forecast - by Organization Size
- 10.1.1. Small-Scale and Medium-Scale Businesses
- 10.1.2. Large-Scale Businesses
- 10.2. Market Analysis, Insights and Forecast - by End-user Industry
- 10.2.1. Banking, Financial Services, and Insurance
- 10.2.2. Retail
- 10.2.3. Defense, Government, and Military
- 10.2.4. Healthcare
- 10.2.5. Industrial Manufacturing
- 10.2.6. Transportation and Logistics
- 10.2.7. Other End-user Industries
- 10.1. Market Analysis, Insights and Forecast - by Organization Size
- 11. North America Active Geofencing Industry Analysis, Insights and Forecast, 2019-2031
- 11.1. Market Analysis, Insights and Forecast - By Country/Sub-region
- 11.1.1 United States
- 11.1.2 Canada
- 11.1.3 Mexico
- 12. Europe Active Geofencing Industry Analysis, Insights and Forecast, 2019-2031
- 12.1. Market Analysis, Insights and Forecast - By Country/Sub-region
- 12.1.1 Germany
- 12.1.2 United Kingdom
- 12.1.3 France
- 12.1.4 Spain
- 12.1.5 Italy
- 12.1.6 Spain
- 12.1.7 Belgium
- 12.1.8 Netherland
- 12.1.9 Nordics
- 12.1.10 Rest of Europe
- 13. Asia Pacific Active Geofencing Industry Analysis, Insights and Forecast, 2019-2031
- 13.1. Market Analysis, Insights and Forecast - By Country/Sub-region
- 13.1.1 China
- 13.1.2 Japan
- 13.1.3 India
- 13.1.4 South Korea
- 13.1.5 Southeast Asia
- 13.1.6 Australia
- 13.1.7 Indonesia
- 13.1.8 Phillipes
- 13.1.9 Singapore
- 13.1.10 Thailandc
- 13.1.11 Rest of Asia Pacific
- 14. South America Active Geofencing Industry Analysis, Insights and Forecast, 2019-2031
- 14.1. Market Analysis, Insights and Forecast - By Country/Sub-region
- 14.1.1 Brazil
- 14.1.2 Argentina
- 14.1.3 Peru
- 14.1.4 Chile
- 14.1.5 Colombia
- 14.1.6 Ecuador
- 14.1.7 Venezuela
- 14.1.8 Rest of South America
- 15. North America Active Geofencing Industry Analysis, Insights and Forecast, 2019-2031
- 15.1. Market Analysis, Insights and Forecast - By Country/Sub-region
- 15.1.1 United States
- 15.1.2 Canada
- 15.1.3 Mexico
- 16. MEA Active Geofencing Industry Analysis, Insights and Forecast, 2019-2031
- 16.1. Market Analysis, Insights and Forecast - By Country/Sub-region
- 16.1.1 United Arab Emirates
- 16.1.2 Saudi Arabia
- 16.1.3 South Africa
- 16.1.4 Rest of Middle East and Africa
- 17. Competitive Analysis
- 17.1. Global Market Share Analysis 2024
- 17.2. Company Profiles
- 17.2.1 ESRI
- 17.2.1.1. Overview
- 17.2.1.2. Products
- 17.2.1.3. SWOT Analysis
- 17.2.1.4. Recent Developments
- 17.2.1.5. Financials (Based on Availability)
- 17.2.2 Verve Inc
- 17.2.2.1. Overview
- 17.2.2.2. Products
- 17.2.2.3. SWOT Analysis
- 17.2.2.4. Recent Developments
- 17.2.2.5. Financials (Based on Availability)
- 17.2.3 Infillion Inc (GIMBLE)
- 17.2.3.1. Overview
- 17.2.3.2. Products
- 17.2.3.3. SWOT Analysis
- 17.2.3.4. Recent Developments
- 17.2.3.5. Financials (Based on Availability)
- 17.2.4 IBM Corporation
- 17.2.4.1. Overview
- 17.2.4.2. Products
- 17.2.4.3. SWOT Analysis
- 17.2.4.4. Recent Developments
- 17.2.4.5. Financials (Based on Availability)
- 17.2.5 Google LLC
- 17.2.5.1. Overview
- 17.2.5.2. Products
- 17.2.5.3. SWOT Analysis
- 17.2.5.4. Recent Developments
- 17.2.5.5. Financials (Based on Availability)
- 17.2.6 SZ DJI Technology Co
- 17.2.6.1. Overview
- 17.2.6.2. Products
- 17.2.6.3. SWOT Analysis
- 17.2.6.4. Recent Developments
- 17.2.6.5. Financials (Based on Availability)
- 17.2.7 Samsung Electronics Co
- 17.2.7.1. Overview
- 17.2.7.2. Products
- 17.2.7.3. SWOT Analysis
- 17.2.7.4. Recent Developments
- 17.2.7.5. Financials (Based on Availability)
- 17.2.8 LocationSmart
- 17.2.8.1. Overview
- 17.2.8.2. Products
- 17.2.8.3. SWOT Analysis
- 17.2.8.4. Recent Developments
- 17.2.8.5. Financials (Based on Availability)
- 17.2.9 Microsoft Corporation
- 17.2.9.1. Overview
- 17.2.9.2. Products
- 17.2.9.3. SWOT Analysis
- 17.2.9.4. Recent Developments
- 17.2.9.5. Financials (Based on Availability)
- 17.2.10 Radar Labs Inc
- 17.2.10.1. Overview
- 17.2.10.2. Products
- 17.2.10.3. SWOT Analysis
- 17.2.10.4. Recent Developments
- 17.2.10.5. Financials (Based on Availability)
- 17.2.11 Bluedot Innovation Pty Ltd
- 17.2.11.1. Overview
- 17.2.11.2. Products
- 17.2.11.3. SWOT Analysis
- 17.2.11.4. Recent Developments
- 17.2.11.5. Financials (Based on Availability)
- 17.2.12 Apple Inc
- 17.2.12.1. Overview
- 17.2.12.2. Products
- 17.2.12.3. SWOT Analysis
- 17.2.12.4. Recent Developments
- 17.2.12.5. Financials (Based on Availability)
- 17.2.1 ESRI
List of Figures
- Figure 1: Global Active Geofencing Industry Revenue Breakdown (Million, %) by Region 2024 & 2032
- Figure 2: North America Active Geofencing Industry Revenue (Million), by Country 2024 & 2032
- Figure 3: North America Active Geofencing Industry Revenue Share (%), by Country 2024 & 2032
- Figure 4: Europe Active Geofencing Industry Revenue (Million), by Country 2024 & 2032
- Figure 5: Europe Active Geofencing Industry Revenue Share (%), by Country 2024 & 2032
- Figure 6: Asia Pacific Active Geofencing Industry Revenue (Million), by Country 2024 & 2032
- Figure 7: Asia Pacific Active Geofencing Industry Revenue Share (%), by Country 2024 & 2032
- Figure 8: South America Active Geofencing Industry Revenue (Million), by Country 2024 & 2032
- Figure 9: South America Active Geofencing Industry Revenue Share (%), by Country 2024 & 2032
- Figure 10: North America Active Geofencing Industry Revenue (Million), by Country 2024 & 2032
- Figure 11: North America Active Geofencing Industry Revenue Share (%), by Country 2024 & 2032
- Figure 12: MEA Active Geofencing Industry Revenue (Million), by Country 2024 & 2032
- Figure 13: MEA Active Geofencing Industry Revenue Share (%), by Country 2024 & 2032
- Figure 14: North America Active Geofencing Industry Revenue (Million), by Organization Size 2024 & 2032
- Figure 15: North America Active Geofencing Industry Revenue Share (%), by Organization Size 2024 & 2032
- Figure 16: North America Active Geofencing Industry Revenue (Million), by End-user Industry 2024 & 2032
- Figure 17: North America Active Geofencing Industry Revenue Share (%), by End-user Industry 2024 & 2032
- Figure 18: North America Active Geofencing Industry Revenue (Million), by Country 2024 & 2032
- Figure 19: North America Active Geofencing Industry Revenue Share (%), by Country 2024 & 2032
- Figure 20: Europe Active Geofencing Industry Revenue (Million), by Organization Size 2024 & 2032
- Figure 21: Europe Active Geofencing Industry Revenue Share (%), by Organization Size 2024 & 2032
- Figure 22: Europe Active Geofencing Industry Revenue (Million), by End-user Industry 2024 & 2032
- Figure 23: Europe Active Geofencing Industry Revenue Share (%), by End-user Industry 2024 & 2032
- Figure 24: Europe Active Geofencing Industry Revenue (Million), by Country 2024 & 2032
- Figure 25: Europe Active Geofencing Industry Revenue Share (%), by Country 2024 & 2032
- Figure 26: Asia Pacific Active Geofencing Industry Revenue (Million), by Organization Size 2024 & 2032
- Figure 27: Asia Pacific Active Geofencing Industry Revenue Share (%), by Organization Size 2024 & 2032
- Figure 28: Asia Pacific Active Geofencing Industry Revenue (Million), by End-user Industry 2024 & 2032
- Figure 29: Asia Pacific Active Geofencing Industry Revenue Share (%), by End-user Industry 2024 & 2032
- Figure 30: Asia Pacific Active Geofencing Industry Revenue (Million), by Country 2024 & 2032
- Figure 31: Asia Pacific Active Geofencing Industry Revenue Share (%), by Country 2024 & 2032
- Figure 32: Latin America Active Geofencing Industry Revenue (Million), by Organization Size 2024 & 2032
- Figure 33: Latin America Active Geofencing Industry Revenue Share (%), by Organization Size 2024 & 2032
- Figure 34: Latin America Active Geofencing Industry Revenue (Million), by End-user Industry 2024 & 2032
- Figure 35: Latin America Active Geofencing Industry Revenue Share (%), by End-user Industry 2024 & 2032
- Figure 36: Latin America Active Geofencing Industry Revenue (Million), by Country 2024 & 2032
- Figure 37: Latin America Active Geofencing Industry Revenue Share (%), by Country 2024 & 2032
- Figure 38: Middle East and Africa Active Geofencing Industry Revenue (Million), by Organization Size 2024 & 2032
- Figure 39: Middle East and Africa Active Geofencing Industry Revenue Share (%), by Organization Size 2024 & 2032
- Figure 40: Middle East and Africa Active Geofencing Industry Revenue (Million), by End-user Industry 2024 & 2032
- Figure 41: Middle East and Africa Active Geofencing Industry Revenue Share (%), by End-user Industry 2024 & 2032
- Figure 42: Middle East and Africa Active Geofencing Industry Revenue (Million), by Country 2024 & 2032
- Figure 43: Middle East and Africa Active Geofencing Industry Revenue Share (%), by Country 2024 & 2032
List of Tables
- Table 1: Global Active Geofencing Industry Revenue Million Forecast, by Region 2019 & 2032
- Table 2: Global Active Geofencing Industry Revenue Million Forecast, by Organization Size 2019 & 2032
- Table 3: Global Active Geofencing Industry Revenue Million Forecast, by End-user Industry 2019 & 2032
- Table 4: Global Active Geofencing Industry Revenue Million Forecast, by Region 2019 & 2032
- Table 5: Global Active Geofencing Industry Revenue Million Forecast, by Country 2019 & 2032
- Table 6: United States Active Geofencing Industry Revenue (Million) Forecast, by Application 2019 & 2032
- Table 7: Canada Active Geofencing Industry Revenue (Million) Forecast, by Application 2019 & 2032
- Table 8: Mexico Active Geofencing Industry Revenue (Million) Forecast, by Application 2019 & 2032
- Table 9: Global Active Geofencing Industry Revenue Million Forecast, by Country 2019 & 2032
- Table 10: Germany Active Geofencing Industry Revenue (Million) Forecast, by Application 2019 & 2032
- Table 11: United Kingdom Active Geofencing Industry Revenue (Million) Forecast, by Application 2019 & 2032
- Table 12: France Active Geofencing Industry Revenue (Million) Forecast, by Application 2019 & 2032
- Table 13: Spain Active Geofencing Industry Revenue (Million) Forecast, by Application 2019 & 2032
- Table 14: Italy Active Geofencing Industry Revenue (Million) Forecast, by Application 2019 & 2032
- Table 15: Spain Active Geofencing Industry Revenue (Million) Forecast, by Application 2019 & 2032
- Table 16: Belgium Active Geofencing Industry Revenue (Million) Forecast, by Application 2019 & 2032
- Table 17: Netherland Active Geofencing Industry Revenue (Million) Forecast, by Application 2019 & 2032
- Table 18: Nordics Active Geofencing Industry Revenue (Million) Forecast, by Application 2019 & 2032
- Table 19: Rest of Europe Active Geofencing Industry Revenue (Million) Forecast, by Application 2019 & 2032
- Table 20: Global Active Geofencing Industry Revenue Million Forecast, by Country 2019 & 2032
- Table 21: China Active Geofencing Industry Revenue (Million) Forecast, by Application 2019 & 2032
- Table 22: Japan Active Geofencing Industry Revenue (Million) Forecast, by Application 2019 & 2032
- Table 23: India Active Geofencing Industry Revenue (Million) Forecast, by Application 2019 & 2032
- Table 24: South Korea Active Geofencing Industry Revenue (Million) Forecast, by Application 2019 & 2032
- Table 25: Southeast Asia Active Geofencing Industry Revenue (Million) Forecast, by Application 2019 & 2032
- Table 26: Australia Active Geofencing Industry Revenue (Million) Forecast, by Application 2019 & 2032
- Table 27: Indonesia Active Geofencing Industry Revenue (Million) Forecast, by Application 2019 & 2032
- Table 28: Phillipes Active Geofencing Industry Revenue (Million) Forecast, by Application 2019 & 2032
- Table 29: Singapore Active Geofencing Industry Revenue (Million) Forecast, by Application 2019 & 2032
- Table 30: Thailandc Active Geofencing Industry Revenue (Million) Forecast, by Application 2019 & 2032
- Table 31: Rest of Asia Pacific Active Geofencing Industry Revenue (Million) Forecast, by Application 2019 & 2032
- Table 32: Global Active Geofencing Industry Revenue Million Forecast, by Country 2019 & 2032
- Table 33: Brazil Active Geofencing Industry Revenue (Million) Forecast, by Application 2019 & 2032
- Table 34: Argentina Active Geofencing Industry Revenue (Million) Forecast, by Application 2019 & 2032
- Table 35: Peru Active Geofencing Industry Revenue (Million) Forecast, by Application 2019 & 2032
- Table 36: Chile Active Geofencing Industry Revenue (Million) Forecast, by Application 2019 & 2032
- Table 37: Colombia Active Geofencing Industry Revenue (Million) Forecast, by Application 2019 & 2032
- Table 38: Ecuador Active Geofencing Industry Revenue (Million) Forecast, by Application 2019 & 2032
- Table 39: Venezuela Active Geofencing Industry Revenue (Million) Forecast, by Application 2019 & 2032
- Table 40: Rest of South America Active Geofencing Industry Revenue (Million) Forecast, by Application 2019 & 2032
- Table 41: Global Active Geofencing Industry Revenue Million Forecast, by Country 2019 & 2032
- Table 42: United States Active Geofencing Industry Revenue (Million) Forecast, by Application 2019 & 2032
- Table 43: Canada Active Geofencing Industry Revenue (Million) Forecast, by Application 2019 & 2032
- Table 44: Mexico Active Geofencing Industry Revenue (Million) Forecast, by Application 2019 & 2032
- Table 45: Global Active Geofencing Industry Revenue Million Forecast, by Country 2019 & 2032
- Table 46: United Arab Emirates Active Geofencing Industry Revenue (Million) Forecast, by Application 2019 & 2032
- Table 47: Saudi Arabia Active Geofencing Industry Revenue (Million) Forecast, by Application 2019 & 2032
- Table 48: South Africa Active Geofencing Industry Revenue (Million) Forecast, by Application 2019 & 2032
- Table 49: Rest of Middle East and Africa Active Geofencing Industry Revenue (Million) Forecast, by Application 2019 & 2032
- Table 50: Global Active Geofencing Industry Revenue Million Forecast, by Organization Size 2019 & 2032
- Table 51: Global Active Geofencing Industry Revenue Million Forecast, by End-user Industry 2019 & 2032
- Table 52: Global Active Geofencing Industry Revenue Million Forecast, by Country 2019 & 2032
- Table 53: Global Active Geofencing Industry Revenue Million Forecast, by Organization Size 2019 & 2032
- Table 54: Global Active Geofencing Industry Revenue Million Forecast, by End-user Industry 2019 & 2032
- Table 55: Global Active Geofencing Industry Revenue Million Forecast, by Country 2019 & 2032
- Table 56: Global Active Geofencing Industry Revenue Million Forecast, by Organization Size 2019 & 2032
- Table 57: Global Active Geofencing Industry Revenue Million Forecast, by End-user Industry 2019 & 2032
- Table 58: Global Active Geofencing Industry Revenue Million Forecast, by Country 2019 & 2032
- Table 59: Global Active Geofencing Industry Revenue Million Forecast, by Organization Size 2019 & 2032
- Table 60: Global Active Geofencing Industry Revenue Million Forecast, by End-user Industry 2019 & 2032
- Table 61: Global Active Geofencing Industry Revenue Million Forecast, by Country 2019 & 2032
- Table 62: Global Active Geofencing Industry Revenue Million Forecast, by Organization Size 2019 & 2032
- Table 63: Global Active Geofencing Industry Revenue Million Forecast, by End-user Industry 2019 & 2032
- Table 64: Global Active Geofencing Industry Revenue Million Forecast, by Country 2019 & 2032
Frequently Asked Questions
1. What is the projected Compound Annual Growth Rate (CAGR) of the Active Geofencing Industry?
The projected CAGR is approximately 23.23%.
2. Which companies are prominent players in the Active Geofencing Industry?
Key companies in the market include ESRI, Verve Inc, Infillion Inc (GIMBLE), IBM Corporation, Google LLC, SZ DJI Technology Co, Samsung Electronics Co, LocationSmart, Microsoft Corporation, Radar Labs Inc, Bluedot Innovation Pty Ltd, Apple Inc.
3. What are the main segments of the Active Geofencing Industry?
The market segments include Organization Size, End-user Industry.
4. Can you provide details about the market size?
The market size is estimated to be USD 1.81 Million as of 2022.
5. What are some drivers contributing to market growth?
Increased Use of Spatial Data and Improved Real-time Location Technology; Higher Adoption of Location-based Application among Consumers.
6. What are the notable trends driving market growth?
Retail Segment to Witness Significant Growth.
7. Are there any restraints impacting market growth?
Rising Awareness Regarding Safety and Security among Consumers of Location Tracking.
8. Can you provide examples of recent developments in the market?
December 2023 : McDonald’s has announced the expanding its Ready on Arrival pilot which uses geofencing to alert employees when a mobile order customer is nearing the restaurant so they can get the customer’s food ready to its top six markets by 2025
9. What pricing options are available for accessing the report?
Pricing options include single-user, multi-user, and enterprise licenses priced at USD 4750, USD 5250, and USD 8750 respectively.
10. Is the market size provided in terms of value or volume?
The market size is provided in terms of value, measured in Million.
11. Are there any specific market keywords associated with the report?
Yes, the market keyword associated with the report is "Active Geofencing Industry," which aids in identifying and referencing the specific market segment covered.
12. How do I determine which pricing option suits my needs best?
The pricing options vary based on user requirements and access needs. Individual users may opt for single-user licenses, while businesses requiring broader access may choose multi-user or enterprise licenses for cost-effective access to the report.
13. Are there any additional resources or data provided in the Active Geofencing Industry report?
While the report offers comprehensive insights, it's advisable to review the specific contents or supplementary materials provided to ascertain if additional resources or data are available.
14. How can I stay updated on further developments or reports in the Active Geofencing Industry?
To stay informed about further developments, trends, and reports in the Active Geofencing Industry, consider subscribing to industry newsletters, following relevant companies and organizations, or regularly checking reputable industry news sources and publications.
Methodology
Step 1 - Identification of Relevant Samples Size from Population Database


Step 2 - Approaches for Defining Global Market Size (Value, Volume* & Price*)

Note*: In applicable scenarios
Step 3 - Data Sources
Primary Research
- Web Analytics
- Survey Reports
- Research Institute
- Latest Research Reports
- Opinion Leaders
Secondary Research
- Annual Reports
- White Paper
- Latest Press Release
- Industry Association
- Paid Database
- Investor Presentations

Step 4 - Data Triangulation
Involves using different sources of information in order to increase the validity of a study
These sources are likely to be stakeholders in a program - participants, other researchers, program staff, other community members, and so on.
Then we put all data in single framework & apply various statistical tools to find out the dynamic on the market.
During the analysis stage, feedback from the stakeholder groups would be compared to determine areas of agreement as well as areas of divergence
