

Key Insights
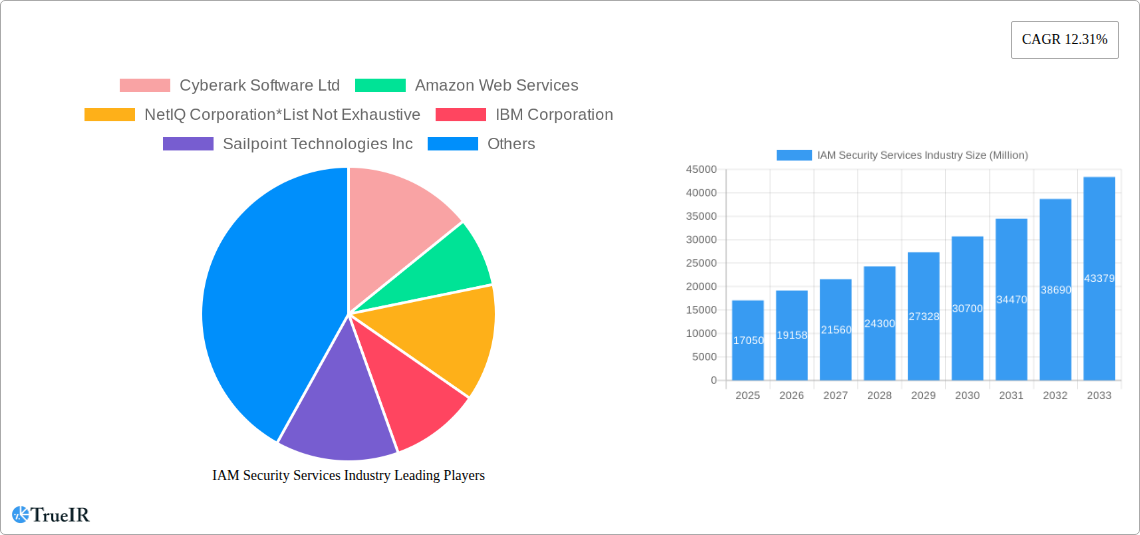
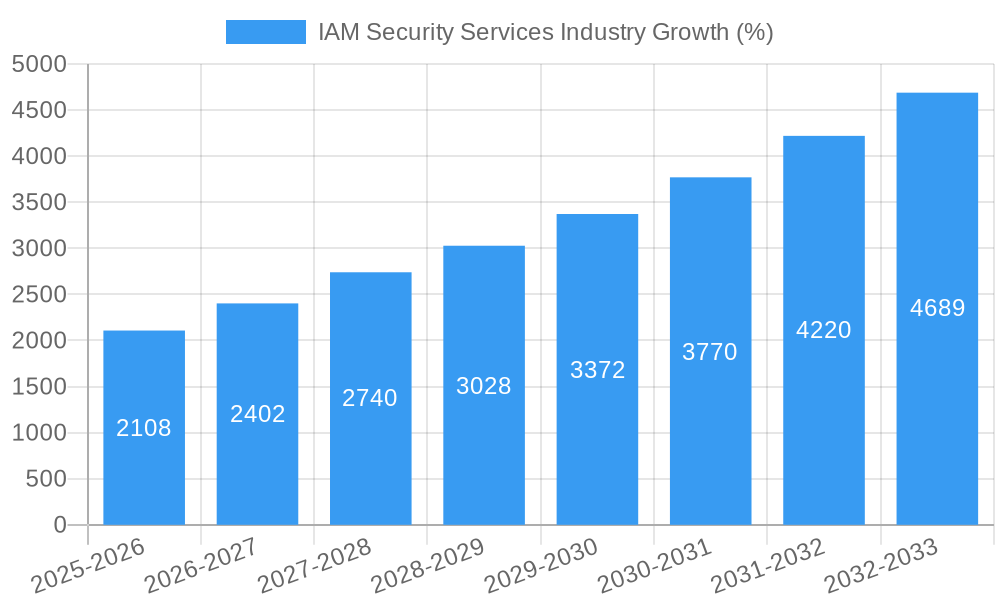
The Identity and Access Management (IAM) security services market is experiencing robust growth, projected to reach a market size of $17.05 billion in 2025, expanding at a Compound Annual Growth Rate (CAGR) of 12.31%. This significant expansion is driven by several key factors. The increasing prevalence of cyberattacks targeting sensitive data, coupled with stringent regulatory compliance requirements like GDPR and CCPA, are compelling organizations across all sectors to prioritize robust IAM solutions. The shift towards cloud-based infrastructure and remote work models further fuels market growth, as organizations require secure access control mechanisms for geographically dispersed employees and diverse applications. The diverse range of solutions offered, encompassing Identity Cloud, Identity Governance and Administration (IGA), Access Management, Directory Services, and other specialized tools, caters to the evolving security needs of businesses of all sizes, from large enterprises to SMEs. Market segmentation by end-user vertical reflects the broad applicability of IAM across BFSI, IT & Telecom, Education, Healthcare, Retail, Energy, and Manufacturing industries, highlighting the pervasive need for secure identity management in today's digital landscape.
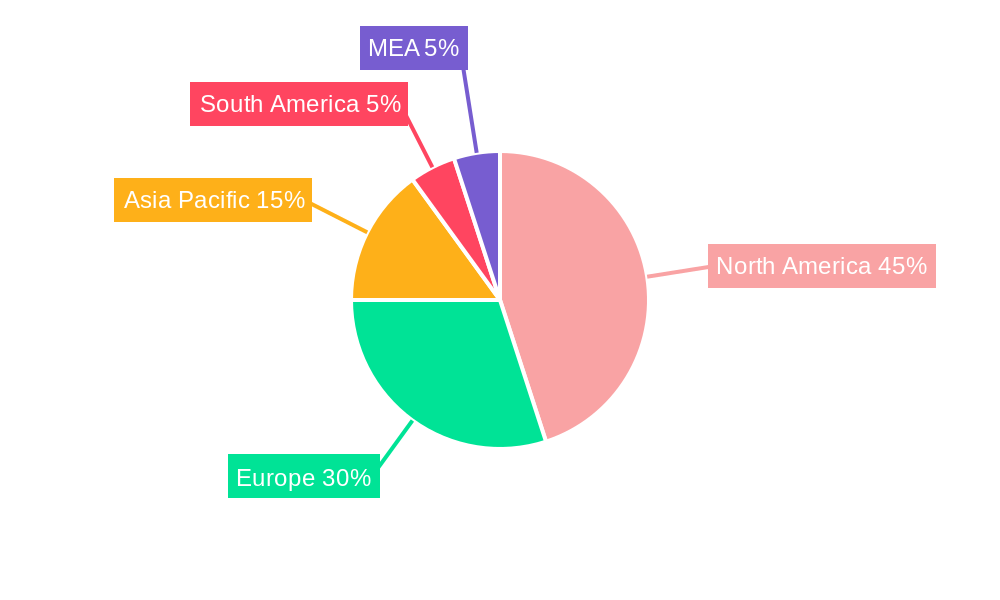
The market's growth trajectory is expected to continue, propelled by increasing adoption of advanced technologies like artificial intelligence (AI) and machine learning (ML) within IAM platforms. AI/ML enhance threat detection and response capabilities, further improving security efficacy. However, the market also faces challenges such as the complexity of implementing and managing IAM solutions, the potential for integration difficulties with existing IT infrastructures, and the need for ongoing training and expertise to effectively utilize these technologies. Despite these hurdles, the sustained demand for robust security in a constantly evolving threat landscape assures the long-term growth of the IAM security services market, with continued innovation and expansion across diverse segments and geographies. North America and Europe currently dominate the market, but regions like Asia-Pacific are witnessing accelerated growth, driven by rapid digital transformation and rising adoption rates.
IAM Security Services Industry Market Report: 2019-2033
This comprehensive report provides a detailed analysis of the IAM (Identity and Access Management) Security Services market, projecting a robust growth trajectory fueled by escalating cybersecurity threats and the increasing adoption of cloud-based solutions. The study covers the period 2019-2033, with a focus on the estimated year 2025, and offers invaluable insights for stakeholders across the industry. The market size is projected to reach USD xx Million by 2033, exhibiting a substantial CAGR of xx%.
IAM Security Services Industry Market Structure & Competitive Landscape
The IAM Security Services market is characterized by a moderately concentrated landscape, with several major players vying for market share. Leading companies include Cyberark Software Ltd, Amazon Web Services, NetIQ Corporation, IBM Corporation, Sailpoint Technologies Inc, Broadcom Inc, Microsoft Corporation, HID Global Corporation, Oracle Corporation, Centrify Corporation, and Okta Inc. However, the market also includes numerous smaller, specialized providers. The concentration ratio (CR4) is estimated at xx%, indicating a competitive but not overly dominated market.
Several factors shape this competitive landscape:
- Innovation Drivers: Continuous advancements in technologies like AI, machine learning, and blockchain are driving innovation in IAM solutions, enhancing security and automation capabilities.
- Regulatory Impacts: Stringent data privacy regulations (e.g., GDPR, CCPA) are compelling organizations to invest heavily in robust IAM systems to ensure compliance.
- Product Substitutes: While dedicated IAM solutions remain dominant, alternative approaches like integrated security platforms are emerging as viable substitutes.
- End-User Segmentation: The market is segmented by organization size (Large Enterprises and SMEs) and end-user verticals (BFSI, IT & Telecom, Education, Healthcare, Retail, Energy, Manufacturing, and Others). Large enterprises currently dominate, but SME adoption is rapidly increasing.
- M&A Trends: The market has witnessed a notable increase in mergers and acquisitions (M&A) activity in recent years. The total value of M&A transactions in the IAM security services sector reached approximately USD xx Million in 2024. This trend is expected to continue, driven by the need for expansion into new markets and the acquisition of specialized technologies.
IAM Security Services Industry Market Trends & Opportunities
The IAM Security Services market is experiencing significant growth driven by several key trends:
The market size, currently estimated at USD xx Million in 2025, is projected to reach USD xx Million by 2033, driven by a compound annual growth rate (CAGR) of xx%. This robust growth is fueled by an increase in cyberattacks, the expanding adoption of cloud-based applications and services, and increasing regulatory pressures for data protection and compliance. The market penetration rate for IAM solutions within large enterprises is high (xx%), but significant growth potential exists within SMEs, where adoption rates are comparatively lower (xx%). The shift toward cloud-based deployments is a major catalyst, offering scalability, flexibility, and cost optimization. However, security concerns associated with cloud-based solutions present both opportunities and challenges for IAM vendors. The market also displays evolving consumer preferences favoring integrated, user-friendly solutions with advanced features like behavioral biometrics and risk-based authentication. The competitive dynamics are intense, with established players focusing on innovation and partnerships to maintain market leadership while new entrants bring disruptive technologies and competitive pricing.
Dominant Markets & Segments in IAM Security Services Industry
By Organization Size: Large enterprises are currently the dominant segment due to their higher budgets and more complex security needs. However, the SME segment is exhibiting the fastest growth rate, driven by increasing awareness of cybersecurity threats and the availability of cost-effective IAM solutions.
By End-user Vertical: The BFSI (Banking, Financial Services, and Insurance) sector is a leading adopter of IAM services due to stringent regulatory requirements and the high value of sensitive data. The IT & Telecom sector also shows substantial demand due to the critical nature of their infrastructure and data. However, growth across all verticals is expected, driven by the increasing digitalization of businesses and their heightened need for robust security measures.
By Type of Solutions: Identity Governance and Access Management (IGA) solutions hold the largest market share, driven by the need for centralized control over user access and privileges. However, the Identity Cloud segment is experiencing rapid growth due to the increasing adoption of cloud-based infrastructure. The market for Directory Services remains substantial but faces competition from cloud-based alternatives.
By Type of Deployment: Cloud-based deployments are experiencing significant growth, driven by cost-effectiveness, scalability, and ease of management. However, the hybrid deployment model, combining on-premise and cloud-based solutions, remains relevant for organizations with complex IT infrastructures. On-premise solutions retain a market segment, primarily within large organizations with stringent security and compliance requirements.
Key Growth Drivers: Increased cybersecurity threats, stringent data privacy regulations, the rise of cloud computing, and the increasing adoption of advanced authentication technologies.
IAM Security Services Industry Product Analysis
The IAM Security Services market offers a diverse range of solutions, including identity governance and administration (IGA), privileged access management (PAM), single sign-on (SSO), multi-factor authentication (MFA), and directory services. Recent product innovations emphasize enhanced automation, AI-driven risk assessment, and seamless integration with existing security infrastructure. The competitive advantage lies in providing secure, scalable, and user-friendly solutions that address the specific needs of diverse customer segments. The market is characterized by a rapid pace of innovation, with vendors constantly developing new features and capabilities to meet evolving security challenges.
Key Drivers, Barriers & Challenges in IAM Security Services Industry
Key Drivers:
- Increasing cyberattacks and data breaches are driving demand for robust IAM solutions.
- Stringent data privacy regulations mandate improved identity and access management.
- The growing adoption of cloud-based applications and services necessitates secure access management.
Challenges and Restraints:
- The complexity of IAM implementations can pose a significant challenge for organizations.
- Integrating IAM solutions with existing IT infrastructure can be time-consuming and costly.
- The skills gap in IAM security expertise hinders effective implementation and management. The lack of skilled professionals leads to increased deployment costs and delays impacting 10% of projects.
- Competitive pricing pressures and the emergence of new technologies create challenges for existing vendors.
Growth Drivers in the IAM Security Services Industry Market
The IAM Security Services market is driven by a confluence of factors including the growing adoption of cloud-based applications, the increasing sophistication of cyber threats, and the rising need for compliance with data privacy regulations. Technological advancements in areas such as AI-powered risk assessment and behavioral biometrics are also fuelling market growth, along with the increasing demand for improved user experience and automation in identity and access management.
Challenges Impacting IAM Security Services Industry Growth
Challenges to growth include the complexity of integrating IAM solutions with legacy systems, the high cost of implementation and maintenance, and the scarcity of skilled professionals. Additionally, regulatory complexities and evolving security threats continuously demand upgrades and adaptations, impacting profitability and slowing adoption rates for some organizations.
Key Players Shaping the IAM Security Services Industry Market
- Cyberark Software Ltd
- Amazon Web Services
- NetIQ Corporation
- IBM Corporation
- Sailpoint Technologies Inc
- Broadcom Inc
- Microsoft Corporation
- HID Global Corporation
- Oracle Corporation
- Centrify Corporation
- Okta Inc
Significant IAM Security Services Industry Milestones
January 2023: Saviynt raised USD 205 Million in growth financing, accelerating innovation in its converged identity platform. This signifies investor confidence in the growing market for advanced IAM solutions.
January 2023: Simeio's acquisition of PathMaker Group expands its identity management service portfolio and strengthens its market position. This consolidates market share and enhances capabilities, potentially impacting competitors.
Future Outlook for IAM Security Services Industry Market
The IAM Security Services market is poised for continued robust growth, driven by persistent cybersecurity threats, expanding cloud adoption, and the increasing importance of data privacy. Strategic opportunities exist for vendors offering innovative solutions that address the evolving needs of organizations, including enhanced automation, AI-powered risk management, and seamless integration across diverse IT environments. The market's future will be shaped by the ongoing evolution of technology and the ever-changing regulatory landscape.
IAM Security Services Industry Segmentation
-
1. Type of Solutions
- 1.1. Identity Cloud
- 1.2. Identity Governance
- 1.3. Access Management
- 1.4. Directory Services
- 1.5. Other Type of Solutions
-
2. Type of Deployment
- 2.1. On-premise
- 2.2. Hybrid
- 2.3. Cloud-based
-
3. Organization Size
- 3.1. Large Enterprises
- 3.2. Small & Medium Enterprises (SMEs)
-
4. End-user Vertical
- 4.1. BFSI
- 4.2. IT & Telecom
- 4.3. Education
- 4.4. Healthcare
- 4.5. Retail
- 4.6. Energy
- 4.7. Manufacturing
- 4.8. Other End-user Vertical
IAM Security Services Industry Segmentation By Geography
-
1. North America
- 1.1. US
- 1.2. Canada
-
2. Europe
- 2.1. UK
- 2.2. Germany
- 2.3. France
- 2.4. Rest of Europe
-
3. Asia Pacific
- 3.1. China
- 3.2. Japan
- 3.3. India
- 3.4. Rest of Asia Pacific
-
4. Latin America
- 4.1. Brazil
- 4.2. Mexico
- 4.3. Rest of Latin America
-
5. Middle East and Africa
- 5.1. Saudi Arabia
- 5.2. UAE
- 5.3. Rest of Middle East and Africa
IAM Security Services Industry REPORT HIGHLIGHTS
| Aspects | Details |
|---|---|
| Study Period | 2019-2033 |
| Base Year | 2024 |
| Estimated Year | 2025 |
| Forecast Period | 2025-2033 |
| Historical Period | 2019-2024 |
| Growth Rate | CAGR of 12.31% from 2019-2033 |
| Segmentation |
|
Table of Contents
- 1. Introduction
- 1.1. Research Scope
- 1.2. Market Segmentation
- 1.3. Research Methodology
- 1.4. Definitions and Assumptions
- 2. Executive Summary
- 2.1. Introduction
- 3. Market Dynamics
- 3.1. Introduction
- 3.2. Market Drivers
- 3.2.1. Increasing Security Concerns; Increasing Number of Cyber Data Breaches
- 3.3. Market Restrains
- 3.3.1. High Costs of Security Solution; Complexity in Integration with Existing Network
- 3.4. Market Trends
- 3.4.1. The IT & Telecom Segment is Expected to Register a Strong Growth
- 4. Market Factor Analysis
- 4.1. Porters Five Forces
- 4.2. Supply/Value Chain
- 4.3. PESTEL analysis
- 4.4. Market Entropy
- 4.5. Patent/Trademark Analysis
- 5. Global IAM Security Services Industry Analysis, Insights and Forecast, 2019-2031
- 5.1. Market Analysis, Insights and Forecast - by Type of Solutions
- 5.1.1. Identity Cloud
- 5.1.2. Identity Governance
- 5.1.3. Access Management
- 5.1.4. Directory Services
- 5.1.5. Other Type of Solutions
- 5.2. Market Analysis, Insights and Forecast - by Type of Deployment
- 5.2.1. On-premise
- 5.2.2. Hybrid
- 5.2.3. Cloud-based
- 5.3. Market Analysis, Insights and Forecast - by Organization Size
- 5.3.1. Large Enterprises
- 5.3.2. Small & Medium Enterprises (SMEs)
- 5.4. Market Analysis, Insights and Forecast - by End-user Vertical
- 5.4.1. BFSI
- 5.4.2. IT & Telecom
- 5.4.3. Education
- 5.4.4. Healthcare
- 5.4.5. Retail
- 5.4.6. Energy
- 5.4.7. Manufacturing
- 5.4.8. Other End-user Vertical
- 5.5. Market Analysis, Insights and Forecast - by Region
- 5.5.1. North America
- 5.5.2. Europe
- 5.5.3. Asia Pacific
- 5.5.4. Latin America
- 5.5.5. Middle East and Africa
- 5.1. Market Analysis, Insights and Forecast - by Type of Solutions
- 6. North America IAM Security Services Industry Analysis, Insights and Forecast, 2019-2031
- 6.1. Market Analysis, Insights and Forecast - by Type of Solutions
- 6.1.1. Identity Cloud
- 6.1.2. Identity Governance
- 6.1.3. Access Management
- 6.1.4. Directory Services
- 6.1.5. Other Type of Solutions
- 6.2. Market Analysis, Insights and Forecast - by Type of Deployment
- 6.2.1. On-premise
- 6.2.2. Hybrid
- 6.2.3. Cloud-based
- 6.3. Market Analysis, Insights and Forecast - by Organization Size
- 6.3.1. Large Enterprises
- 6.3.2. Small & Medium Enterprises (SMEs)
- 6.4. Market Analysis, Insights and Forecast - by End-user Vertical
- 6.4.1. BFSI
- 6.4.2. IT & Telecom
- 6.4.3. Education
- 6.4.4. Healthcare
- 6.4.5. Retail
- 6.4.6. Energy
- 6.4.7. Manufacturing
- 6.4.8. Other End-user Vertical
- 6.1. Market Analysis, Insights and Forecast - by Type of Solutions
- 7. Europe IAM Security Services Industry Analysis, Insights and Forecast, 2019-2031
- 7.1. Market Analysis, Insights and Forecast - by Type of Solutions
- 7.1.1. Identity Cloud
- 7.1.2. Identity Governance
- 7.1.3. Access Management
- 7.1.4. Directory Services
- 7.1.5. Other Type of Solutions
- 7.2. Market Analysis, Insights and Forecast - by Type of Deployment
- 7.2.1. On-premise
- 7.2.2. Hybrid
- 7.2.3. Cloud-based
- 7.3. Market Analysis, Insights and Forecast - by Organization Size
- 7.3.1. Large Enterprises
- 7.3.2. Small & Medium Enterprises (SMEs)
- 7.4. Market Analysis, Insights and Forecast - by End-user Vertical
- 7.4.1. BFSI
- 7.4.2. IT & Telecom
- 7.4.3. Education
- 7.4.4. Healthcare
- 7.4.5. Retail
- 7.4.6. Energy
- 7.4.7. Manufacturing
- 7.4.8. Other End-user Vertical
- 7.1. Market Analysis, Insights and Forecast - by Type of Solutions
- 8. Asia Pacific IAM Security Services Industry Analysis, Insights and Forecast, 2019-2031
- 8.1. Market Analysis, Insights and Forecast - by Type of Solutions
- 8.1.1. Identity Cloud
- 8.1.2. Identity Governance
- 8.1.3. Access Management
- 8.1.4. Directory Services
- 8.1.5. Other Type of Solutions
- 8.2. Market Analysis, Insights and Forecast - by Type of Deployment
- 8.2.1. On-premise
- 8.2.2. Hybrid
- 8.2.3. Cloud-based
- 8.3. Market Analysis, Insights and Forecast - by Organization Size
- 8.3.1. Large Enterprises
- 8.3.2. Small & Medium Enterprises (SMEs)
- 8.4. Market Analysis, Insights and Forecast - by End-user Vertical
- 8.4.1. BFSI
- 8.4.2. IT & Telecom
- 8.4.3. Education
- 8.4.4. Healthcare
- 8.4.5. Retail
- 8.4.6. Energy
- 8.4.7. Manufacturing
- 8.4.8. Other End-user Vertical
- 8.1. Market Analysis, Insights and Forecast - by Type of Solutions
- 9. Latin America IAM Security Services Industry Analysis, Insights and Forecast, 2019-2031
- 9.1. Market Analysis, Insights and Forecast - by Type of Solutions
- 9.1.1. Identity Cloud
- 9.1.2. Identity Governance
- 9.1.3. Access Management
- 9.1.4. Directory Services
- 9.1.5. Other Type of Solutions
- 9.2. Market Analysis, Insights and Forecast - by Type of Deployment
- 9.2.1. On-premise
- 9.2.2. Hybrid
- 9.2.3. Cloud-based
- 9.3. Market Analysis, Insights and Forecast - by Organization Size
- 9.3.1. Large Enterprises
- 9.3.2. Small & Medium Enterprises (SMEs)
- 9.4. Market Analysis, Insights and Forecast - by End-user Vertical
- 9.4.1. BFSI
- 9.4.2. IT & Telecom
- 9.4.3. Education
- 9.4.4. Healthcare
- 9.4.5. Retail
- 9.4.6. Energy
- 9.4.7. Manufacturing
- 9.4.8. Other End-user Vertical
- 9.1. Market Analysis, Insights and Forecast - by Type of Solutions
- 10. Middle East and Africa IAM Security Services Industry Analysis, Insights and Forecast, 2019-2031
- 10.1. Market Analysis, Insights and Forecast - by Type of Solutions
- 10.1.1. Identity Cloud
- 10.1.2. Identity Governance
- 10.1.3. Access Management
- 10.1.4. Directory Services
- 10.1.5. Other Type of Solutions
- 10.2. Market Analysis, Insights and Forecast - by Type of Deployment
- 10.2.1. On-premise
- 10.2.2. Hybrid
- 10.2.3. Cloud-based
- 10.3. Market Analysis, Insights and Forecast - by Organization Size
- 10.3.1. Large Enterprises
- 10.3.2. Small & Medium Enterprises (SMEs)
- 10.4. Market Analysis, Insights and Forecast - by End-user Vertical
- 10.4.1. BFSI
- 10.4.2. IT & Telecom
- 10.4.3. Education
- 10.4.4. Healthcare
- 10.4.5. Retail
- 10.4.6. Energy
- 10.4.7. Manufacturing
- 10.4.8. Other End-user Vertical
- 10.1. Market Analysis, Insights and Forecast - by Type of Solutions
- 11. North America IAM Security Services Industry Analysis, Insights and Forecast, 2019-2031
- 11.1. Market Analysis, Insights and Forecast - By Country/Sub-region
- 11.1.1 United States
- 11.1.2 Canada
- 11.1.3 Mexico
- 12. Europe IAM Security Services Industry Analysis, Insights and Forecast, 2019-2031
- 12.1. Market Analysis, Insights and Forecast - By Country/Sub-region
- 12.1.1 Germany
- 12.1.2 United Kingdom
- 12.1.3 France
- 12.1.4 Spain
- 12.1.5 Italy
- 12.1.6 Spain
- 12.1.7 Belgium
- 12.1.8 Netherland
- 12.1.9 Nordics
- 12.1.10 Rest of Europe
- 13. Asia Pacific IAM Security Services Industry Analysis, Insights and Forecast, 2019-2031
- 13.1. Market Analysis, Insights and Forecast - By Country/Sub-region
- 13.1.1 China
- 13.1.2 Japan
- 13.1.3 India
- 13.1.4 South Korea
- 13.1.5 Southeast Asia
- 13.1.6 Australia
- 13.1.7 Indonesia
- 13.1.8 Phillipes
- 13.1.9 Singapore
- 13.1.10 Thailandc
- 13.1.11 Rest of Asia Pacific
- 14. South America IAM Security Services Industry Analysis, Insights and Forecast, 2019-2031
- 14.1. Market Analysis, Insights and Forecast - By Country/Sub-region
- 14.1.1 Brazil
- 14.1.2 Argentina
- 14.1.3 Peru
- 14.1.4 Chile
- 14.1.5 Colombia
- 14.1.6 Ecuador
- 14.1.7 Venezuela
- 14.1.8 Rest of South America
- 15. North America IAM Security Services Industry Analysis, Insights and Forecast, 2019-2031
- 15.1. Market Analysis, Insights and Forecast - By Country/Sub-region
- 15.1.1 United States
- 15.1.2 Canada
- 15.1.3 Mexico
- 16. MEA IAM Security Services Industry Analysis, Insights and Forecast, 2019-2031
- 16.1. Market Analysis, Insights and Forecast - By Country/Sub-region
- 16.1.1 United Arab Emirates
- 16.1.2 Saudi Arabia
- 16.1.3 South Africa
- 16.1.4 Rest of Middle East and Africa
- 17. Competitive Analysis
- 17.1. Global Market Share Analysis 2024
- 17.2. Company Profiles
- 17.2.1 Cyberark Software Ltd
- 17.2.1.1. Overview
- 17.2.1.2. Products
- 17.2.1.3. SWOT Analysis
- 17.2.1.4. Recent Developments
- 17.2.1.5. Financials (Based on Availability)
- 17.2.2 Amazon Web Services
- 17.2.2.1. Overview
- 17.2.2.2. Products
- 17.2.2.3. SWOT Analysis
- 17.2.2.4. Recent Developments
- 17.2.2.5. Financials (Based on Availability)
- 17.2.3 NetIQ Corporation*List Not Exhaustive
- 17.2.3.1. Overview
- 17.2.3.2. Products
- 17.2.3.3. SWOT Analysis
- 17.2.3.4. Recent Developments
- 17.2.3.5. Financials (Based on Availability)
- 17.2.4 IBM Corporation
- 17.2.4.1. Overview
- 17.2.4.2. Products
- 17.2.4.3. SWOT Analysis
- 17.2.4.4. Recent Developments
- 17.2.4.5. Financials (Based on Availability)
- 17.2.5 Sailpoint Technologies Inc
- 17.2.5.1. Overview
- 17.2.5.2. Products
- 17.2.5.3. SWOT Analysis
- 17.2.5.4. Recent Developments
- 17.2.5.5. Financials (Based on Availability)
- 17.2.6 Broadcom Inc
- 17.2.6.1. Overview
- 17.2.6.2. Products
- 17.2.6.3. SWOT Analysis
- 17.2.6.4. Recent Developments
- 17.2.6.5. Financials (Based on Availability)
- 17.2.7 Microsoft Corporation
- 17.2.7.1. Overview
- 17.2.7.2. Products
- 17.2.7.3. SWOT Analysis
- 17.2.7.4. Recent Developments
- 17.2.7.5. Financials (Based on Availability)
- 17.2.8 HID Global Corporation
- 17.2.8.1. Overview
- 17.2.8.2. Products
- 17.2.8.3. SWOT Analysis
- 17.2.8.4. Recent Developments
- 17.2.8.5. Financials (Based on Availability)
- 17.2.9 Oracle Corporation
- 17.2.9.1. Overview
- 17.2.9.2. Products
- 17.2.9.3. SWOT Analysis
- 17.2.9.4. Recent Developments
- 17.2.9.5. Financials (Based on Availability)
- 17.2.10 Centrify Corporation
- 17.2.10.1. Overview
- 17.2.10.2. Products
- 17.2.10.3. SWOT Analysis
- 17.2.10.4. Recent Developments
- 17.2.10.5. Financials (Based on Availability)
- 17.2.11 Okta Inc
- 17.2.11.1. Overview
- 17.2.11.2. Products
- 17.2.11.3. SWOT Analysis
- 17.2.11.4. Recent Developments
- 17.2.11.5. Financials (Based on Availability)
- 17.2.1 Cyberark Software Ltd
List of Figures
- Figure 1: Global IAM Security Services Industry Revenue Breakdown (Million, %) by Region 2024 & 2032
- Figure 2: North America IAM Security Services Industry Revenue (Million), by Country 2024 & 2032
- Figure 3: North America IAM Security Services Industry Revenue Share (%), by Country 2024 & 2032
- Figure 4: Europe IAM Security Services Industry Revenue (Million), by Country 2024 & 2032
- Figure 5: Europe IAM Security Services Industry Revenue Share (%), by Country 2024 & 2032
- Figure 6: Asia Pacific IAM Security Services Industry Revenue (Million), by Country 2024 & 2032
- Figure 7: Asia Pacific IAM Security Services Industry Revenue Share (%), by Country 2024 & 2032
- Figure 8: South America IAM Security Services Industry Revenue (Million), by Country 2024 & 2032
- Figure 9: South America IAM Security Services Industry Revenue Share (%), by Country 2024 & 2032
- Figure 10: North America IAM Security Services Industry Revenue (Million), by Country 2024 & 2032
- Figure 11: North America IAM Security Services Industry Revenue Share (%), by Country 2024 & 2032
- Figure 12: MEA IAM Security Services Industry Revenue (Million), by Country 2024 & 2032
- Figure 13: MEA IAM Security Services Industry Revenue Share (%), by Country 2024 & 2032
- Figure 14: North America IAM Security Services Industry Revenue (Million), by Type of Solutions 2024 & 2032
- Figure 15: North America IAM Security Services Industry Revenue Share (%), by Type of Solutions 2024 & 2032
- Figure 16: North America IAM Security Services Industry Revenue (Million), by Type of Deployment 2024 & 2032
- Figure 17: North America IAM Security Services Industry Revenue Share (%), by Type of Deployment 2024 & 2032
- Figure 18: North America IAM Security Services Industry Revenue (Million), by Organization Size 2024 & 2032
- Figure 19: North America IAM Security Services Industry Revenue Share (%), by Organization Size 2024 & 2032
- Figure 20: North America IAM Security Services Industry Revenue (Million), by End-user Vertical 2024 & 2032
- Figure 21: North America IAM Security Services Industry Revenue Share (%), by End-user Vertical 2024 & 2032
- Figure 22: North America IAM Security Services Industry Revenue (Million), by Country 2024 & 2032
- Figure 23: North America IAM Security Services Industry Revenue Share (%), by Country 2024 & 2032
- Figure 24: Europe IAM Security Services Industry Revenue (Million), by Type of Solutions 2024 & 2032
- Figure 25: Europe IAM Security Services Industry Revenue Share (%), by Type of Solutions 2024 & 2032
- Figure 26: Europe IAM Security Services Industry Revenue (Million), by Type of Deployment 2024 & 2032
- Figure 27: Europe IAM Security Services Industry Revenue Share (%), by Type of Deployment 2024 & 2032
- Figure 28: Europe IAM Security Services Industry Revenue (Million), by Organization Size 2024 & 2032
- Figure 29: Europe IAM Security Services Industry Revenue Share (%), by Organization Size 2024 & 2032
- Figure 30: Europe IAM Security Services Industry Revenue (Million), by End-user Vertical 2024 & 2032
- Figure 31: Europe IAM Security Services Industry Revenue Share (%), by End-user Vertical 2024 & 2032
- Figure 32: Europe IAM Security Services Industry Revenue (Million), by Country 2024 & 2032
- Figure 33: Europe IAM Security Services Industry Revenue Share (%), by Country 2024 & 2032
- Figure 34: Asia Pacific IAM Security Services Industry Revenue (Million), by Type of Solutions 2024 & 2032
- Figure 35: Asia Pacific IAM Security Services Industry Revenue Share (%), by Type of Solutions 2024 & 2032
- Figure 36: Asia Pacific IAM Security Services Industry Revenue (Million), by Type of Deployment 2024 & 2032
- Figure 37: Asia Pacific IAM Security Services Industry Revenue Share (%), by Type of Deployment 2024 & 2032
- Figure 38: Asia Pacific IAM Security Services Industry Revenue (Million), by Organization Size 2024 & 2032
- Figure 39: Asia Pacific IAM Security Services Industry Revenue Share (%), by Organization Size 2024 & 2032
- Figure 40: Asia Pacific IAM Security Services Industry Revenue (Million), by End-user Vertical 2024 & 2032
- Figure 41: Asia Pacific IAM Security Services Industry Revenue Share (%), by End-user Vertical 2024 & 2032
- Figure 42: Asia Pacific IAM Security Services Industry Revenue (Million), by Country 2024 & 2032
- Figure 43: Asia Pacific IAM Security Services Industry Revenue Share (%), by Country 2024 & 2032
- Figure 44: Latin America IAM Security Services Industry Revenue (Million), by Type of Solutions 2024 & 2032
- Figure 45: Latin America IAM Security Services Industry Revenue Share (%), by Type of Solutions 2024 & 2032
- Figure 46: Latin America IAM Security Services Industry Revenue (Million), by Type of Deployment 2024 & 2032
- Figure 47: Latin America IAM Security Services Industry Revenue Share (%), by Type of Deployment 2024 & 2032
- Figure 48: Latin America IAM Security Services Industry Revenue (Million), by Organization Size 2024 & 2032
- Figure 49: Latin America IAM Security Services Industry Revenue Share (%), by Organization Size 2024 & 2032
- Figure 50: Latin America IAM Security Services Industry Revenue (Million), by End-user Vertical 2024 & 2032
- Figure 51: Latin America IAM Security Services Industry Revenue Share (%), by End-user Vertical 2024 & 2032
- Figure 52: Latin America IAM Security Services Industry Revenue (Million), by Country 2024 & 2032
- Figure 53: Latin America IAM Security Services Industry Revenue Share (%), by Country 2024 & 2032
- Figure 54: Middle East and Africa IAM Security Services Industry Revenue (Million), by Type of Solutions 2024 & 2032
- Figure 55: Middle East and Africa IAM Security Services Industry Revenue Share (%), by Type of Solutions 2024 & 2032
- Figure 56: Middle East and Africa IAM Security Services Industry Revenue (Million), by Type of Deployment 2024 & 2032
- Figure 57: Middle East and Africa IAM Security Services Industry Revenue Share (%), by Type of Deployment 2024 & 2032
- Figure 58: Middle East and Africa IAM Security Services Industry Revenue (Million), by Organization Size 2024 & 2032
- Figure 59: Middle East and Africa IAM Security Services Industry Revenue Share (%), by Organization Size 2024 & 2032
- Figure 60: Middle East and Africa IAM Security Services Industry Revenue (Million), by End-user Vertical 2024 & 2032
- Figure 61: Middle East and Africa IAM Security Services Industry Revenue Share (%), by End-user Vertical 2024 & 2032
- Figure 62: Middle East and Africa IAM Security Services Industry Revenue (Million), by Country 2024 & 2032
- Figure 63: Middle East and Africa IAM Security Services Industry Revenue Share (%), by Country 2024 & 2032
List of Tables
- Table 1: Global IAM Security Services Industry Revenue Million Forecast, by Region 2019 & 2032
- Table 2: Global IAM Security Services Industry Revenue Million Forecast, by Type of Solutions 2019 & 2032
- Table 3: Global IAM Security Services Industry Revenue Million Forecast, by Type of Deployment 2019 & 2032
- Table 4: Global IAM Security Services Industry Revenue Million Forecast, by Organization Size 2019 & 2032
- Table 5: Global IAM Security Services Industry Revenue Million Forecast, by End-user Vertical 2019 & 2032
- Table 6: Global IAM Security Services Industry Revenue Million Forecast, by Region 2019 & 2032
- Table 7: Global IAM Security Services Industry Revenue Million Forecast, by Country 2019 & 2032
- Table 8: United States IAM Security Services Industry Revenue (Million) Forecast, by Application 2019 & 2032
- Table 9: Canada IAM Security Services Industry Revenue (Million) Forecast, by Application 2019 & 2032
- Table 10: Mexico IAM Security Services Industry Revenue (Million) Forecast, by Application 2019 & 2032
- Table 11: Global IAM Security Services Industry Revenue Million Forecast, by Country 2019 & 2032
- Table 12: Germany IAM Security Services Industry Revenue (Million) Forecast, by Application 2019 & 2032
- Table 13: United Kingdom IAM Security Services Industry Revenue (Million) Forecast, by Application 2019 & 2032
- Table 14: France IAM Security Services Industry Revenue (Million) Forecast, by Application 2019 & 2032
- Table 15: Spain IAM Security Services Industry Revenue (Million) Forecast, by Application 2019 & 2032
- Table 16: Italy IAM Security Services Industry Revenue (Million) Forecast, by Application 2019 & 2032
- Table 17: Spain IAM Security Services Industry Revenue (Million) Forecast, by Application 2019 & 2032
- Table 18: Belgium IAM Security Services Industry Revenue (Million) Forecast, by Application 2019 & 2032
- Table 19: Netherland IAM Security Services Industry Revenue (Million) Forecast, by Application 2019 & 2032
- Table 20: Nordics IAM Security Services Industry Revenue (Million) Forecast, by Application 2019 & 2032
- Table 21: Rest of Europe IAM Security Services Industry Revenue (Million) Forecast, by Application 2019 & 2032
- Table 22: Global IAM Security Services Industry Revenue Million Forecast, by Country 2019 & 2032
- Table 23: China IAM Security Services Industry Revenue (Million) Forecast, by Application 2019 & 2032
- Table 24: Japan IAM Security Services Industry Revenue (Million) Forecast, by Application 2019 & 2032
- Table 25: India IAM Security Services Industry Revenue (Million) Forecast, by Application 2019 & 2032
- Table 26: South Korea IAM Security Services Industry Revenue (Million) Forecast, by Application 2019 & 2032
- Table 27: Southeast Asia IAM Security Services Industry Revenue (Million) Forecast, by Application 2019 & 2032
- Table 28: Australia IAM Security Services Industry Revenue (Million) Forecast, by Application 2019 & 2032
- Table 29: Indonesia IAM Security Services Industry Revenue (Million) Forecast, by Application 2019 & 2032
- Table 30: Phillipes IAM Security Services Industry Revenue (Million) Forecast, by Application 2019 & 2032
- Table 31: Singapore IAM Security Services Industry Revenue (Million) Forecast, by Application 2019 & 2032
- Table 32: Thailandc IAM Security Services Industry Revenue (Million) Forecast, by Application 2019 & 2032
- Table 33: Rest of Asia Pacific IAM Security Services Industry Revenue (Million) Forecast, by Application 2019 & 2032
- Table 34: Global IAM Security Services Industry Revenue Million Forecast, by Country 2019 & 2032
- Table 35: Brazil IAM Security Services Industry Revenue (Million) Forecast, by Application 2019 & 2032
- Table 36: Argentina IAM Security Services Industry Revenue (Million) Forecast, by Application 2019 & 2032
- Table 37: Peru IAM Security Services Industry Revenue (Million) Forecast, by Application 2019 & 2032
- Table 38: Chile IAM Security Services Industry Revenue (Million) Forecast, by Application 2019 & 2032
- Table 39: Colombia IAM Security Services Industry Revenue (Million) Forecast, by Application 2019 & 2032
- Table 40: Ecuador IAM Security Services Industry Revenue (Million) Forecast, by Application 2019 & 2032
- Table 41: Venezuela IAM Security Services Industry Revenue (Million) Forecast, by Application 2019 & 2032
- Table 42: Rest of South America IAM Security Services Industry Revenue (Million) Forecast, by Application 2019 & 2032
- Table 43: Global IAM Security Services Industry Revenue Million Forecast, by Country 2019 & 2032
- Table 44: United States IAM Security Services Industry Revenue (Million) Forecast, by Application 2019 & 2032
- Table 45: Canada IAM Security Services Industry Revenue (Million) Forecast, by Application 2019 & 2032
- Table 46: Mexico IAM Security Services Industry Revenue (Million) Forecast, by Application 2019 & 2032
- Table 47: Global IAM Security Services Industry Revenue Million Forecast, by Country 2019 & 2032
- Table 48: United Arab Emirates IAM Security Services Industry Revenue (Million) Forecast, by Application 2019 & 2032
- Table 49: Saudi Arabia IAM Security Services Industry Revenue (Million) Forecast, by Application 2019 & 2032
- Table 50: South Africa IAM Security Services Industry Revenue (Million) Forecast, by Application 2019 & 2032
- Table 51: Rest of Middle East and Africa IAM Security Services Industry Revenue (Million) Forecast, by Application 2019 & 2032
- Table 52: Global IAM Security Services Industry Revenue Million Forecast, by Type of Solutions 2019 & 2032
- Table 53: Global IAM Security Services Industry Revenue Million Forecast, by Type of Deployment 2019 & 2032
- Table 54: Global IAM Security Services Industry Revenue Million Forecast, by Organization Size 2019 & 2032
- Table 55: Global IAM Security Services Industry Revenue Million Forecast, by End-user Vertical 2019 & 2032
- Table 56: Global IAM Security Services Industry Revenue Million Forecast, by Country 2019 & 2032
- Table 57: US IAM Security Services Industry Revenue (Million) Forecast, by Application 2019 & 2032
- Table 58: Canada IAM Security Services Industry Revenue (Million) Forecast, by Application 2019 & 2032
- Table 59: Global IAM Security Services Industry Revenue Million Forecast, by Type of Solutions 2019 & 2032
- Table 60: Global IAM Security Services Industry Revenue Million Forecast, by Type of Deployment 2019 & 2032
- Table 61: Global IAM Security Services Industry Revenue Million Forecast, by Organization Size 2019 & 2032
- Table 62: Global IAM Security Services Industry Revenue Million Forecast, by End-user Vertical 2019 & 2032
- Table 63: Global IAM Security Services Industry Revenue Million Forecast, by Country 2019 & 2032
- Table 64: UK IAM Security Services Industry Revenue (Million) Forecast, by Application 2019 & 2032
- Table 65: Germany IAM Security Services Industry Revenue (Million) Forecast, by Application 2019 & 2032
- Table 66: France IAM Security Services Industry Revenue (Million) Forecast, by Application 2019 & 2032
- Table 67: Rest of Europe IAM Security Services Industry Revenue (Million) Forecast, by Application 2019 & 2032
- Table 68: Global IAM Security Services Industry Revenue Million Forecast, by Type of Solutions 2019 & 2032
- Table 69: Global IAM Security Services Industry Revenue Million Forecast, by Type of Deployment 2019 & 2032
- Table 70: Global IAM Security Services Industry Revenue Million Forecast, by Organization Size 2019 & 2032
- Table 71: Global IAM Security Services Industry Revenue Million Forecast, by End-user Vertical 2019 & 2032
- Table 72: Global IAM Security Services Industry Revenue Million Forecast, by Country 2019 & 2032
- Table 73: China IAM Security Services Industry Revenue (Million) Forecast, by Application 2019 & 2032
- Table 74: Japan IAM Security Services Industry Revenue (Million) Forecast, by Application 2019 & 2032
- Table 75: India IAM Security Services Industry Revenue (Million) Forecast, by Application 2019 & 2032
- Table 76: Rest of Asia Pacific IAM Security Services Industry Revenue (Million) Forecast, by Application 2019 & 2032
- Table 77: Global IAM Security Services Industry Revenue Million Forecast, by Type of Solutions 2019 & 2032
- Table 78: Global IAM Security Services Industry Revenue Million Forecast, by Type of Deployment 2019 & 2032
- Table 79: Global IAM Security Services Industry Revenue Million Forecast, by Organization Size 2019 & 2032
- Table 80: Global IAM Security Services Industry Revenue Million Forecast, by End-user Vertical 2019 & 2032
- Table 81: Global IAM Security Services Industry Revenue Million Forecast, by Country 2019 & 2032
- Table 82: Brazil IAM Security Services Industry Revenue (Million) Forecast, by Application 2019 & 2032
- Table 83: Mexico IAM Security Services Industry Revenue (Million) Forecast, by Application 2019 & 2032
- Table 84: Rest of Latin America IAM Security Services Industry Revenue (Million) Forecast, by Application 2019 & 2032
- Table 85: Global IAM Security Services Industry Revenue Million Forecast, by Type of Solutions 2019 & 2032
- Table 86: Global IAM Security Services Industry Revenue Million Forecast, by Type of Deployment 2019 & 2032
- Table 87: Global IAM Security Services Industry Revenue Million Forecast, by Organization Size 2019 & 2032
- Table 88: Global IAM Security Services Industry Revenue Million Forecast, by End-user Vertical 2019 & 2032
- Table 89: Global IAM Security Services Industry Revenue Million Forecast, by Country 2019 & 2032
- Table 90: Saudi Arabia IAM Security Services Industry Revenue (Million) Forecast, by Application 2019 & 2032
- Table 91: UAE IAM Security Services Industry Revenue (Million) Forecast, by Application 2019 & 2032
- Table 92: Rest of Middle East and Africa IAM Security Services Industry Revenue (Million) Forecast, by Application 2019 & 2032
Frequently Asked Questions
1. What is the projected Compound Annual Growth Rate (CAGR) of the IAM Security Services Industry?
The projected CAGR is approximately 12.31%.
2. Which companies are prominent players in the IAM Security Services Industry?
Key companies in the market include Cyberark Software Ltd, Amazon Web Services, NetIQ Corporation*List Not Exhaustive, IBM Corporation, Sailpoint Technologies Inc, Broadcom Inc, Microsoft Corporation, HID Global Corporation, Oracle Corporation, Centrify Corporation, Okta Inc.
3. What are the main segments of the IAM Security Services Industry?
The market segments include Type of Solutions, Type of Deployment, Organization Size, End-user Vertical.
4. Can you provide details about the market size?
The market size is estimated to be USD 17.05 Million as of 2022.
5. What are some drivers contributing to market growth?
Increasing Security Concerns; Increasing Number of Cyber Data Breaches.
6. What are the notable trends driving market growth?
The IT & Telecom Segment is Expected to Register a Strong Growth.
7. Are there any restraints impacting market growth?
High Costs of Security Solution; Complexity in Integration with Existing Network.
8. Can you provide examples of recent developments in the market?
January 2023: Saviynt, a provider of intelligent identification and access governance solutions, raised USD 205m in growth financing from AB Private Credit Investors' Tech Capital Solutions group.. Saviynt will use this funding to meet the market's growing demand for its converged identity platform and accelerate innovation.
9. What pricing options are available for accessing the report?
Pricing options include single-user, multi-user, and enterprise licenses priced at USD 4750, USD 5250, and USD 8750 respectively.
10. Is the market size provided in terms of value or volume?
The market size is provided in terms of value, measured in Million.
11. Are there any specific market keywords associated with the report?
Yes, the market keyword associated with the report is "IAM Security Services Industry," which aids in identifying and referencing the specific market segment covered.
12. How do I determine which pricing option suits my needs best?
The pricing options vary based on user requirements and access needs. Individual users may opt for single-user licenses, while businesses requiring broader access may choose multi-user or enterprise licenses for cost-effective access to the report.
13. Are there any additional resources or data provided in the IAM Security Services Industry report?
While the report offers comprehensive insights, it's advisable to review the specific contents or supplementary materials provided to ascertain if additional resources or data are available.
14. How can I stay updated on further developments or reports in the IAM Security Services Industry?
To stay informed about further developments, trends, and reports in the IAM Security Services Industry, consider subscribing to industry newsletters, following relevant companies and organizations, or regularly checking reputable industry news sources and publications.
Methodology
Step 1 - Identification of Relevant Samples Size from Population Database


Step 2 - Approaches for Defining Global Market Size (Value, Volume* & Price*)

Note*: In applicable scenarios
Step 3 - Data Sources
Primary Research
- Web Analytics
- Survey Reports
- Research Institute
- Latest Research Reports
- Opinion Leaders
Secondary Research
- Annual Reports
- White Paper
- Latest Press Release
- Industry Association
- Paid Database
- Investor Presentations

Step 4 - Data Triangulation
Involves using different sources of information in order to increase the validity of a study
These sources are likely to be stakeholders in a program - participants, other researchers, program staff, other community members, and so on.
Then we put all data in single framework & apply various statistical tools to find out the dynamic on the market.
During the analysis stage, feedback from the stakeholder groups would be compared to determine areas of agreement as well as areas of divergence
