

Key Insights
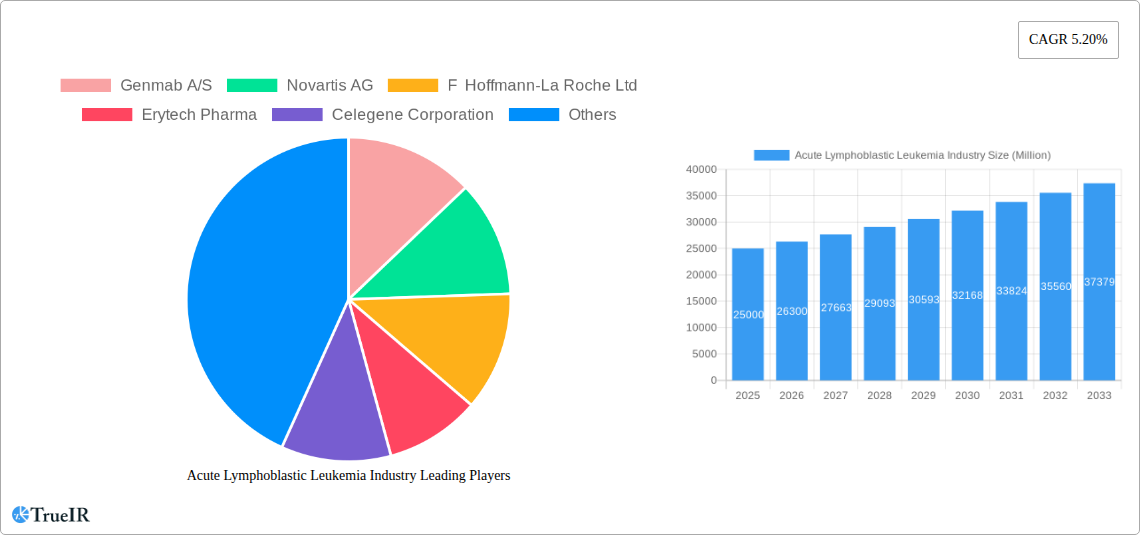
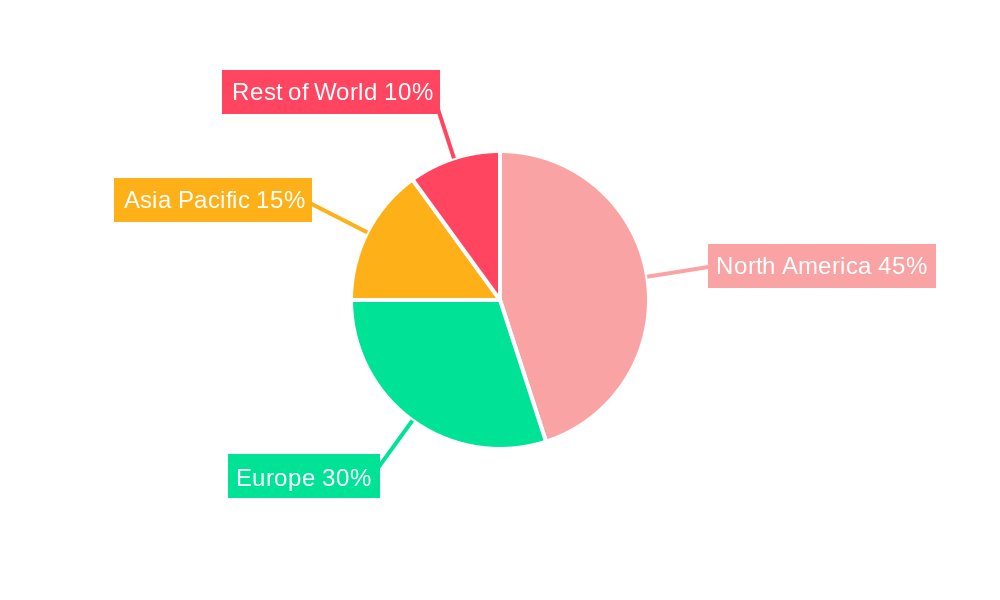
The Acute Lymphoblastic Leukemia (ALL) market, exhibiting a Compound Annual Growth Rate (CAGR) of 5.20% from 2019-2033, presents a significant opportunity for pharmaceutical companies. Driven by an aging global population, increased incidence rates, and advancements in targeted therapies, including immunotherapies and CAR T-cell therapies, the market is experiencing substantial growth. The segmentation by cell type (B-cell ALL, T-cell ALL, Ph+ and Ph- ALL) highlights the complexity of the disease, with differing treatment approaches and varying market sizes for each subtype. Chemotherapy remains a cornerstone of ALL treatment, but the rising adoption of targeted therapies, radiation therapy, and stem cell transplantation reflects a shift towards more personalized and effective treatment strategies. Key players like Genmab A/S, Novartis AG, and Roche are actively involved in research and development, fueling innovation in this space. Geographic variations exist, with North America and Europe currently dominating the market due to higher healthcare expenditure and advanced healthcare infrastructure. However, the Asia-Pacific region is projected to witness significant growth due to rising healthcare awareness and increasing disposable incomes. The market's expansion is, however, constrained by high treatment costs, limited access to advanced therapies in developing countries, and potential side effects associated with certain treatments.
The competitive landscape is highly consolidated, with a few major pharmaceutical companies leading the charge. Successful market players are likely to leverage their strong R&D capabilities to develop novel therapies addressing unmet medical needs. Focusing on personalized medicine and developing effective strategies for patient access and affordability will be crucial for future success. The forecast period (2025-2033) promises continued market expansion, driven by ongoing research, improved treatment outcomes, and increased patient awareness. The potential for future growth is particularly strong in the emerging markets of Asia and Latin America, where increased investment in healthcare infrastructure and improved access to advanced treatments could significantly expand market reach. Market expansion will depend on continued breakthroughs in research and the effective translation of scientific advances into accessible and affordable treatments.
Acute Lymphoblastic Leukemia (ALL) Industry Report: 2019-2033 Forecast
This comprehensive report provides a detailed analysis of the Acute Lymphoblastic Leukemia (ALL) industry, offering invaluable insights for stakeholders, investors, and researchers. Covering the period from 2019 to 2033, with a focus on 2025, this report delves into market size, segmentation, competitive landscape, and future trends. The study incorporates historical data (2019-2024), current estimates (2025), and future forecasts (2025-2033), providing a holistic view of this critical area of the healthcare industry. High-volume keywords like "Acute Lymphoblastic Leukemia," "ALL Treatment Market," "ALL Therapeutics," "Chemotherapy for ALL," "Targeted Therapy ALL," and "ALL Market Size" are strategically integrated throughout to optimize search engine visibility.
Acute Lymphoblastic Leukemia Industry Market Structure & Competitive Landscape
The ALL industry exhibits a moderately concentrated market structure, with several large pharmaceutical companies dominating the landscape. The Herfindahl-Hirschman Index (HHI) is estimated to be xx in 2025, indicating a relatively consolidated market. Key innovation drivers include advancements in targeted therapies, immunotherapies, and cell-based therapies. Regulatory approvals play a significant role, with stringent requirements impacting market entry and product lifecycles. Product substitutes, while limited, include alternative treatment approaches like stem cell transplantation and radiation therapy. End-user segmentation includes hospitals, specialized cancer centers, and clinics.
Significant M&A activity has been observed in the recent past, with xx deals valued at approximately $xx Million recorded between 2019 and 2024. This trend is expected to continue, driven by the need for companies to expand their product portfolios and gain access to new technologies.
- Market Concentration: HHI estimated at xx in 2025.
- Innovation Drivers: Targeted therapies, immunotherapies, cell-based therapies.
- Regulatory Impacts: Stringent approvals impact market entry and product lifecycles.
- Product Substitutes: Stem cell transplantation, radiation therapy.
- M&A Trends: xx deals totaling approximately $xx Million (2019-2024).
Acute Lymphoblastic Leukemia Industry Market Trends & Opportunities
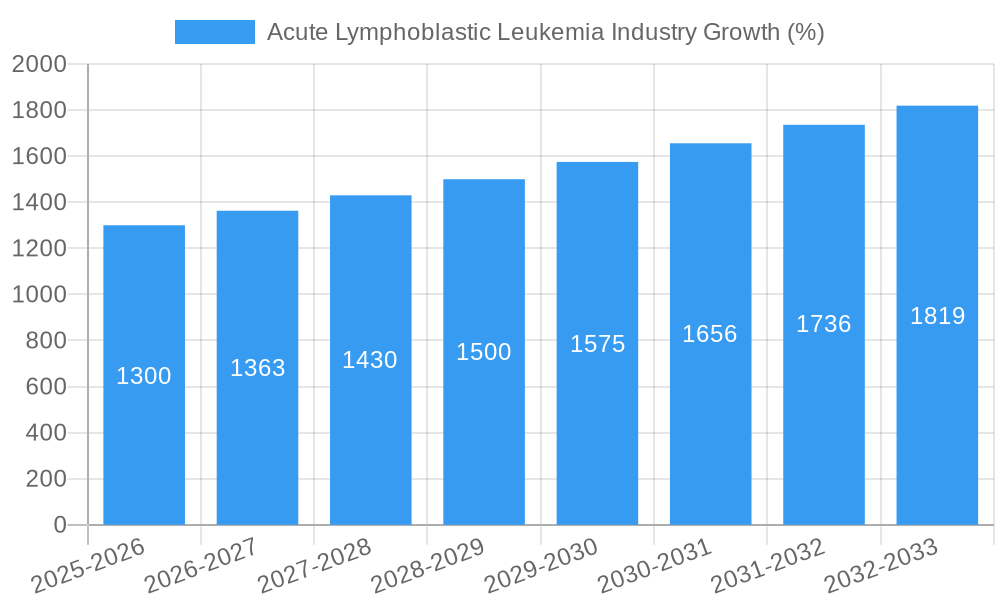
The global ALL market is experiencing significant growth, driven by increasing prevalence of the disease, rising healthcare expenditure, and advancements in treatment modalities. The market size is projected to reach $xx Million in 2025, exhibiting a Compound Annual Growth Rate (CAGR) of xx% during the forecast period (2025-2033). Technological advancements, particularly in personalized medicine and targeted therapies, are reshaping treatment paradigms. Consumer preferences are increasingly shifting towards less toxic and more effective treatment options with improved quality of life. Competitive dynamics are characterized by intense R&D efforts, strategic partnerships, and a focus on expanding geographical reach. Market penetration rates for novel therapies are expected to increase significantly, driven by robust clinical trial data and favorable regulatory outcomes.
Dominant Markets & Segments in Acute Lymphoblastic Leukemia Industry
The North American market currently holds the largest share of the global ALL market, driven by high healthcare expenditure, well-established healthcare infrastructure, and a substantial patient pool. Within the treatment segments, Targeted Therapy is experiencing the fastest growth, driven by its efficacy and targeted nature. The B-cell ALL segment dominates the type of cell classification, given its higher prevalence. The Ph+ ALL segment commands a significant market share within Philadelphia Chromosome classification, primarily due to the availability of targeted therapies. Chemotherapy remains the mainstay of treatment, but its dominance is expected to gradually decrease as more targeted therapies gain traction.
- Key Growth Drivers (North America): Robust healthcare infrastructure, high healthcare expenditure, substantial patient population.
- Fastest-Growing Segment: Targeted Therapy (Other Types of Therapies)
- Dominant Segment (By Type of Cell): B-cell ALL
- Significant Segment (Philadelphia Chromosome): Ph+ ALL
- Primary Treatment Modality: Chemotherapy
Acute Lymphoblastic Leukemia Industry Product Analysis
The ALL therapeutic landscape is rapidly evolving, with ongoing innovation in targeted therapies, immunotherapies, and CAR T-cell therapies. These advancements offer improved efficacy, reduced toxicity, and enhanced patient outcomes. The market is witnessing a shift from traditional chemotherapy regimens toward personalized treatment approaches tailored to specific genetic subtypes of ALL. The competitive advantage lies in developing innovative therapies with superior efficacy, safety profiles, and convenience.
Key Drivers, Barriers & Challenges in Acute Lymploblastic Leukemia Industry
Key Drivers:
- Technological advancements in targeted therapy and immunotherapy.
- Increasing prevalence of ALL and improved diagnostics.
- Growing healthcare expenditure and insurance coverage.
Challenges:
- High cost of novel therapies limiting accessibility.
- Complex regulatory pathways and lengthy approval processes impacting market entry.
- Intense competition among pharmaceutical companies. This can lead to price wars and pressure on profit margins. The impact is estimated at approximately a xx% reduction in average selling prices across the market.
Growth Drivers in the Acute Lymphoblastic Leukemia Industry Market
Technological advancements in targeted therapies, coupled with increasing investment in R&D and favorable regulatory landscapes, are driving significant growth in the ALL market. The rising prevalence of ALL, alongside improved diagnostics and greater awareness, further contributes to this expansion. Lastly, increasing healthcare expenditure and broader insurance coverage make innovative treatment options accessible to a larger patient population.
Challenges Impacting Acute Lymphoblastic Leukemia Industry Growth
High drug prices and limited reimbursement coverage create significant barriers to accessing life-saving treatments. The complex regulatory landscape and lengthy approval processes delay the introduction of new therapies into the market. Furthermore, the intense competition among pharmaceutical companies can lead to price pressures and reduced profitability for some players.
Key Players Shaping the Acute Lymphoblastic Leukemia Industry Market
- Genmab A/S
- Novartis AG
- F Hoffmann-La Roche Ltd
- Erytech Pharma
- Celegene Corporation
- Bristol Myer Squibb Company
- Sanofi SA
- Eisai Co Ltd
- GlaxoSmithKline PLC
- Pfizer Inc
Significant Acute Lymphoblastic Leukemia Industry Milestones
- 2020: FDA approval of a novel targeted therapy for Ph+ ALL.
- 2022: Launch of a large-scale clinical trial evaluating a new CAR T-cell therapy.
- 2023: Acquisition of a smaller biotech company specializing in ALL research by a major pharmaceutical firm.
- 2024: Publication of landmark clinical trial results demonstrating improved survival rates with a novel treatment regimen.
Future Outlook for Acute Lymphoblastic Leukemia Industry Market
The ALL market is poised for sustained growth, driven by ongoing innovation in targeted therapies, immunotherapies, and cell-based therapies. The development and launch of novel therapies offer promising treatment options with enhanced efficacy and safety profiles. This expansion presents significant strategic opportunities for pharmaceutical companies and investors, with immense market potential over the forecast period.
Acute Lymphoblastic Leukemia Industry Segmentation
-
1. Type of Cell
- 1.1. B-cell ALL
- 1.2. T-cell ALL
- 1.3. Philadel
-
2. Type of Therapy
-
2.1. Chemotherapy
- 2.1.1. Hyper - CVAD Regimen
- 2.1.2. CALGB 8811 Regimen
- 2.1.3. Linker Regimen
- 2.1.4. Nucleoside Inhibitors
- 2.1.5. Other Types of Therapies
- 2.2. Targeted Therapy
- 2.3. Radiation Therapy
- 2.4. Stem Cell Transplantation
-
2.1. Chemotherapy
Acute Lymphoblastic Leukemia Industry Segmentation By Geography
-
1. North America
- 1.1. United States
- 1.2. Canada
- 1.3. Mexico
-
2. Europe
- 2.1. Germany
- 2.2. United Kingdom
- 2.3. France
- 2.4. Italy
- 2.5. Spain
- 2.6. Rest of Europe
-
3. Asia Pacific
- 3.1. China
- 3.2. Japan
- 3.3. India
- 3.4. Australia
- 3.5. South Korea
- 3.6. Rest of Asia Pacific
- 4. Middle East
-
5. GCC
- 5.1. South Africa
- 5.2. Rest of Middle East
-
6. South America
- 6.1. Brazil
- 6.2. Argentina
- 6.3. Rest of South America
Acute Lymphoblastic Leukemia Industry REPORT HIGHLIGHTS
| Aspects | Details |
|---|---|
| Study Period | 2019-2033 |
| Base Year | 2024 |
| Estimated Year | 2025 |
| Forecast Period | 2025-2033 |
| Historical Period | 2019-2024 |
| Growth Rate | CAGR of 5.20% from 2019-2033 |
| Segmentation |
|
Table of Contents
- 1. Introduction
- 1.1. Research Scope
- 1.2. Market Segmentation
- 1.3. Research Methodology
- 1.4. Definitions and Assumptions
- 2. Executive Summary
- 2.1. Introduction
- 3. Market Dynamics
- 3.1. Introduction
- 3.2. Market Drivers
- 3.2.1. ; Rise in the Incidences of Acute Lymphoblastic Leukemia; Increasing Initiatives Taken by the Government and Private Organizations
- 3.3. Market Restrains
- 3.3.1. ; Stringent Regulatory Pathways; High Cost Asscoiated with the Treatment
- 3.4. Market Trends
- 3.4.1. Chemotherapy is Expected to Dominate the Type of Therapy Segment
- 4. Market Factor Analysis
- 4.1. Porters Five Forces
- 4.2. Supply/Value Chain
- 4.3. PESTEL analysis
- 4.4. Market Entropy
- 4.5. Patent/Trademark Analysis
- 5. Global Acute Lymphoblastic Leukemia Industry Analysis, Insights and Forecast, 2019-2031
- 5.1. Market Analysis, Insights and Forecast - by Type of Cell
- 5.1.1. B-cell ALL
- 5.1.2. T-cell ALL
- 5.1.3. Philadel
- 5.2. Market Analysis, Insights and Forecast - by Type of Therapy
- 5.2.1. Chemotherapy
- 5.2.1.1. Hyper - CVAD Regimen
- 5.2.1.2. CALGB 8811 Regimen
- 5.2.1.3. Linker Regimen
- 5.2.1.4. Nucleoside Inhibitors
- 5.2.1.5. Other Types of Therapies
- 5.2.2. Targeted Therapy
- 5.2.3. Radiation Therapy
- 5.2.4. Stem Cell Transplantation
- 5.2.1. Chemotherapy
- 5.3. Market Analysis, Insights and Forecast - by Region
- 5.3.1. North America
- 5.3.2. Europe
- 5.3.3. Asia Pacific
- 5.3.4. Middle East
- 5.3.5. GCC
- 5.3.6. South America
- 5.1. Market Analysis, Insights and Forecast - by Type of Cell
- 6. North America Acute Lymphoblastic Leukemia Industry Analysis, Insights and Forecast, 2019-2031
- 6.1. Market Analysis, Insights and Forecast - by Type of Cell
- 6.1.1. B-cell ALL
- 6.1.2. T-cell ALL
- 6.1.3. Philadel
- 6.2. Market Analysis, Insights and Forecast - by Type of Therapy
- 6.2.1. Chemotherapy
- 6.2.1.1. Hyper - CVAD Regimen
- 6.2.1.2. CALGB 8811 Regimen
- 6.2.1.3. Linker Regimen
- 6.2.1.4. Nucleoside Inhibitors
- 6.2.1.5. Other Types of Therapies
- 6.2.2. Targeted Therapy
- 6.2.3. Radiation Therapy
- 6.2.4. Stem Cell Transplantation
- 6.2.1. Chemotherapy
- 6.1. Market Analysis, Insights and Forecast - by Type of Cell
- 7. Europe Acute Lymphoblastic Leukemia Industry Analysis, Insights and Forecast, 2019-2031
- 7.1. Market Analysis, Insights and Forecast - by Type of Cell
- 7.1.1. B-cell ALL
- 7.1.2. T-cell ALL
- 7.1.3. Philadel
- 7.2. Market Analysis, Insights and Forecast - by Type of Therapy
- 7.2.1. Chemotherapy
- 7.2.1.1. Hyper - CVAD Regimen
- 7.2.1.2. CALGB 8811 Regimen
- 7.2.1.3. Linker Regimen
- 7.2.1.4. Nucleoside Inhibitors
- 7.2.1.5. Other Types of Therapies
- 7.2.2. Targeted Therapy
- 7.2.3. Radiation Therapy
- 7.2.4. Stem Cell Transplantation
- 7.2.1. Chemotherapy
- 7.1. Market Analysis, Insights and Forecast - by Type of Cell
- 8. Asia Pacific Acute Lymphoblastic Leukemia Industry Analysis, Insights and Forecast, 2019-2031
- 8.1. Market Analysis, Insights and Forecast - by Type of Cell
- 8.1.1. B-cell ALL
- 8.1.2. T-cell ALL
- 8.1.3. Philadel
- 8.2. Market Analysis, Insights and Forecast - by Type of Therapy
- 8.2.1. Chemotherapy
- 8.2.1.1. Hyper - CVAD Regimen
- 8.2.1.2. CALGB 8811 Regimen
- 8.2.1.3. Linker Regimen
- 8.2.1.4. Nucleoside Inhibitors
- 8.2.1.5. Other Types of Therapies
- 8.2.2. Targeted Therapy
- 8.2.3. Radiation Therapy
- 8.2.4. Stem Cell Transplantation
- 8.2.1. Chemotherapy
- 8.1. Market Analysis, Insights and Forecast - by Type of Cell
- 9. Middle East Acute Lymphoblastic Leukemia Industry Analysis, Insights and Forecast, 2019-2031
- 9.1. Market Analysis, Insights and Forecast - by Type of Cell
- 9.1.1. B-cell ALL
- 9.1.2. T-cell ALL
- 9.1.3. Philadel
- 9.2. Market Analysis, Insights and Forecast - by Type of Therapy
- 9.2.1. Chemotherapy
- 9.2.1.1. Hyper - CVAD Regimen
- 9.2.1.2. CALGB 8811 Regimen
- 9.2.1.3. Linker Regimen
- 9.2.1.4. Nucleoside Inhibitors
- 9.2.1.5. Other Types of Therapies
- 9.2.2. Targeted Therapy
- 9.2.3. Radiation Therapy
- 9.2.4. Stem Cell Transplantation
- 9.2.1. Chemotherapy
- 9.1. Market Analysis, Insights and Forecast - by Type of Cell
- 10. GCC Acute Lymphoblastic Leukemia Industry Analysis, Insights and Forecast, 2019-2031
- 10.1. Market Analysis, Insights and Forecast - by Type of Cell
- 10.1.1. B-cell ALL
- 10.1.2. T-cell ALL
- 10.1.3. Philadel
- 10.2. Market Analysis, Insights and Forecast - by Type of Therapy
- 10.2.1. Chemotherapy
- 10.2.1.1. Hyper - CVAD Regimen
- 10.2.1.2. CALGB 8811 Regimen
- 10.2.1.3. Linker Regimen
- 10.2.1.4. Nucleoside Inhibitors
- 10.2.1.5. Other Types of Therapies
- 10.2.2. Targeted Therapy
- 10.2.3. Radiation Therapy
- 10.2.4. Stem Cell Transplantation
- 10.2.1. Chemotherapy
- 10.1. Market Analysis, Insights and Forecast - by Type of Cell
- 11. South America Acute Lymphoblastic Leukemia Industry Analysis, Insights and Forecast, 2019-2031
- 11.1. Market Analysis, Insights and Forecast - by Type of Cell
- 11.1.1. B-cell ALL
- 11.1.2. T-cell ALL
- 11.1.3. Philadel
- 11.2. Market Analysis, Insights and Forecast - by Type of Therapy
- 11.2.1. Chemotherapy
- 11.2.1.1. Hyper - CVAD Regimen
- 11.2.1.2. CALGB 8811 Regimen
- 11.2.1.3. Linker Regimen
- 11.2.1.4. Nucleoside Inhibitors
- 11.2.1.5. Other Types of Therapies
- 11.2.2. Targeted Therapy
- 11.2.3. Radiation Therapy
- 11.2.4. Stem Cell Transplantation
- 11.2.1. Chemotherapy
- 11.1. Market Analysis, Insights and Forecast - by Type of Cell
- 12. North America Acute Lymphoblastic Leukemia Industry Analysis, Insights and Forecast, 2019-2031
- 12.1. Market Analysis, Insights and Forecast - By Country/Sub-region
- 12.1.1 United States
- 12.1.2 Canada
- 12.1.3 Mexico
- 13. Europe Acute Lymphoblastic Leukemia Industry Analysis, Insights and Forecast, 2019-2031
- 13.1. Market Analysis, Insights and Forecast - By Country/Sub-region
- 13.1.1 Germany
- 13.1.2 United Kingdom
- 13.1.3 France
- 13.1.4 Italy
- 13.1.5 Spain
- 13.1.6 Rest of Europe
- 14. Asia Pacific Acute Lymphoblastic Leukemia Industry Analysis, Insights and Forecast, 2019-2031
- 14.1. Market Analysis, Insights and Forecast - By Country/Sub-region
- 14.1.1 China
- 14.1.2 Japan
- 14.1.3 India
- 14.1.4 Australia
- 14.1.5 South Korea
- 14.1.6 Rest of Asia Pacific
- 15. Middle East Acute Lymphoblastic Leukemia Industry Analysis, Insights and Forecast, 2019-2031
- 15.1. Market Analysis, Insights and Forecast - By Country/Sub-region
- 15.1.1.
- 16. GCC Acute Lymphoblastic Leukemia Industry Analysis, Insights and Forecast, 2019-2031
- 16.1. Market Analysis, Insights and Forecast - By Country/Sub-region
- 16.1.1 South Africa
- 16.1.2 Rest of Middle East
- 17. South America Acute Lymphoblastic Leukemia Industry Analysis, Insights and Forecast, 2019-2031
- 17.1. Market Analysis, Insights and Forecast - By Country/Sub-region
- 17.1.1 Brazil
- 17.1.2 Argentina
- 17.1.3 Rest of South America
- 18. Competitive Analysis
- 18.1. Global Market Share Analysis 2024
- 18.2. Company Profiles
- 18.2.1 Genmab A/S
- 18.2.1.1. Overview
- 18.2.1.2. Products
- 18.2.1.3. SWOT Analysis
- 18.2.1.4. Recent Developments
- 18.2.1.5. Financials (Based on Availability)
- 18.2.2 Novartis AG
- 18.2.2.1. Overview
- 18.2.2.2. Products
- 18.2.2.3. SWOT Analysis
- 18.2.2.4. Recent Developments
- 18.2.2.5. Financials (Based on Availability)
- 18.2.3 F Hoffmann-La Roche Ltd
- 18.2.3.1. Overview
- 18.2.3.2. Products
- 18.2.3.3. SWOT Analysis
- 18.2.3.4. Recent Developments
- 18.2.3.5. Financials (Based on Availability)
- 18.2.4 Erytech Pharma
- 18.2.4.1. Overview
- 18.2.4.2. Products
- 18.2.4.3. SWOT Analysis
- 18.2.4.4. Recent Developments
- 18.2.4.5. Financials (Based on Availability)
- 18.2.5 Celegene Corporation
- 18.2.5.1. Overview
- 18.2.5.2. Products
- 18.2.5.3. SWOT Analysis
- 18.2.5.4. Recent Developments
- 18.2.5.5. Financials (Based on Availability)
- 18.2.6 Bristol Myer Squibb Company
- 18.2.6.1. Overview
- 18.2.6.2. Products
- 18.2.6.3. SWOT Analysis
- 18.2.6.4. Recent Developments
- 18.2.6.5. Financials (Based on Availability)
- 18.2.7 Sanofi SA*List Not Exhaustive
- 18.2.7.1. Overview
- 18.2.7.2. Products
- 18.2.7.3. SWOT Analysis
- 18.2.7.4. Recent Developments
- 18.2.7.5. Financials (Based on Availability)
- 18.2.8 Eisai Co Ltd
- 18.2.8.1. Overview
- 18.2.8.2. Products
- 18.2.8.3. SWOT Analysis
- 18.2.8.4. Recent Developments
- 18.2.8.5. Financials (Based on Availability)
- 18.2.9 GlaxoSmithKline PLC
- 18.2.9.1. Overview
- 18.2.9.2. Products
- 18.2.9.3. SWOT Analysis
- 18.2.9.4. Recent Developments
- 18.2.9.5. Financials (Based on Availability)
- 18.2.10 Pfizer Inc
- 18.2.10.1. Overview
- 18.2.10.2. Products
- 18.2.10.3. SWOT Analysis
- 18.2.10.4. Recent Developments
- 18.2.10.5. Financials (Based on Availability)
- 18.2.1 Genmab A/S
List of Figures
- Figure 1: Global Acute Lymphoblastic Leukemia Industry Revenue Breakdown (Million, %) by Region 2024 & 2032
- Figure 2: North America Acute Lymphoblastic Leukemia Industry Revenue (Million), by Country 2024 & 2032
- Figure 3: North America Acute Lymphoblastic Leukemia Industry Revenue Share (%), by Country 2024 & 2032
- Figure 4: Europe Acute Lymphoblastic Leukemia Industry Revenue (Million), by Country 2024 & 2032
- Figure 5: Europe Acute Lymphoblastic Leukemia Industry Revenue Share (%), by Country 2024 & 2032
- Figure 6: Asia Pacific Acute Lymphoblastic Leukemia Industry Revenue (Million), by Country 2024 & 2032
- Figure 7: Asia Pacific Acute Lymphoblastic Leukemia Industry Revenue Share (%), by Country 2024 & 2032
- Figure 8: Middle East Acute Lymphoblastic Leukemia Industry Revenue (Million), by Country 2024 & 2032
- Figure 9: Middle East Acute Lymphoblastic Leukemia Industry Revenue Share (%), by Country 2024 & 2032
- Figure 10: GCC Acute Lymphoblastic Leukemia Industry Revenue (Million), by Country 2024 & 2032
- Figure 11: GCC Acute Lymphoblastic Leukemia Industry Revenue Share (%), by Country 2024 & 2032
- Figure 12: South America Acute Lymphoblastic Leukemia Industry Revenue (Million), by Country 2024 & 2032
- Figure 13: South America Acute Lymphoblastic Leukemia Industry Revenue Share (%), by Country 2024 & 2032
- Figure 14: North America Acute Lymphoblastic Leukemia Industry Revenue (Million), by Type of Cell 2024 & 2032
- Figure 15: North America Acute Lymphoblastic Leukemia Industry Revenue Share (%), by Type of Cell 2024 & 2032
- Figure 16: North America Acute Lymphoblastic Leukemia Industry Revenue (Million), by Type of Therapy 2024 & 2032
- Figure 17: North America Acute Lymphoblastic Leukemia Industry Revenue Share (%), by Type of Therapy 2024 & 2032
- Figure 18: North America Acute Lymphoblastic Leukemia Industry Revenue (Million), by Country 2024 & 2032
- Figure 19: North America Acute Lymphoblastic Leukemia Industry Revenue Share (%), by Country 2024 & 2032
- Figure 20: Europe Acute Lymphoblastic Leukemia Industry Revenue (Million), by Type of Cell 2024 & 2032
- Figure 21: Europe Acute Lymphoblastic Leukemia Industry Revenue Share (%), by Type of Cell 2024 & 2032
- Figure 22: Europe Acute Lymphoblastic Leukemia Industry Revenue (Million), by Type of Therapy 2024 & 2032
- Figure 23: Europe Acute Lymphoblastic Leukemia Industry Revenue Share (%), by Type of Therapy 2024 & 2032
- Figure 24: Europe Acute Lymphoblastic Leukemia Industry Revenue (Million), by Country 2024 & 2032
- Figure 25: Europe Acute Lymphoblastic Leukemia Industry Revenue Share (%), by Country 2024 & 2032
- Figure 26: Asia Pacific Acute Lymphoblastic Leukemia Industry Revenue (Million), by Type of Cell 2024 & 2032
- Figure 27: Asia Pacific Acute Lymphoblastic Leukemia Industry Revenue Share (%), by Type of Cell 2024 & 2032
- Figure 28: Asia Pacific Acute Lymphoblastic Leukemia Industry Revenue (Million), by Type of Therapy 2024 & 2032
- Figure 29: Asia Pacific Acute Lymphoblastic Leukemia Industry Revenue Share (%), by Type of Therapy 2024 & 2032
- Figure 30: Asia Pacific Acute Lymphoblastic Leukemia Industry Revenue (Million), by Country 2024 & 2032
- Figure 31: Asia Pacific Acute Lymphoblastic Leukemia Industry Revenue Share (%), by Country 2024 & 2032
- Figure 32: Middle East Acute Lymphoblastic Leukemia Industry Revenue (Million), by Type of Cell 2024 & 2032
- Figure 33: Middle East Acute Lymphoblastic Leukemia Industry Revenue Share (%), by Type of Cell 2024 & 2032
- Figure 34: Middle East Acute Lymphoblastic Leukemia Industry Revenue (Million), by Type of Therapy 2024 & 2032
- Figure 35: Middle East Acute Lymphoblastic Leukemia Industry Revenue Share (%), by Type of Therapy 2024 & 2032
- Figure 36: Middle East Acute Lymphoblastic Leukemia Industry Revenue (Million), by Country 2024 & 2032
- Figure 37: Middle East Acute Lymphoblastic Leukemia Industry Revenue Share (%), by Country 2024 & 2032
- Figure 38: GCC Acute Lymphoblastic Leukemia Industry Revenue (Million), by Type of Cell 2024 & 2032
- Figure 39: GCC Acute Lymphoblastic Leukemia Industry Revenue Share (%), by Type of Cell 2024 & 2032
- Figure 40: GCC Acute Lymphoblastic Leukemia Industry Revenue (Million), by Type of Therapy 2024 & 2032
- Figure 41: GCC Acute Lymphoblastic Leukemia Industry Revenue Share (%), by Type of Therapy 2024 & 2032
- Figure 42: GCC Acute Lymphoblastic Leukemia Industry Revenue (Million), by Country 2024 & 2032
- Figure 43: GCC Acute Lymphoblastic Leukemia Industry Revenue Share (%), by Country 2024 & 2032
- Figure 44: South America Acute Lymphoblastic Leukemia Industry Revenue (Million), by Type of Cell 2024 & 2032
- Figure 45: South America Acute Lymphoblastic Leukemia Industry Revenue Share (%), by Type of Cell 2024 & 2032
- Figure 46: South America Acute Lymphoblastic Leukemia Industry Revenue (Million), by Type of Therapy 2024 & 2032
- Figure 47: South America Acute Lymphoblastic Leukemia Industry Revenue Share (%), by Type of Therapy 2024 & 2032
- Figure 48: South America Acute Lymphoblastic Leukemia Industry Revenue (Million), by Country 2024 & 2032
- Figure 49: South America Acute Lymphoblastic Leukemia Industry Revenue Share (%), by Country 2024 & 2032
List of Tables
- Table 1: Global Acute Lymphoblastic Leukemia Industry Revenue Million Forecast, by Region 2019 & 2032
- Table 2: Global Acute Lymphoblastic Leukemia Industry Revenue Million Forecast, by Type of Cell 2019 & 2032
- Table 3: Global Acute Lymphoblastic Leukemia Industry Revenue Million Forecast, by Type of Therapy 2019 & 2032
- Table 4: Global Acute Lymphoblastic Leukemia Industry Revenue Million Forecast, by Region 2019 & 2032
- Table 5: Global Acute Lymphoblastic Leukemia Industry Revenue Million Forecast, by Country 2019 & 2032
- Table 6: United States Acute Lymphoblastic Leukemia Industry Revenue (Million) Forecast, by Application 2019 & 2032
- Table 7: Canada Acute Lymphoblastic Leukemia Industry Revenue (Million) Forecast, by Application 2019 & 2032
- Table 8: Mexico Acute Lymphoblastic Leukemia Industry Revenue (Million) Forecast, by Application 2019 & 2032
- Table 9: Global Acute Lymphoblastic Leukemia Industry Revenue Million Forecast, by Country 2019 & 2032
- Table 10: Germany Acute Lymphoblastic Leukemia Industry Revenue (Million) Forecast, by Application 2019 & 2032
- Table 11: United Kingdom Acute Lymphoblastic Leukemia Industry Revenue (Million) Forecast, by Application 2019 & 2032
- Table 12: France Acute Lymphoblastic Leukemia Industry Revenue (Million) Forecast, by Application 2019 & 2032
- Table 13: Italy Acute Lymphoblastic Leukemia Industry Revenue (Million) Forecast, by Application 2019 & 2032
- Table 14: Spain Acute Lymphoblastic Leukemia Industry Revenue (Million) Forecast, by Application 2019 & 2032
- Table 15: Rest of Europe Acute Lymphoblastic Leukemia Industry Revenue (Million) Forecast, by Application 2019 & 2032
- Table 16: Global Acute Lymphoblastic Leukemia Industry Revenue Million Forecast, by Country 2019 & 2032
- Table 17: China Acute Lymphoblastic Leukemia Industry Revenue (Million) Forecast, by Application 2019 & 2032
- Table 18: Japan Acute Lymphoblastic Leukemia Industry Revenue (Million) Forecast, by Application 2019 & 2032
- Table 19: India Acute Lymphoblastic Leukemia Industry Revenue (Million) Forecast, by Application 2019 & 2032
- Table 20: Australia Acute Lymphoblastic Leukemia Industry Revenue (Million) Forecast, by Application 2019 & 2032
- Table 21: South Korea Acute Lymphoblastic Leukemia Industry Revenue (Million) Forecast, by Application 2019 & 2032
- Table 22: Rest of Asia Pacific Acute Lymphoblastic Leukemia Industry Revenue (Million) Forecast, by Application 2019 & 2032
- Table 23: Global Acute Lymphoblastic Leukemia Industry Revenue Million Forecast, by Country 2019 & 2032
- Table 24: Acute Lymphoblastic Leukemia Industry Revenue (Million) Forecast, by Application 2019 & 2032
- Table 25: Global Acute Lymphoblastic Leukemia Industry Revenue Million Forecast, by Country 2019 & 2032
- Table 26: South Africa Acute Lymphoblastic Leukemia Industry Revenue (Million) Forecast, by Application 2019 & 2032
- Table 27: Rest of Middle East Acute Lymphoblastic Leukemia Industry Revenue (Million) Forecast, by Application 2019 & 2032
- Table 28: Global Acute Lymphoblastic Leukemia Industry Revenue Million Forecast, by Country 2019 & 2032
- Table 29: Brazil Acute Lymphoblastic Leukemia Industry Revenue (Million) Forecast, by Application 2019 & 2032
- Table 30: Argentina Acute Lymphoblastic Leukemia Industry Revenue (Million) Forecast, by Application 2019 & 2032
- Table 31: Rest of South America Acute Lymphoblastic Leukemia Industry Revenue (Million) Forecast, by Application 2019 & 2032
- Table 32: Global Acute Lymphoblastic Leukemia Industry Revenue Million Forecast, by Type of Cell 2019 & 2032
- Table 33: Global Acute Lymphoblastic Leukemia Industry Revenue Million Forecast, by Type of Therapy 2019 & 2032
- Table 34: Global Acute Lymphoblastic Leukemia Industry Revenue Million Forecast, by Country 2019 & 2032
- Table 35: United States Acute Lymphoblastic Leukemia Industry Revenue (Million) Forecast, by Application 2019 & 2032
- Table 36: Canada Acute Lymphoblastic Leukemia Industry Revenue (Million) Forecast, by Application 2019 & 2032
- Table 37: Mexico Acute Lymphoblastic Leukemia Industry Revenue (Million) Forecast, by Application 2019 & 2032
- Table 38: Global Acute Lymphoblastic Leukemia Industry Revenue Million Forecast, by Type of Cell 2019 & 2032
- Table 39: Global Acute Lymphoblastic Leukemia Industry Revenue Million Forecast, by Type of Therapy 2019 & 2032
- Table 40: Global Acute Lymphoblastic Leukemia Industry Revenue Million Forecast, by Country 2019 & 2032
- Table 41: Germany Acute Lymphoblastic Leukemia Industry Revenue (Million) Forecast, by Application 2019 & 2032
- Table 42: United Kingdom Acute Lymphoblastic Leukemia Industry Revenue (Million) Forecast, by Application 2019 & 2032
- Table 43: France Acute Lymphoblastic Leukemia Industry Revenue (Million) Forecast, by Application 2019 & 2032
- Table 44: Italy Acute Lymphoblastic Leukemia Industry Revenue (Million) Forecast, by Application 2019 & 2032
- Table 45: Spain Acute Lymphoblastic Leukemia Industry Revenue (Million) Forecast, by Application 2019 & 2032
- Table 46: Rest of Europe Acute Lymphoblastic Leukemia Industry Revenue (Million) Forecast, by Application 2019 & 2032
- Table 47: Global Acute Lymphoblastic Leukemia Industry Revenue Million Forecast, by Type of Cell 2019 & 2032
- Table 48: Global Acute Lymphoblastic Leukemia Industry Revenue Million Forecast, by Type of Therapy 2019 & 2032
- Table 49: Global Acute Lymphoblastic Leukemia Industry Revenue Million Forecast, by Country 2019 & 2032
- Table 50: China Acute Lymphoblastic Leukemia Industry Revenue (Million) Forecast, by Application 2019 & 2032
- Table 51: Japan Acute Lymphoblastic Leukemia Industry Revenue (Million) Forecast, by Application 2019 & 2032
- Table 52: India Acute Lymphoblastic Leukemia Industry Revenue (Million) Forecast, by Application 2019 & 2032
- Table 53: Australia Acute Lymphoblastic Leukemia Industry Revenue (Million) Forecast, by Application 2019 & 2032
- Table 54: South Korea Acute Lymphoblastic Leukemia Industry Revenue (Million) Forecast, by Application 2019 & 2032
- Table 55: Rest of Asia Pacific Acute Lymphoblastic Leukemia Industry Revenue (Million) Forecast, by Application 2019 & 2032
- Table 56: Global Acute Lymphoblastic Leukemia Industry Revenue Million Forecast, by Type of Cell 2019 & 2032
- Table 57: Global Acute Lymphoblastic Leukemia Industry Revenue Million Forecast, by Type of Therapy 2019 & 2032
- Table 58: Global Acute Lymphoblastic Leukemia Industry Revenue Million Forecast, by Country 2019 & 2032
- Table 59: Global Acute Lymphoblastic Leukemia Industry Revenue Million Forecast, by Type of Cell 2019 & 2032
- Table 60: Global Acute Lymphoblastic Leukemia Industry Revenue Million Forecast, by Type of Therapy 2019 & 2032
- Table 61: Global Acute Lymphoblastic Leukemia Industry Revenue Million Forecast, by Country 2019 & 2032
- Table 62: South Africa Acute Lymphoblastic Leukemia Industry Revenue (Million) Forecast, by Application 2019 & 2032
- Table 63: Rest of Middle East Acute Lymphoblastic Leukemia Industry Revenue (Million) Forecast, by Application 2019 & 2032
- Table 64: Global Acute Lymphoblastic Leukemia Industry Revenue Million Forecast, by Type of Cell 2019 & 2032
- Table 65: Global Acute Lymphoblastic Leukemia Industry Revenue Million Forecast, by Type of Therapy 2019 & 2032
- Table 66: Global Acute Lymphoblastic Leukemia Industry Revenue Million Forecast, by Country 2019 & 2032
- Table 67: Brazil Acute Lymphoblastic Leukemia Industry Revenue (Million) Forecast, by Application 2019 & 2032
- Table 68: Argentina Acute Lymphoblastic Leukemia Industry Revenue (Million) Forecast, by Application 2019 & 2032
- Table 69: Rest of South America Acute Lymphoblastic Leukemia Industry Revenue (Million) Forecast, by Application 2019 & 2032
Frequently Asked Questions
1. What is the projected Compound Annual Growth Rate (CAGR) of the Acute Lymphoblastic Leukemia Industry?
The projected CAGR is approximately 5.20%.
2. Which companies are prominent players in the Acute Lymphoblastic Leukemia Industry?
Key companies in the market include Genmab A/S, Novartis AG, F Hoffmann-La Roche Ltd, Erytech Pharma, Celegene Corporation, Bristol Myer Squibb Company, Sanofi SA*List Not Exhaustive, Eisai Co Ltd, GlaxoSmithKline PLC, Pfizer Inc.
3. What are the main segments of the Acute Lymphoblastic Leukemia Industry?
The market segments include Type of Cell, Type of Therapy.
4. Can you provide details about the market size?
The market size is estimated to be USD XX Million as of 2022.
5. What are some drivers contributing to market growth?
; Rise in the Incidences of Acute Lymphoblastic Leukemia; Increasing Initiatives Taken by the Government and Private Organizations.
6. What are the notable trends driving market growth?
Chemotherapy is Expected to Dominate the Type of Therapy Segment.
7. Are there any restraints impacting market growth?
; Stringent Regulatory Pathways; High Cost Asscoiated with the Treatment.
8. Can you provide examples of recent developments in the market?
N/A
9. What pricing options are available for accessing the report?
Pricing options include single-user, multi-user, and enterprise licenses priced at USD 4750, USD 5250, and USD 8750 respectively.
10. Is the market size provided in terms of value or volume?
The market size is provided in terms of value, measured in Million.
11. Are there any specific market keywords associated with the report?
Yes, the market keyword associated with the report is "Acute Lymphoblastic Leukemia Industry," which aids in identifying and referencing the specific market segment covered.
12. How do I determine which pricing option suits my needs best?
The pricing options vary based on user requirements and access needs. Individual users may opt for single-user licenses, while businesses requiring broader access may choose multi-user or enterprise licenses for cost-effective access to the report.
13. Are there any additional resources or data provided in the Acute Lymphoblastic Leukemia Industry report?
While the report offers comprehensive insights, it's advisable to review the specific contents or supplementary materials provided to ascertain if additional resources or data are available.
14. How can I stay updated on further developments or reports in the Acute Lymphoblastic Leukemia Industry?
To stay informed about further developments, trends, and reports in the Acute Lymphoblastic Leukemia Industry, consider subscribing to industry newsletters, following relevant companies and organizations, or regularly checking reputable industry news sources and publications.
Methodology
Step 1 - Identification of Relevant Samples Size from Population Database


Step 2 - Approaches for Defining Global Market Size (Value, Volume* & Price*)

Note*: In applicable scenarios
Step 3 - Data Sources
Primary Research
- Web Analytics
- Survey Reports
- Research Institute
- Latest Research Reports
- Opinion Leaders
Secondary Research
- Annual Reports
- White Paper
- Latest Press Release
- Industry Association
- Paid Database
- Investor Presentations

Step 4 - Data Triangulation
Involves using different sources of information in order to increase the validity of a study
These sources are likely to be stakeholders in a program - participants, other researchers, program staff, other community members, and so on.
Then we put all data in single framework & apply various statistical tools to find out the dynamic on the market.
During the analysis stage, feedback from the stakeholder groups would be compared to determine areas of agreement as well as areas of divergence
