

Key Insights
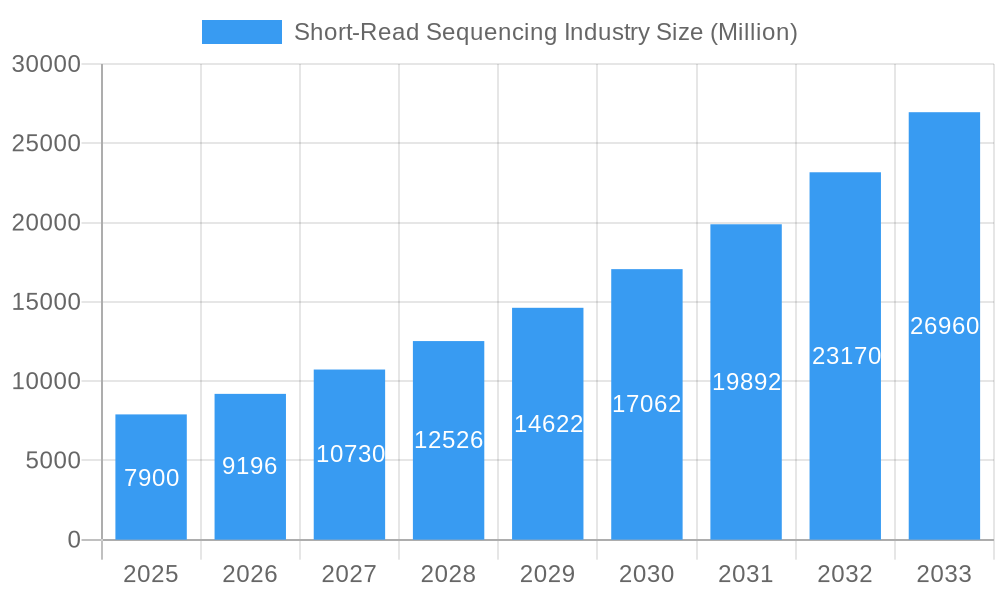
The short-read sequencing market, valued at $7.9 billion in 2025, is experiencing robust growth, projected to expand at a Compound Annual Growth Rate (CAGR) of 16.4% from 2025 to 2033. This surge is driven by several key factors. Advancements in sequencing technologies are resulting in faster, cheaper, and more accurate data generation, making short-read sequencing accessible to a wider range of applications. The increasing prevalence of personalized medicine, fueled by the need for precise genomic information for tailored treatment plans, significantly contributes to market growth. Furthermore, expanding research activities in fields like oncology, infectious disease diagnostics, and agricultural genomics are fueling the demand for high-throughput sequencing solutions. The growing adoption of next-generation sequencing (NGS) in clinical diagnostics, enabling earlier and more accurate disease detection and monitoring, represents a substantial market driver. Major players like Illumina, Thermo Fisher Scientific, and BGI are constantly innovating, introducing new platforms and services that further enhance the efficiency and affordability of short-read sequencing.
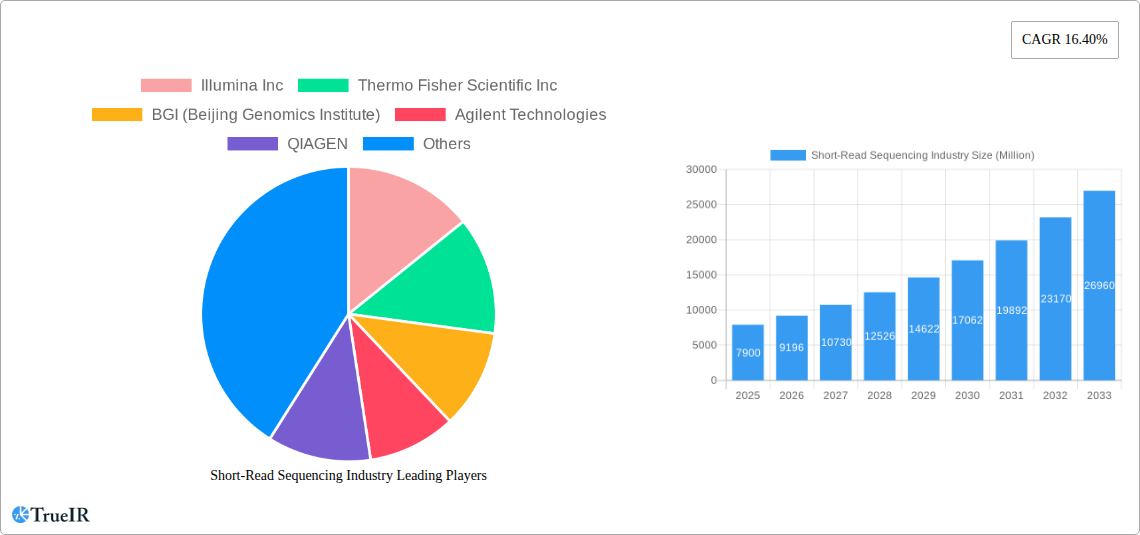
Short-Read Sequencing Industry Market Size (In Billion)
Despite the strong growth trajectory, the market faces certain challenges. Competition among major players is intense, placing pressure on pricing. The complexity of data analysis and interpretation requires specialized expertise, potentially hindering wider adoption. Furthermore, ethical considerations surrounding data privacy and security are crucial aspects that need careful management within the industry. However, these challenges are likely to be outweighed by the rapidly expanding applications and technological advancements. Continued investment in research and development, coupled with the expanding scope of genomic research in both the public and private sectors, positions the short-read sequencing market for sustained and significant growth in the coming years. The market is expected to surpass $25 billion by 2033, based on the provided CAGR and market dynamics.
Short-Read Sequencing Industry Company Market Share
Short-Read Sequencing Industry Market Report: 2019-2033
This comprehensive report provides a detailed analysis of the short-read sequencing industry, encompassing market size, growth projections, competitive dynamics, technological advancements, and future outlook. Covering the period 2019-2033, with a base year of 2025 and a forecast period of 2025-2033, this report is essential for industry stakeholders seeking to understand this rapidly evolving market. The global market is projected to reach xx Million by 2033, exhibiting a robust CAGR of xx% during the forecast period.
Short-Read Sequencing Industry Market Structure & Competitive Landscape
The short-read sequencing market is characterized by a moderately concentrated landscape, dominated by a few key players but also featuring a growing number of smaller, specialized companies. The Herfindahl-Hirschman Index (HHI) for the market in 2024 was estimated at xx, indicating a moderately concentrated market. Innovation is a key driver, with continuous advancements in sequencing technology leading to improved speed, accuracy, and affordability. Regulatory landscapes, varying across regions, significantly impact market access and growth. Product substitutes, such as other genomic technologies, exert competitive pressure. The end-user segment is diverse, encompassing research institutions, pharmaceutical companies, clinical diagnostic laboratories, and agricultural businesses. Mergers and acquisitions (M&A) activity has been considerable, with an estimated xx Million in deal value in 2024, driven by companies seeking to expand their market share and product portfolios. Significant M&A activity is anticipated to continue, consolidating the industry further.
- Market Concentration: Moderately concentrated, with an HHI of xx in 2024.
- Innovation Drivers: Continuous advancements in sequencing technology (e.g., higher throughput, lower costs).
- Regulatory Impacts: Varying regional regulations influence market access and adoption.
- Product Substitutes: Competing genomic technologies (e.g., long-read sequencing).
- End-User Segmentation: Research institutions, pharmaceutical companies, clinical labs, agricultural businesses.
- M&A Trends: Significant activity, with an estimated xx Million in deal value in 2024.
Short-Read Sequencing Industry Market Trends & Opportunities
The short-read sequencing market demonstrates significant growth, driven by technological advancements, falling costs, and expanding applications across various sectors. The market size reached xx Million in 2024 and is projected to surpass xx Million by 2033. This substantial growth is fueled by a Compound Annual Growth Rate (CAGR) of xx%. Technological shifts, including the development of faster, more accurate, and higher-throughput sequencing platforms, are central to this expansion. Increasing demand from personalized medicine, precision oncology, and agricultural genomics further bolsters market expansion. Consumer preference for faster turnaround times and cost-effective solutions also influences market dynamics. Intense competition among major players drives innovation and price reductions. Market penetration rates vary across regions, with developed nations exhibiting higher adoption than emerging economies. Opportunities lie in developing cost-effective solutions for underserved markets and integrating short-read sequencing into clinical diagnostics.
Dominant Markets & Segments in Short-Read Sequencing Industry
The North American region currently dominates the short-read sequencing market, accounting for the largest market share, followed by Europe and Asia-Pacific. The United States holds a leading position due to strong research funding, advanced infrastructure, and a large number of established players.
Key Growth Drivers in North America:
- Robust funding for genomics research.
- Well-established healthcare infrastructure.
- High adoption rates in clinical diagnostics and pharmaceutical industries.
- Supportive regulatory environment.
Key Growth Drivers in Europe:
- Growing investment in life sciences research.
- Increasing adoption of personalized medicine.
- Stringent regulations drive high-quality standards.
Key Growth Drivers in Asia-Pacific:
- Rapidly expanding healthcare sector.
- Growing government support for genomics initiatives.
- Increasing prevalence of chronic diseases driving demand for diagnostics.
The clinical diagnostics segment is a significant driver of market growth, followed by research applications. This is due to the increasing importance of accurate and rapid diagnostics for various diseases.
Short-Read Sequencing Industry Product Analysis
Short-read sequencing technology continues to evolve, with innovations focused on increasing throughput, reducing costs, and improving accuracy. Platforms such as Illumina's NovaSeq X Plus and PacBio's Onso represent significant advancements, offering improved speed, accuracy, and user-friendliness. The integration of these technologies into various applications, such as whole-genome sequencing, exome sequencing, and targeted gene sequencing, expands their market appeal. The competitive advantages of these products lie in their ability to deliver high-quality data at an affordable cost, which caters to the growing demand for genomic information.
Key Drivers, Barriers & Challenges in Short-Read Sequencing Industry
Key Drivers:
Technological advancements (e.g., increased throughput, reduced costs), growing demand for personalized medicine, increased funding for genomic research, and supportive government policies (e.g., grants and tax incentives).
Key Challenges and Restraints:
High initial investment costs for equipment can be a barrier to entry for smaller organizations. Complex regulatory frameworks and data privacy concerns pose significant challenges, along with the potential for supply chain disruptions impacting the availability of reagents and consumables. Intense competition among established players adds further pressure on pricing and market share. It is estimated that xx Million in annual revenue is lost due to supply chain disruptions alone.
Growth Drivers in the Short-Read Sequencing Industry Market
Technological advancements, increased funding for genomic research, expanding applications across various sectors, and rising demand for personalized medicine and diagnostics are major drivers. Government initiatives and supportive regulatory frameworks in several countries further propel market growth.
Challenges Impacting Short-Read Sequencing Industry Growth
High costs of sequencing, complex regulatory environments, stringent data privacy regulations, and potential supply chain disruptions are major obstacles. The intense competition among established players also creates price pressures and limits profit margins.
Key Players Shaping the Short-Read Sequencing Industry Market
Significant Short-Read Sequencing Industry Milestones
- December 2023: Firalis Molecular Precision acquires Illumina NovaSeq X Plus system, significantly enhancing its genomics capabilities.
- August 2023: PacBio commercializes its Onso short-read sequencing system in the US, introducing novel SBB chemistry.
Future Outlook for Short-Read Sequencing Industry Market
The short-read sequencing market is poised for continued growth, driven by ongoing technological advancements, expanding applications, and increased investment in genomics research. Strategic partnerships and collaborations, along with the integration of AI and machine learning, are expected to further enhance market potential. The focus on cost reduction and improving accessibility will be key for broader market penetration in both developed and emerging economies.
Short-Read Sequencing Industry Segmentation
-
1. Product and Services
- 1.1. Instruments
- 1.2. Consumables
-
2. Platform
- 2.1. Sequencing by Synthesis (SBS)
- 2.2. Sequencing by Binding (SBB)
- 2.3. Sequencing by Ligation (SBL)
-
3. Application
- 3.1. Whole Genome Sequencing (WGS)
- 3.2. Whole Exome Sequencing (WES)
- 3.3. Other Applications
-
4. End User
- 4.1. Academic and Research Institutes
- 4.2. Pharmaceutical and Biotechnology Companies
- 4.3. Clinical Research Laboratories
- 4.4. Other End Users
Short-Read Sequencing Industry Segmentation By Geography
-
1. North America
- 1.1. United States
- 1.2. Canada
- 1.3. Mexico
-
2. Europe
- 2.1. Germany
- 2.2. United Kingdom
- 2.3. France
- 2.4. Italy
- 2.5. Spain
- 2.6. Rest of Europe
-
3. Asia Pacific
- 3.1. China
- 3.2. Japan
- 3.3. India
- 3.4. Australia
- 3.5. South Korea
- 3.6. Rest of Asia Pacific
-
4. Middle East and Africa
- 4.1. GCC
- 4.2. South Africa
- 4.3. Rest of Middle East and Africa
-
5. South America
- 5.1. Brazil
- 5.2. Argentina
- 5.3. Rest of South America
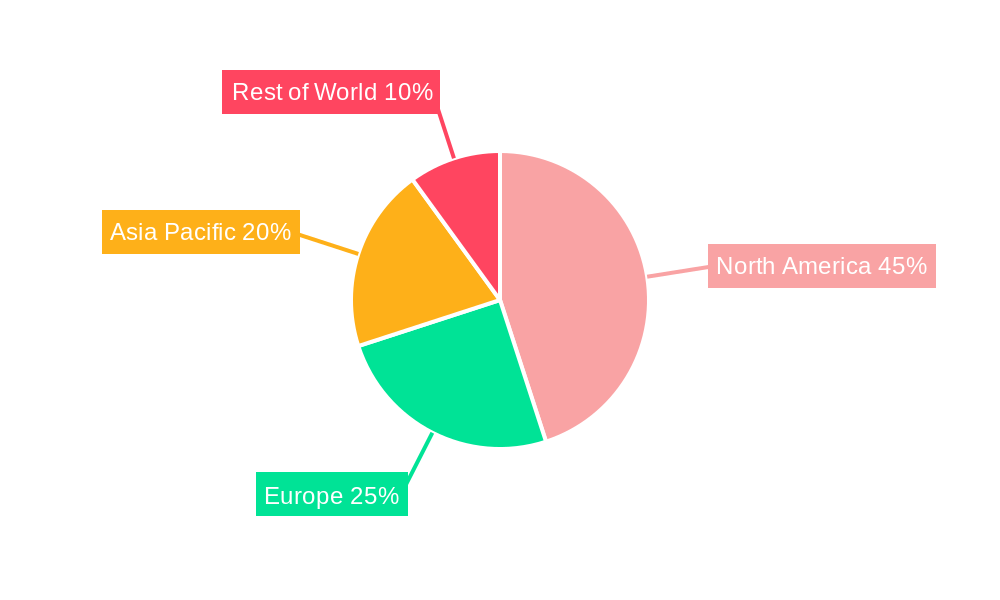
Short-Read Sequencing Industry Regional Market Share
Geographic Coverage of Short-Read Sequencing Industry
Short-Read Sequencing Industry REPORT HIGHLIGHTS
| Aspects | Details |
|---|---|
| Study Period | 2020-2034 |
| Base Year | 2025 |
| Estimated Year | 2026 |
| Forecast Period | 2026-2034 |
| Historical Period | 2020-2025 |
| Growth Rate | CAGR of 16.40% from 2020-2034 |
| Segmentation |
|
Table of Contents
- 1. Introduction
- 1.1. Research Scope
- 1.2. Market Segmentation
- 1.3. Research Objective
- 1.4. Definitions and Assumptions
- 2. Executive Summary
- 2.1. Market Snapshot
- 3. Market Dynamics
- 3.1. Market Drivers
- 3.2. Market Restrains
- 3.3. Market Trends
- 3.4. Market Opportunities
- 4. Market Factor Analysis
- 4.1. Porters Five Forces
- 4.1.1. Bargaining Power of Suppliers
- 4.1.2. Bargaining Power of Buyers
- 4.1.3. Threat of New Entrants
- 4.1.4. Threat of Substitutes
- 4.1.5. Competitive Rivalry
- 4.2. PESTEL analysis
- 4.3. BCG Analysis
- 4.3.1. Stars (High Growth, High Market Share)
- 4.3.2. Cash Cows (Low Growth, High Market Share)
- 4.3.3. Question Mark (High Growth, Low Market Share)
- 4.3.4. Dogs (Low Growth, Low Market Share)
- 4.4. Ansoff Matrix Analysis
- 4.5. Supply Chain Analysis
- 4.6. Regulatory Landscape
- 4.7. Current Market Potential and Opportunity Assessment (TAM–SAM–SOM Framework)
- 4.8. TIR Analyst Note
- 4.1. Porters Five Forces
- 5. Market Analysis, Insights and Forecast 2021-2033
- 5.1. Market Analysis, Insights and Forecast - by Product and Services
- 5.1.1. Instruments
- 5.1.2. Consumables
- 5.2. Market Analysis, Insights and Forecast - by Platform
- 5.2.1. Sequencing by Synthesis (SBS)
- 5.2.2. Sequencing by Binding (SBB)
- 5.2.3. Sequencing by Ligation (SBL)
- 5.3. Market Analysis, Insights and Forecast - by Application
- 5.3.1. Whole Genome Sequencing (WGS)
- 5.3.2. Whole Exome Sequencing (WES)
- 5.3.3. Other Applications
- 5.4. Market Analysis, Insights and Forecast - by End User
- 5.4.1. Academic and Research Institutes
- 5.4.2. Pharmaceutical and Biotechnology Companies
- 5.4.3. Clinical Research Laboratories
- 5.4.4. Other End Users
- 5.5. Market Analysis, Insights and Forecast - by Region
- 5.5.1. North America
- 5.5.2. Europe
- 5.5.3. Asia Pacific
- 5.5.4. Middle East and Africa
- 5.5.5. South America
- 5.1. Market Analysis, Insights and Forecast - by Product and Services
- 6. Global Short-Read Sequencing Industry Analysis, Insights and Forecast, 2021-2033
- 6.1. Market Analysis, Insights and Forecast - by Product and Services
- 6.1.1. Instruments
- 6.1.2. Consumables
- 6.2. Market Analysis, Insights and Forecast - by Platform
- 6.2.1. Sequencing by Synthesis (SBS)
- 6.2.2. Sequencing by Binding (SBB)
- 6.2.3. Sequencing by Ligation (SBL)
- 6.3. Market Analysis, Insights and Forecast - by Application
- 6.3.1. Whole Genome Sequencing (WGS)
- 6.3.2. Whole Exome Sequencing (WES)
- 6.3.3. Other Applications
- 6.4. Market Analysis, Insights and Forecast - by End User
- 6.4.1. Academic and Research Institutes
- 6.4.2. Pharmaceutical and Biotechnology Companies
- 6.4.3. Clinical Research Laboratories
- 6.4.4. Other End Users
- 6.1. Market Analysis, Insights and Forecast - by Product and Services
- 7. North America Short-Read Sequencing Industry Analysis, Insights and Forecast, 2020-2032
- 7.1. Market Analysis, Insights and Forecast - by Product and Services
- 7.1.1. Instruments
- 7.1.2. Consumables
- 7.2. Market Analysis, Insights and Forecast - by Platform
- 7.2.1. Sequencing by Synthesis (SBS)
- 7.2.2. Sequencing by Binding (SBB)
- 7.2.3. Sequencing by Ligation (SBL)
- 7.3. Market Analysis, Insights and Forecast - by Application
- 7.3.1. Whole Genome Sequencing (WGS)
- 7.3.2. Whole Exome Sequencing (WES)
- 7.3.3. Other Applications
- 7.4. Market Analysis, Insights and Forecast - by End User
- 7.4.1. Academic and Research Institutes
- 7.4.2. Pharmaceutical and Biotechnology Companies
- 7.4.3. Clinical Research Laboratories
- 7.4.4. Other End Users
- 7.1. Market Analysis, Insights and Forecast - by Product and Services
- 8. Europe Short-Read Sequencing Industry Analysis, Insights and Forecast, 2020-2032
- 8.1. Market Analysis, Insights and Forecast - by Product and Services
- 8.1.1. Instruments
- 8.1.2. Consumables
- 8.2. Market Analysis, Insights and Forecast - by Platform
- 8.2.1. Sequencing by Synthesis (SBS)
- 8.2.2. Sequencing by Binding (SBB)
- 8.2.3. Sequencing by Ligation (SBL)
- 8.3. Market Analysis, Insights and Forecast - by Application
- 8.3.1. Whole Genome Sequencing (WGS)
- 8.3.2. Whole Exome Sequencing (WES)
- 8.3.3. Other Applications
- 8.4. Market Analysis, Insights and Forecast - by End User
- 8.4.1. Academic and Research Institutes
- 8.4.2. Pharmaceutical and Biotechnology Companies
- 8.4.3. Clinical Research Laboratories
- 8.4.4. Other End Users
- 8.1. Market Analysis, Insights and Forecast - by Product and Services
- 9. Asia Pacific Short-Read Sequencing Industry Analysis, Insights and Forecast, 2020-2032
- 9.1. Market Analysis, Insights and Forecast - by Product and Services
- 9.1.1. Instruments
- 9.1.2. Consumables
- 9.2. Market Analysis, Insights and Forecast - by Platform
- 9.2.1. Sequencing by Synthesis (SBS)
- 9.2.2. Sequencing by Binding (SBB)
- 9.2.3. Sequencing by Ligation (SBL)
- 9.3. Market Analysis, Insights and Forecast - by Application
- 9.3.1. Whole Genome Sequencing (WGS)
- 9.3.2. Whole Exome Sequencing (WES)
- 9.3.3. Other Applications
- 9.4. Market Analysis, Insights and Forecast - by End User
- 9.4.1. Academic and Research Institutes
- 9.4.2. Pharmaceutical and Biotechnology Companies
- 9.4.3. Clinical Research Laboratories
- 9.4.4. Other End Users
- 9.1. Market Analysis, Insights and Forecast - by Product and Services
- 10. Middle East and Africa Short-Read Sequencing Industry Analysis, Insights and Forecast, 2020-2032
- 10.1. Market Analysis, Insights and Forecast - by Product and Services
- 10.1.1. Instruments
- 10.1.2. Consumables
- 10.2. Market Analysis, Insights and Forecast - by Platform
- 10.2.1. Sequencing by Synthesis (SBS)
- 10.2.2. Sequencing by Binding (SBB)
- 10.2.3. Sequencing by Ligation (SBL)
- 10.3. Market Analysis, Insights and Forecast - by Application
- 10.3.1. Whole Genome Sequencing (WGS)
- 10.3.2. Whole Exome Sequencing (WES)
- 10.3.3. Other Applications
- 10.4. Market Analysis, Insights and Forecast - by End User
- 10.4.1. Academic and Research Institutes
- 10.4.2. Pharmaceutical and Biotechnology Companies
- 10.4.3. Clinical Research Laboratories
- 10.4.4. Other End Users
- 10.1. Market Analysis, Insights and Forecast - by Product and Services
- 11. South America Short-Read Sequencing Industry Analysis, Insights and Forecast, 2020-2032
- 11.1. Market Analysis, Insights and Forecast - by Product and Services
- 11.1.1. Instruments
- 11.1.2. Consumables
- 11.2. Market Analysis, Insights and Forecast - by Platform
- 11.2.1. Sequencing by Synthesis (SBS)
- 11.2.2. Sequencing by Binding (SBB)
- 11.2.3. Sequencing by Ligation (SBL)
- 11.3. Market Analysis, Insights and Forecast - by Application
- 11.3.1. Whole Genome Sequencing (WGS)
- 11.3.2. Whole Exome Sequencing (WES)
- 11.3.3. Other Applications
- 11.4. Market Analysis, Insights and Forecast - by End User
- 11.4.1. Academic and Research Institutes
- 11.4.2. Pharmaceutical and Biotechnology Companies
- 11.4.3. Clinical Research Laboratories
- 11.4.4. Other End Users
- 11.1. Market Analysis, Insights and Forecast - by Product and Services
- 12. Competitive Analysis
- 12.1. Company Profiles
- 12.1.1 Illumina Inc
- 12.1.1.1. Company Overview
- 12.1.1.2. Products
- 12.1.1.3. Company Financials
- 12.1.1.4. SWOT Analysis
- 12.1.2 Thermo Fisher Scientific Inc
- 12.1.2.1. Company Overview
- 12.1.2.2. Products
- 12.1.2.3. Company Financials
- 12.1.2.4. SWOT Analysis
- 12.1.3 BGI (Beijing Genomics Institute)
- 12.1.3.1. Company Overview
- 12.1.3.2. Products
- 12.1.3.3. Company Financials
- 12.1.3.4. SWOT Analysis
- 12.1.4 Agilent Technologies
- 12.1.4.1. Company Overview
- 12.1.4.2. Products
- 12.1.4.3. Company Financials
- 12.1.4.4. SWOT Analysis
- 12.1.5 QIAGEN
- 12.1.5.1. Company Overview
- 12.1.5.2. Products
- 12.1.5.3. Company Financials
- 12.1.5.4. SWOT Analysis
- 12.1.6 F Hoffmann-La Roche Ltd
- 12.1.6.1. Company Overview
- 12.1.6.2. Products
- 12.1.6.3. Company Financials
- 12.1.6.4. SWOT Analysis
- 12.1.7 Pacific Biosciences (PacBio)
- 12.1.7.1. Company Overview
- 12.1.7.2. Products
- 12.1.7.3. Company Financials
- 12.1.7.4. SWOT Analysis
- 12.1.8 10x Geonomics
- 12.1.8.1. Company Overview
- 12.1.8.2. Products
- 12.1.8.3. Company Financials
- 12.1.8.4. SWOT Analysis
- 12.1.9 Oxford Nanopore Technologies PLC
- 12.1.9.1. Company Overview
- 12.1.9.2. Products
- 12.1.9.3. Company Financials
- 12.1.9.4. SWOT Analysis
- 12.1.10 Macrogen Inc
- 12.1.10.1. Company Overview
- 12.1.10.2. Products
- 12.1.10.3. Company Financials
- 12.1.10.4. SWOT Analysis
- 12.1.11 PerkinElmer Inc *List Not Exhaustive
- 12.1.11.1. Company Overview
- 12.1.11.2. Products
- 12.1.11.3. Company Financials
- 12.1.11.4. SWOT Analysis
- 12.1.1 Illumina Inc
- 12.2. Market Entropy
- 12.2.1 Company's Key Areas Served
- 12.2.2 Recent Developments
- 12.3. Company Market Share Analysis 2025
- 12.3.1 Top 5 Companies Market Share Analysis
- 12.3.2 Top 3 Companies Market Share Analysis
- 12.4. List of Potential Customers
- 13. Research Methodology
List of Figures
- Figure 1: Global Short-Read Sequencing Industry Revenue Breakdown (Million, %) by Region 2025 & 2033
- Figure 2: Global Short-Read Sequencing Industry Volume Breakdown (Billion, %) by Region 2025 & 2033
- Figure 3: North America Short-Read Sequencing Industry Revenue (Million), by Product and Services 2025 & 2033
- Figure 4: North America Short-Read Sequencing Industry Volume (Billion), by Product and Services 2025 & 2033
- Figure 5: North America Short-Read Sequencing Industry Revenue Share (%), by Product and Services 2025 & 2033
- Figure 6: North America Short-Read Sequencing Industry Volume Share (%), by Product and Services 2025 & 2033
- Figure 7: North America Short-Read Sequencing Industry Revenue (Million), by Platform 2025 & 2033
- Figure 8: North America Short-Read Sequencing Industry Volume (Billion), by Platform 2025 & 2033
- Figure 9: North America Short-Read Sequencing Industry Revenue Share (%), by Platform 2025 & 2033
- Figure 10: North America Short-Read Sequencing Industry Volume Share (%), by Platform 2025 & 2033
- Figure 11: North America Short-Read Sequencing Industry Revenue (Million), by Application 2025 & 2033
- Figure 12: North America Short-Read Sequencing Industry Volume (Billion), by Application 2025 & 2033
- Figure 13: North America Short-Read Sequencing Industry Revenue Share (%), by Application 2025 & 2033
- Figure 14: North America Short-Read Sequencing Industry Volume Share (%), by Application 2025 & 2033
- Figure 15: North America Short-Read Sequencing Industry Revenue (Million), by End User 2025 & 2033
- Figure 16: North America Short-Read Sequencing Industry Volume (Billion), by End User 2025 & 2033
- Figure 17: North America Short-Read Sequencing Industry Revenue Share (%), by End User 2025 & 2033
- Figure 18: North America Short-Read Sequencing Industry Volume Share (%), by End User 2025 & 2033
- Figure 19: North America Short-Read Sequencing Industry Revenue (Million), by Country 2025 & 2033
- Figure 20: North America Short-Read Sequencing Industry Volume (Billion), by Country 2025 & 2033
- Figure 21: North America Short-Read Sequencing Industry Revenue Share (%), by Country 2025 & 2033
- Figure 22: North America Short-Read Sequencing Industry Volume Share (%), by Country 2025 & 2033
- Figure 23: Europe Short-Read Sequencing Industry Revenue (Million), by Product and Services 2025 & 2033
- Figure 24: Europe Short-Read Sequencing Industry Volume (Billion), by Product and Services 2025 & 2033
- Figure 25: Europe Short-Read Sequencing Industry Revenue Share (%), by Product and Services 2025 & 2033
- Figure 26: Europe Short-Read Sequencing Industry Volume Share (%), by Product and Services 2025 & 2033
- Figure 27: Europe Short-Read Sequencing Industry Revenue (Million), by Platform 2025 & 2033
- Figure 28: Europe Short-Read Sequencing Industry Volume (Billion), by Platform 2025 & 2033
- Figure 29: Europe Short-Read Sequencing Industry Revenue Share (%), by Platform 2025 & 2033
- Figure 30: Europe Short-Read Sequencing Industry Volume Share (%), by Platform 2025 & 2033
- Figure 31: Europe Short-Read Sequencing Industry Revenue (Million), by Application 2025 & 2033
- Figure 32: Europe Short-Read Sequencing Industry Volume (Billion), by Application 2025 & 2033
- Figure 33: Europe Short-Read Sequencing Industry Revenue Share (%), by Application 2025 & 2033
- Figure 34: Europe Short-Read Sequencing Industry Volume Share (%), by Application 2025 & 2033
- Figure 35: Europe Short-Read Sequencing Industry Revenue (Million), by End User 2025 & 2033
- Figure 36: Europe Short-Read Sequencing Industry Volume (Billion), by End User 2025 & 2033
- Figure 37: Europe Short-Read Sequencing Industry Revenue Share (%), by End User 2025 & 2033
- Figure 38: Europe Short-Read Sequencing Industry Volume Share (%), by End User 2025 & 2033
- Figure 39: Europe Short-Read Sequencing Industry Revenue (Million), by Country 2025 & 2033
- Figure 40: Europe Short-Read Sequencing Industry Volume (Billion), by Country 2025 & 2033
- Figure 41: Europe Short-Read Sequencing Industry Revenue Share (%), by Country 2025 & 2033
- Figure 42: Europe Short-Read Sequencing Industry Volume Share (%), by Country 2025 & 2033
- Figure 43: Asia Pacific Short-Read Sequencing Industry Revenue (Million), by Product and Services 2025 & 2033
- Figure 44: Asia Pacific Short-Read Sequencing Industry Volume (Billion), by Product and Services 2025 & 2033
- Figure 45: Asia Pacific Short-Read Sequencing Industry Revenue Share (%), by Product and Services 2025 & 2033
- Figure 46: Asia Pacific Short-Read Sequencing Industry Volume Share (%), by Product and Services 2025 & 2033
- Figure 47: Asia Pacific Short-Read Sequencing Industry Revenue (Million), by Platform 2025 & 2033
- Figure 48: Asia Pacific Short-Read Sequencing Industry Volume (Billion), by Platform 2025 & 2033
- Figure 49: Asia Pacific Short-Read Sequencing Industry Revenue Share (%), by Platform 2025 & 2033
- Figure 50: Asia Pacific Short-Read Sequencing Industry Volume Share (%), by Platform 2025 & 2033
- Figure 51: Asia Pacific Short-Read Sequencing Industry Revenue (Million), by Application 2025 & 2033
- Figure 52: Asia Pacific Short-Read Sequencing Industry Volume (Billion), by Application 2025 & 2033
- Figure 53: Asia Pacific Short-Read Sequencing Industry Revenue Share (%), by Application 2025 & 2033
- Figure 54: Asia Pacific Short-Read Sequencing Industry Volume Share (%), by Application 2025 & 2033
- Figure 55: Asia Pacific Short-Read Sequencing Industry Revenue (Million), by End User 2025 & 2033
- Figure 56: Asia Pacific Short-Read Sequencing Industry Volume (Billion), by End User 2025 & 2033
- Figure 57: Asia Pacific Short-Read Sequencing Industry Revenue Share (%), by End User 2025 & 2033
- Figure 58: Asia Pacific Short-Read Sequencing Industry Volume Share (%), by End User 2025 & 2033
- Figure 59: Asia Pacific Short-Read Sequencing Industry Revenue (Million), by Country 2025 & 2033
- Figure 60: Asia Pacific Short-Read Sequencing Industry Volume (Billion), by Country 2025 & 2033
- Figure 61: Asia Pacific Short-Read Sequencing Industry Revenue Share (%), by Country 2025 & 2033
- Figure 62: Asia Pacific Short-Read Sequencing Industry Volume Share (%), by Country 2025 & 2033
- Figure 63: Middle East and Africa Short-Read Sequencing Industry Revenue (Million), by Product and Services 2025 & 2033
- Figure 64: Middle East and Africa Short-Read Sequencing Industry Volume (Billion), by Product and Services 2025 & 2033
- Figure 65: Middle East and Africa Short-Read Sequencing Industry Revenue Share (%), by Product and Services 2025 & 2033
- Figure 66: Middle East and Africa Short-Read Sequencing Industry Volume Share (%), by Product and Services 2025 & 2033
- Figure 67: Middle East and Africa Short-Read Sequencing Industry Revenue (Million), by Platform 2025 & 2033
- Figure 68: Middle East and Africa Short-Read Sequencing Industry Volume (Billion), by Platform 2025 & 2033
- Figure 69: Middle East and Africa Short-Read Sequencing Industry Revenue Share (%), by Platform 2025 & 2033
- Figure 70: Middle East and Africa Short-Read Sequencing Industry Volume Share (%), by Platform 2025 & 2033
- Figure 71: Middle East and Africa Short-Read Sequencing Industry Revenue (Million), by Application 2025 & 2033
- Figure 72: Middle East and Africa Short-Read Sequencing Industry Volume (Billion), by Application 2025 & 2033
- Figure 73: Middle East and Africa Short-Read Sequencing Industry Revenue Share (%), by Application 2025 & 2033
- Figure 74: Middle East and Africa Short-Read Sequencing Industry Volume Share (%), by Application 2025 & 2033
- Figure 75: Middle East and Africa Short-Read Sequencing Industry Revenue (Million), by End User 2025 & 2033
- Figure 76: Middle East and Africa Short-Read Sequencing Industry Volume (Billion), by End User 2025 & 2033
- Figure 77: Middle East and Africa Short-Read Sequencing Industry Revenue Share (%), by End User 2025 & 2033
- Figure 78: Middle East and Africa Short-Read Sequencing Industry Volume Share (%), by End User 2025 & 2033
- Figure 79: Middle East and Africa Short-Read Sequencing Industry Revenue (Million), by Country 2025 & 2033
- Figure 80: Middle East and Africa Short-Read Sequencing Industry Volume (Billion), by Country 2025 & 2033
- Figure 81: Middle East and Africa Short-Read Sequencing Industry Revenue Share (%), by Country 2025 & 2033
- Figure 82: Middle East and Africa Short-Read Sequencing Industry Volume Share (%), by Country 2025 & 2033
- Figure 83: South America Short-Read Sequencing Industry Revenue (Million), by Product and Services 2025 & 2033
- Figure 84: South America Short-Read Sequencing Industry Volume (Billion), by Product and Services 2025 & 2033
- Figure 85: South America Short-Read Sequencing Industry Revenue Share (%), by Product and Services 2025 & 2033
- Figure 86: South America Short-Read Sequencing Industry Volume Share (%), by Product and Services 2025 & 2033
- Figure 87: South America Short-Read Sequencing Industry Revenue (Million), by Platform 2025 & 2033
- Figure 88: South America Short-Read Sequencing Industry Volume (Billion), by Platform 2025 & 2033
- Figure 89: South America Short-Read Sequencing Industry Revenue Share (%), by Platform 2025 & 2033
- Figure 90: South America Short-Read Sequencing Industry Volume Share (%), by Platform 2025 & 2033
- Figure 91: South America Short-Read Sequencing Industry Revenue (Million), by Application 2025 & 2033
- Figure 92: South America Short-Read Sequencing Industry Volume (Billion), by Application 2025 & 2033
- Figure 93: South America Short-Read Sequencing Industry Revenue Share (%), by Application 2025 & 2033
- Figure 94: South America Short-Read Sequencing Industry Volume Share (%), by Application 2025 & 2033
- Figure 95: South America Short-Read Sequencing Industry Revenue (Million), by End User 2025 & 2033
- Figure 96: South America Short-Read Sequencing Industry Volume (Billion), by End User 2025 & 2033
- Figure 97: South America Short-Read Sequencing Industry Revenue Share (%), by End User 2025 & 2033
- Figure 98: South America Short-Read Sequencing Industry Volume Share (%), by End User 2025 & 2033
- Figure 99: South America Short-Read Sequencing Industry Revenue (Million), by Country 2025 & 2033
- Figure 100: South America Short-Read Sequencing Industry Volume (Billion), by Country 2025 & 2033
- Figure 101: South America Short-Read Sequencing Industry Revenue Share (%), by Country 2025 & 2033
- Figure 102: South America Short-Read Sequencing Industry Volume Share (%), by Country 2025 & 2033
List of Tables
- Table 1: Global Short-Read Sequencing Industry Revenue Million Forecast, by Product and Services 2020 & 2033
- Table 2: Global Short-Read Sequencing Industry Volume Billion Forecast, by Product and Services 2020 & 2033
- Table 3: Global Short-Read Sequencing Industry Revenue Million Forecast, by Platform 2020 & 2033
- Table 4: Global Short-Read Sequencing Industry Volume Billion Forecast, by Platform 2020 & 2033
- Table 5: Global Short-Read Sequencing Industry Revenue Million Forecast, by Application 2020 & 2033
- Table 6: Global Short-Read Sequencing Industry Volume Billion Forecast, by Application 2020 & 2033
- Table 7: Global Short-Read Sequencing Industry Revenue Million Forecast, by End User 2020 & 2033
- Table 8: Global Short-Read Sequencing Industry Volume Billion Forecast, by End User 2020 & 2033
- Table 9: Global Short-Read Sequencing Industry Revenue Million Forecast, by Region 2020 & 2033
- Table 10: Global Short-Read Sequencing Industry Volume Billion Forecast, by Region 2020 & 2033
- Table 11: Global Short-Read Sequencing Industry Revenue Million Forecast, by Product and Services 2020 & 2033
- Table 12: Global Short-Read Sequencing Industry Volume Billion Forecast, by Product and Services 2020 & 2033
- Table 13: Global Short-Read Sequencing Industry Revenue Million Forecast, by Platform 2020 & 2033
- Table 14: Global Short-Read Sequencing Industry Volume Billion Forecast, by Platform 2020 & 2033
- Table 15: Global Short-Read Sequencing Industry Revenue Million Forecast, by Application 2020 & 2033
- Table 16: Global Short-Read Sequencing Industry Volume Billion Forecast, by Application 2020 & 2033
- Table 17: Global Short-Read Sequencing Industry Revenue Million Forecast, by End User 2020 & 2033
- Table 18: Global Short-Read Sequencing Industry Volume Billion Forecast, by End User 2020 & 2033
- Table 19: Global Short-Read Sequencing Industry Revenue Million Forecast, by Country 2020 & 2033
- Table 20: Global Short-Read Sequencing Industry Volume Billion Forecast, by Country 2020 & 2033
- Table 21: United States Short-Read Sequencing Industry Revenue (Million) Forecast, by Application 2020 & 2033
- Table 22: United States Short-Read Sequencing Industry Volume (Billion) Forecast, by Application 2020 & 2033
- Table 23: Canada Short-Read Sequencing Industry Revenue (Million) Forecast, by Application 2020 & 2033
- Table 24: Canada Short-Read Sequencing Industry Volume (Billion) Forecast, by Application 2020 & 2033
- Table 25: Mexico Short-Read Sequencing Industry Revenue (Million) Forecast, by Application 2020 & 2033
- Table 26: Mexico Short-Read Sequencing Industry Volume (Billion) Forecast, by Application 2020 & 2033
- Table 27: Global Short-Read Sequencing Industry Revenue Million Forecast, by Product and Services 2020 & 2033
- Table 28: Global Short-Read Sequencing Industry Volume Billion Forecast, by Product and Services 2020 & 2033
- Table 29: Global Short-Read Sequencing Industry Revenue Million Forecast, by Platform 2020 & 2033
- Table 30: Global Short-Read Sequencing Industry Volume Billion Forecast, by Platform 2020 & 2033
- Table 31: Global Short-Read Sequencing Industry Revenue Million Forecast, by Application 2020 & 2033
- Table 32: Global Short-Read Sequencing Industry Volume Billion Forecast, by Application 2020 & 2033
- Table 33: Global Short-Read Sequencing Industry Revenue Million Forecast, by End User 2020 & 2033
- Table 34: Global Short-Read Sequencing Industry Volume Billion Forecast, by End User 2020 & 2033
- Table 35: Global Short-Read Sequencing Industry Revenue Million Forecast, by Country 2020 & 2033
- Table 36: Global Short-Read Sequencing Industry Volume Billion Forecast, by Country 2020 & 2033
- Table 37: Germany Short-Read Sequencing Industry Revenue (Million) Forecast, by Application 2020 & 2033
- Table 38: Germany Short-Read Sequencing Industry Volume (Billion) Forecast, by Application 2020 & 2033
- Table 39: United Kingdom Short-Read Sequencing Industry Revenue (Million) Forecast, by Application 2020 & 2033
- Table 40: United Kingdom Short-Read Sequencing Industry Volume (Billion) Forecast, by Application 2020 & 2033
- Table 41: France Short-Read Sequencing Industry Revenue (Million) Forecast, by Application 2020 & 2033
- Table 42: France Short-Read Sequencing Industry Volume (Billion) Forecast, by Application 2020 & 2033
- Table 43: Italy Short-Read Sequencing Industry Revenue (Million) Forecast, by Application 2020 & 2033
- Table 44: Italy Short-Read Sequencing Industry Volume (Billion) Forecast, by Application 2020 & 2033
- Table 45: Spain Short-Read Sequencing Industry Revenue (Million) Forecast, by Application 2020 & 2033
- Table 46: Spain Short-Read Sequencing Industry Volume (Billion) Forecast, by Application 2020 & 2033
- Table 47: Rest of Europe Short-Read Sequencing Industry Revenue (Million) Forecast, by Application 2020 & 2033
- Table 48: Rest of Europe Short-Read Sequencing Industry Volume (Billion) Forecast, by Application 2020 & 2033
- Table 49: Global Short-Read Sequencing Industry Revenue Million Forecast, by Product and Services 2020 & 2033
- Table 50: Global Short-Read Sequencing Industry Volume Billion Forecast, by Product and Services 2020 & 2033
- Table 51: Global Short-Read Sequencing Industry Revenue Million Forecast, by Platform 2020 & 2033
- Table 52: Global Short-Read Sequencing Industry Volume Billion Forecast, by Platform 2020 & 2033
- Table 53: Global Short-Read Sequencing Industry Revenue Million Forecast, by Application 2020 & 2033
- Table 54: Global Short-Read Sequencing Industry Volume Billion Forecast, by Application 2020 & 2033
- Table 55: Global Short-Read Sequencing Industry Revenue Million Forecast, by End User 2020 & 2033
- Table 56: Global Short-Read Sequencing Industry Volume Billion Forecast, by End User 2020 & 2033
- Table 57: Global Short-Read Sequencing Industry Revenue Million Forecast, by Country 2020 & 2033
- Table 58: Global Short-Read Sequencing Industry Volume Billion Forecast, by Country 2020 & 2033
- Table 59: China Short-Read Sequencing Industry Revenue (Million) Forecast, by Application 2020 & 2033
- Table 60: China Short-Read Sequencing Industry Volume (Billion) Forecast, by Application 2020 & 2033
- Table 61: Japan Short-Read Sequencing Industry Revenue (Million) Forecast, by Application 2020 & 2033
- Table 62: Japan Short-Read Sequencing Industry Volume (Billion) Forecast, by Application 2020 & 2033
- Table 63: India Short-Read Sequencing Industry Revenue (Million) Forecast, by Application 2020 & 2033
- Table 64: India Short-Read Sequencing Industry Volume (Billion) Forecast, by Application 2020 & 2033
- Table 65: Australia Short-Read Sequencing Industry Revenue (Million) Forecast, by Application 2020 & 2033
- Table 66: Australia Short-Read Sequencing Industry Volume (Billion) Forecast, by Application 2020 & 2033
- Table 67: South Korea Short-Read Sequencing Industry Revenue (Million) Forecast, by Application 2020 & 2033
- Table 68: South Korea Short-Read Sequencing Industry Volume (Billion) Forecast, by Application 2020 & 2033
- Table 69: Rest of Asia Pacific Short-Read Sequencing Industry Revenue (Million) Forecast, by Application 2020 & 2033
- Table 70: Rest of Asia Pacific Short-Read Sequencing Industry Volume (Billion) Forecast, by Application 2020 & 2033
- Table 71: Global Short-Read Sequencing Industry Revenue Million Forecast, by Product and Services 2020 & 2033
- Table 72: Global Short-Read Sequencing Industry Volume Billion Forecast, by Product and Services 2020 & 2033
- Table 73: Global Short-Read Sequencing Industry Revenue Million Forecast, by Platform 2020 & 2033
- Table 74: Global Short-Read Sequencing Industry Volume Billion Forecast, by Platform 2020 & 2033
- Table 75: Global Short-Read Sequencing Industry Revenue Million Forecast, by Application 2020 & 2033
- Table 76: Global Short-Read Sequencing Industry Volume Billion Forecast, by Application 2020 & 2033
- Table 77: Global Short-Read Sequencing Industry Revenue Million Forecast, by End User 2020 & 2033
- Table 78: Global Short-Read Sequencing Industry Volume Billion Forecast, by End User 2020 & 2033
- Table 79: Global Short-Read Sequencing Industry Revenue Million Forecast, by Country 2020 & 2033
- Table 80: Global Short-Read Sequencing Industry Volume Billion Forecast, by Country 2020 & 2033
- Table 81: GCC Short-Read Sequencing Industry Revenue (Million) Forecast, by Application 2020 & 2033
- Table 82: GCC Short-Read Sequencing Industry Volume (Billion) Forecast, by Application 2020 & 2033
- Table 83: South Africa Short-Read Sequencing Industry Revenue (Million) Forecast, by Application 2020 & 2033
- Table 84: South Africa Short-Read Sequencing Industry Volume (Billion) Forecast, by Application 2020 & 2033
- Table 85: Rest of Middle East and Africa Short-Read Sequencing Industry Revenue (Million) Forecast, by Application 2020 & 2033
- Table 86: Rest of Middle East and Africa Short-Read Sequencing Industry Volume (Billion) Forecast, by Application 2020 & 2033
- Table 87: Global Short-Read Sequencing Industry Revenue Million Forecast, by Product and Services 2020 & 2033
- Table 88: Global Short-Read Sequencing Industry Volume Billion Forecast, by Product and Services 2020 & 2033
- Table 89: Global Short-Read Sequencing Industry Revenue Million Forecast, by Platform 2020 & 2033
- Table 90: Global Short-Read Sequencing Industry Volume Billion Forecast, by Platform 2020 & 2033
- Table 91: Global Short-Read Sequencing Industry Revenue Million Forecast, by Application 2020 & 2033
- Table 92: Global Short-Read Sequencing Industry Volume Billion Forecast, by Application 2020 & 2033
- Table 93: Global Short-Read Sequencing Industry Revenue Million Forecast, by End User 2020 & 2033
- Table 94: Global Short-Read Sequencing Industry Volume Billion Forecast, by End User 2020 & 2033
- Table 95: Global Short-Read Sequencing Industry Revenue Million Forecast, by Country 2020 & 2033
- Table 96: Global Short-Read Sequencing Industry Volume Billion Forecast, by Country 2020 & 2033
- Table 97: Brazil Short-Read Sequencing Industry Revenue (Million) Forecast, by Application 2020 & 2033
- Table 98: Brazil Short-Read Sequencing Industry Volume (Billion) Forecast, by Application 2020 & 2033
- Table 99: Argentina Short-Read Sequencing Industry Revenue (Million) Forecast, by Application 2020 & 2033
- Table 100: Argentina Short-Read Sequencing Industry Volume (Billion) Forecast, by Application 2020 & 2033
- Table 101: Rest of South America Short-Read Sequencing Industry Revenue (Million) Forecast, by Application 2020 & 2033
- Table 102: Rest of South America Short-Read Sequencing Industry Volume (Billion) Forecast, by Application 2020 & 2033
Frequently Asked Questions
1. What is the projected Compound Annual Growth Rate (CAGR) of the Short-Read Sequencing Industry?
The projected CAGR is approximately 16.40%.
2. Which companies are prominent players in the Short-Read Sequencing Industry?
Key companies in the market include Illumina Inc, Thermo Fisher Scientific Inc, BGI (Beijing Genomics Institute), Agilent Technologies, QIAGEN, F Hoffmann-La Roche Ltd, Pacific Biosciences (PacBio), 10x Geonomics, Oxford Nanopore Technologies PLC, Macrogen Inc, PerkinElmer Inc *List Not Exhaustive.
3. What are the main segments of the Short-Read Sequencing Industry?
The market segments include Product and Services, Platform, Application, End User.
4. Can you provide details about the market size?
The market size is estimated to be USD 7.90 Million as of 2022.
5. What are some drivers contributing to market growth?
Rising Demand for Precision Medicine; Continuous Advancements in Genomics Research; Cost-Effectiveness and Efficiency of Short-read Sequencing Technologies.
6. What are the notable trends driving market growth?
The Whole Genome Sequencing (WGS) Application Segment is Expected to Have a Significant Share in the Market During the Forecast Period.
7. Are there any restraints impacting market growth?
Rising Demand for Precision Medicine; Continuous Advancements in Genomics Research; Cost-Effectiveness and Efficiency of Short-read Sequencing Technologies.
8. Can you provide examples of recent developments in the market?
December 2023: Firalis Molecular Precision, a contract research organization (CRO), significantly bolstered its genomics capabilities by acquiring the cutting-edge Illumina NovaSeq X Plus Sequencing System. This system offers dual flow cell sequencing, enabling refinement and scaling-up of short-read sequencing technology.
9. What pricing options are available for accessing the report?
Pricing options include single-user, multi-user, and enterprise licenses priced at USD 4750, USD 5250, and USD 8750 respectively.
10. Is the market size provided in terms of value or volume?
The market size is provided in terms of value, measured in Million and volume, measured in Billion.
11. Are there any specific market keywords associated with the report?
Yes, the market keyword associated with the report is "Short-Read Sequencing Industry," which aids in identifying and referencing the specific market segment covered.
12. How do I determine which pricing option suits my needs best?
The pricing options vary based on user requirements and access needs. Individual users may opt for single-user licenses, while businesses requiring broader access may choose multi-user or enterprise licenses for cost-effective access to the report.
13. Are there any additional resources or data provided in the Short-Read Sequencing Industry report?
While the report offers comprehensive insights, it's advisable to review the specific contents or supplementary materials provided to ascertain if additional resources or data are available.
14. How can I stay updated on further developments or reports in the Short-Read Sequencing Industry?
To stay informed about further developments, trends, and reports in the Short-Read Sequencing Industry, consider subscribing to industry newsletters, following relevant companies and organizations, or regularly checking reputable industry news sources and publications.
Methodology
Step 1 - Identification of Relevant Samples Size from Population Database


Step 2 - Approaches for Defining Global Market Size (Value, Volume* & Price*)

Note*: In applicable scenarios
Step 3 - Data Sources
Primary Research
- Web Analytics
- Survey Reports
- Research Institute
- Latest Research Reports
- Opinion Leaders
Secondary Research
- Annual Reports
- White Paper
- Latest Press Release
- Industry Association
- Paid Database
- Investor Presentations

Step 4 - Data Triangulation
Involves using different sources of information in order to increase the validity of a study
These sources are likely to be stakeholders in a program - participants, other researchers, program staff, other community members, and so on.
Then we put all data in single framework & apply various statistical tools to find out the dynamic on the market.
During the analysis stage, feedback from the stakeholder groups would be compared to determine areas of agreement as well as areas of divergence