

Key Insights
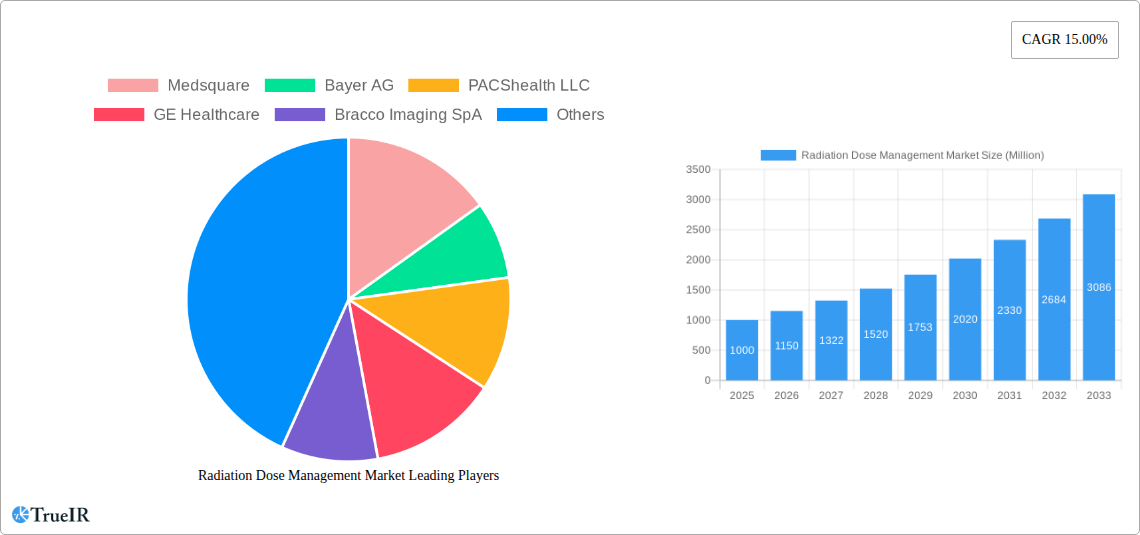
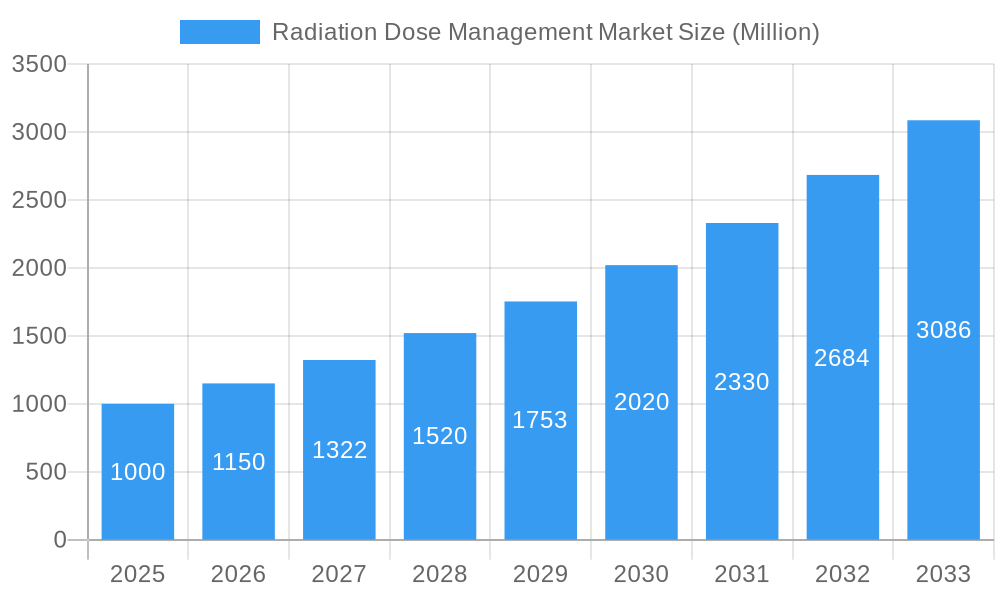
The Radiation Dose Management market is experiencing robust growth, projected to reach a significant size by 2033, driven by a 15% Compound Annual Growth Rate (CAGR) from 2025. This expansion is fueled by several key factors. Increasing awareness of radiation risks among healthcare professionals and patients is a primary driver, leading to a greater demand for effective dose management solutions. Advancements in imaging technology, coupled with the rising adoption of sophisticated software and AI-powered tools for dose optimization, further contribute to market growth. The market is segmented by end-user (ambulatory care, hospitals, others), products & services (standalone, integrated solutions, services), and modality (CT, fluoroscopy, nuclear medicine, radiography/mammography). Hospitals currently represent a substantial portion of the market due to the higher volume of imaging procedures performed. However, the ambulatory care setting is projected to witness faster growth due to increasing outpatient procedures and the adoption of advanced imaging technologies in these settings. The rising prevalence of chronic diseases necessitating frequent imaging scans also boosts market demand. While regulatory hurdles and high initial investment costs for advanced technologies pose some challenges, the long-term benefits of reduced radiation exposure and improved patient safety are expected to outweigh these restraints. Leading market players are continually investing in R&D and strategic partnerships to maintain their competitive edge and expand their product portfolios.
Radiation Dose Management Market Market Size (In Billion)
The geographic distribution of the market reveals significant regional variations. North America and Europe currently hold dominant market shares, driven by advanced healthcare infrastructure and high adoption rates of advanced imaging technologies. However, the Asia-Pacific region is anticipated to witness the fastest growth in the coming years, fueled by increasing healthcare spending, rising prevalence of chronic diseases, and expanding healthcare infrastructure. The Middle East and Africa, and South America, while presently smaller markets, are expected to experience moderate growth, driven by improving healthcare access and increasing awareness of radiation safety. The market's future trajectory suggests continued growth, driven by technological innovation, regulatory support for radiation safety, and rising demand for improved patient care. The focus on reducing unnecessary radiation exposure will be a key driver for innovation and market expansion in the coming years.
Radiation Dose Management Market Company Market Share
Radiation Dose Management Market: A Comprehensive Report (2019-2033)
This dynamic report provides a detailed analysis of the Radiation Dose Management Market, offering invaluable insights for stakeholders seeking to navigate this rapidly evolving landscape. With a comprehensive study period spanning 2019-2033, a base year of 2025, and a forecast period of 2025-2033, this report leverages rigorous data analysis and expert insights to paint a clear picture of market trends, opportunities, and challenges. The market is projected to reach xx Million by 2033, exhibiting a CAGR of xx% during the forecast period.
Radiation Dose Management Market Structure & Competitive Landscape
The Radiation Dose Management Market exhibits a moderately consolidated structure, with a handful of key players holding significant market share. The Herfindahl-Hirschman Index (HHI) is estimated at xx, suggesting a competitive yet not overly fragmented landscape. Innovation is a key driver, with companies continuously developing advanced solutions to improve dose reduction techniques and enhance patient safety. Stringent regulatory frameworks, particularly concerning radiation safety and patient data protection, significantly impact market dynamics. The market sees continuous innovation in software and hardware, with some overlap between product categories, particularly in integrated solutions. Mergers and acquisitions (M&A) activity has been moderate, with approximately xx M&A deals recorded between 2019 and 2024, driven by companies' strategic expansion and market consolidation efforts.
- Market Concentration: Moderately consolidated, HHI estimated at xx.
- Innovation Drivers: Advanced algorithms, AI-powered dose optimization, improved detector technology.
- Regulatory Impacts: Stringent radiation safety standards influence product development and market access.
- Product Substitutes: Limited direct substitutes, but alternative imaging modalities compete for market share.
- End-User Segmentation: Significant portion of the market is driven by hospitals and ambulatory care settings, with other end users contributing a smaller share.
- M&A Trends: Moderate M&A activity, xx deals observed between 2019-2024, driven by strategic growth and market consolidation.
Radiation Dose Management Market Trends & Opportunities
The Radiation Dose Management Market is experiencing robust growth, driven by the increasing prevalence of chronic diseases requiring diagnostic imaging, the rising adoption of advanced imaging techniques, and the growing awareness of radiation risks among healthcare professionals and patients. Technological advancements, such as AI-powered dose optimization tools and improved detector technology, are playing a crucial role in enhancing market penetration. Consumer preferences are shifting towards safer and more efficient radiation dose management solutions, driving demand for innovative products and services. The market is witnessing increasing collaboration between technology providers and healthcare institutions to integrate radiation dose management solutions into existing workflows. Market penetration rates for advanced dose optimization technologies are growing steadily, reaching xx% in 2024, and are projected to increase to xx% by 2033.
Dominant Markets & Segments in Radiation Dose Management Market
The North American market currently holds the largest share of the global Radiation Dose Management Market, driven by factors such as high healthcare expenditure, technological advancements, and favorable regulatory environment. Hospitals constitute the largest end-user segment, followed by ambulatory care settings. Computed Tomography (CT) is the leading modality segment, due to its widespread use and higher radiation exposure compared to other modalities. Integrated solutions dominate the product & services segment, reflecting the increasing demand for comprehensive radiation dose management systems.
Key Growth Drivers (North America):
- Advanced healthcare infrastructure and technological adoption.
- Stringent regulatory frameworks promoting radiation safety.
- High healthcare expenditure and insurance coverage.
Dominant Segments:
- By End User: Hospitals (xx Million in 2025)
- By Products & Services: Integrated Solutions (xx Million in 2025)
- By Modality: Computed Tomography (xx Million in 2025)
Radiation Dose Management Market Product Analysis
Product innovations are focused on enhancing dose reduction algorithms, improving image quality with lower radiation doses, and integrating solutions into existing imaging workflows. Standalone solutions offer targeted dose management for specific modalities, while integrated solutions provide comprehensive management across multiple imaging systems. Competitive advantages are derived from superior algorithm performance, user-friendly interfaces, seamless integration with existing healthcare IT infrastructure, and strong regulatory compliance.
Key Drivers, Barriers & Challenges in Radiation Dose Management Market
Key Drivers: Increasing awareness of radiation risks, stringent regulations promoting radiation safety, technological advancements in dose optimization algorithms and image processing techniques, and rising demand for advanced imaging procedures.
Challenges: High initial investment costs for advanced systems, the need for specialized training for healthcare professionals, integration challenges with existing imaging workflows, and ensuring cybersecurity for connected systems. The market experiences challenges related to the complexity of integrating solutions into existing healthcare IT systems, increasing the cost of implementation and potentially impacting adoption rates. Supply chain disruptions due to global events can also impact the availability of essential components, leading to project delays and increased costs.
Growth Drivers in the Radiation Dose Management Market
The market is driven by the growing awareness of radiation risks among healthcare professionals and patients, leading to a higher demand for effective dose reduction strategies. Technological advancements, particularly the development of AI-powered dose optimization algorithms, significantly improve dose reduction while maintaining image quality. Stringent government regulations and initiatives promoting radiation safety further drive market growth by mandating the adoption of dose management technologies.
Challenges Impacting Radiation Dose Management Market Growth
High implementation costs for advanced technologies can limit adoption, especially in resource-constrained healthcare settings. Integration challenges with existing healthcare information systems can hinder seamless workflow and increase implementation complexity. The need for extensive training and expertise in operating and maintaining dose management systems poses a challenge for healthcare professionals.
Key Players Shaping the Radiation Dose Management Market
Significant Radiation Dose Management Market Industry Milestones
- 2020: FDA approval of AI-powered dose optimization software by Medsquare.
- 2022: Partnership between GE Healthcare and PACShealth for integrated dose management solutions.
- 2023: Launch of a new low-dose CT scanner by Fujifilm.
- 2024: Acquisition of a smaller dose management company by Bayer AG.
Future Outlook for Radiation Dose Management Market
The Radiation Dose Management Market is poised for continued strong growth, driven by technological innovation, increasing awareness of radiation risks, and stringent regulatory frameworks. Strategic partnerships, mergers and acquisitions, and the development of AI-powered solutions are expected to further shape market dynamics. The market presents significant opportunities for companies offering innovative, cost-effective, and easily integrable solutions. The increasing integration of AI and machine learning into dose management technologies will enhance the efficiency and effectiveness of dose reduction strategies, leading to broader adoption and further market growth.
Radiation Dose Management Market Segmentation
-
1. Products & Services
- 1.1. Standalone Solutions
- 1.2. Integrated Solutions
-
2. Modality
- 2.1. Computed Tomography
- 2.2. Fluoroscopy and Interventional Imaging
- 2.3. Nuclear Medicine
- 2.4. Radiography and Mammography
-
3. End User
- 3.1. Ambulatory Care Settings
- 3.2. Hospital
- 3.3. Other End Users
Radiation Dose Management Market Segmentation By Geography
-
1. North America
- 1.1. United States
- 1.2. Canada
- 1.3. Mexico
-
2. Europe
- 2.1. Germany
- 2.2. United Kingdom
- 2.3. France
- 2.4. Italy
- 2.5. Spain
- 2.6. Rest of Europe
-
3. Asia Pacific
- 3.1. China
- 3.2. Japan
- 3.3. India
- 3.4. Australia
- 3.5. South Korea
- 3.6. Rest of Asia Pacific
-
4. Middle East and Africa
- 4.1. GCC
- 4.2. South Africa
- 4.3. Rest of Middle East and Africa
-
5. South America
- 5.1. Brazil
- 5.2. Argentina
- 5.3. Rest of South America
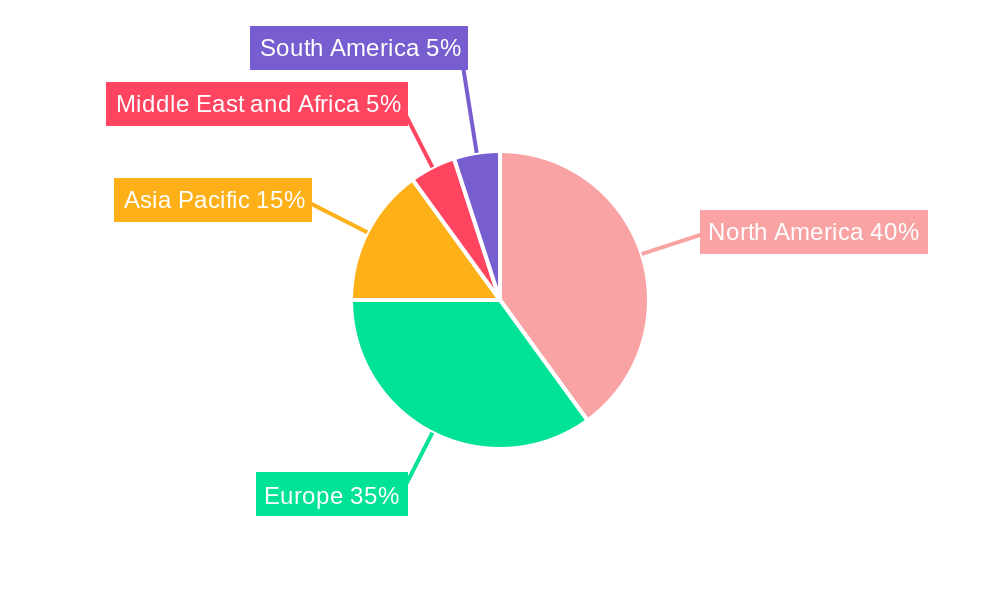
Radiation Dose Management Market Regional Market Share
Geographic Coverage of Radiation Dose Management Market
Radiation Dose Management Market REPORT HIGHLIGHTS
| Aspects | Details |
|---|---|
| Study Period | 2020-2034 |
| Base Year | 2025 |
| Estimated Year | 2026 |
| Forecast Period | 2026-2034 |
| Historical Period | 2020-2025 |
| Growth Rate | CAGR of 15.1% from 2020-2034 |
| Segmentation |
|
Table of Contents
- 1. Introduction
- 1.1. Research Scope
- 1.2. Market Segmentation
- 1.3. Research Objective
- 1.4. Definitions and Assumptions
- 2. Executive Summary
- 2.1. Market Snapshot
- 3. Market Dynamics
- 3.1. Market Drivers
- 3.2. Market Restrains
- 3.3. Market Trends
- 3.4. Market Opportunities
- 4. Market Factor Analysis
- 4.1. Porters Five Forces
- 4.1.1. Bargaining Power of Suppliers
- 4.1.2. Bargaining Power of Buyers
- 4.1.3. Threat of New Entrants
- 4.1.4. Threat of Substitutes
- 4.1.5. Competitive Rivalry
- 4.2. PESTEL analysis
- 4.3. BCG Analysis
- 4.3.1. Stars (High Growth, High Market Share)
- 4.3.2. Cash Cows (Low Growth, High Market Share)
- 4.3.3. Question Mark (High Growth, Low Market Share)
- 4.3.4. Dogs (Low Growth, Low Market Share)
- 4.4. Ansoff Matrix Analysis
- 4.5. Supply Chain Analysis
- 4.6. Regulatory Landscape
- 4.7. Current Market Potential and Opportunity Assessment (TAM–SAM–SOM Framework)
- 4.8. TIR Analyst Note
- 4.1. Porters Five Forces
- 5. Market Analysis, Insights and Forecast 2021-2033
- 5.1. Market Analysis, Insights and Forecast - by Products & Services
- 5.1.1. Standalone Solutions
- 5.1.2. Integrated Solutions
- 5.2. Market Analysis, Insights and Forecast - by Modality
- 5.2.1. Computed Tomography
- 5.2.2. Fluoroscopy and Interventional Imaging
- 5.2.3. Nuclear Medicine
- 5.2.4. Radiography and Mammography
- 5.3. Market Analysis, Insights and Forecast - by End User
- 5.3.1. Ambulatory Care Settings
- 5.3.2. Hospital
- 5.3.3. Other End Users
- 5.4. Market Analysis, Insights and Forecast - by Region
- 5.4.1. North America
- 5.4.2. Europe
- 5.4.3. Asia Pacific
- 5.4.4. Middle East and Africa
- 5.4.5. South America
- 5.1. Market Analysis, Insights and Forecast - by Products & Services
- 6. Global Radiation Dose Management Market Analysis, Insights and Forecast, 2021-2033
- 6.1. Market Analysis, Insights and Forecast - by Products & Services
- 6.1.1. Standalone Solutions
- 6.1.2. Integrated Solutions
- 6.2. Market Analysis, Insights and Forecast - by Modality
- 6.2.1. Computed Tomography
- 6.2.2. Fluoroscopy and Interventional Imaging
- 6.2.3. Nuclear Medicine
- 6.2.4. Radiography and Mammography
- 6.3. Market Analysis, Insights and Forecast - by End User
- 6.3.1. Ambulatory Care Settings
- 6.3.2. Hospital
- 6.3.3. Other End Users
- 6.1. Market Analysis, Insights and Forecast - by Products & Services
- 7. North America Radiation Dose Management Market Analysis, Insights and Forecast, 2020-2032
- 7.1. Market Analysis, Insights and Forecast - by Products & Services
- 7.1.1. Standalone Solutions
- 7.1.2. Integrated Solutions
- 7.2. Market Analysis, Insights and Forecast - by Modality
- 7.2.1. Computed Tomography
- 7.2.2. Fluoroscopy and Interventional Imaging
- 7.2.3. Nuclear Medicine
- 7.2.4. Radiography and Mammography
- 7.3. Market Analysis, Insights and Forecast - by End User
- 7.3.1. Ambulatory Care Settings
- 7.3.2. Hospital
- 7.3.3. Other End Users
- 7.1. Market Analysis, Insights and Forecast - by Products & Services
- 8. Europe Radiation Dose Management Market Analysis, Insights and Forecast, 2020-2032
- 8.1. Market Analysis, Insights and Forecast - by Products & Services
- 8.1.1. Standalone Solutions
- 8.1.2. Integrated Solutions
- 8.2. Market Analysis, Insights and Forecast - by Modality
- 8.2.1. Computed Tomography
- 8.2.2. Fluoroscopy and Interventional Imaging
- 8.2.3. Nuclear Medicine
- 8.2.4. Radiography and Mammography
- 8.3. Market Analysis, Insights and Forecast - by End User
- 8.3.1. Ambulatory Care Settings
- 8.3.2. Hospital
- 8.3.3. Other End Users
- 8.1. Market Analysis, Insights and Forecast - by Products & Services
- 9. Asia Pacific Radiation Dose Management Market Analysis, Insights and Forecast, 2020-2032
- 9.1. Market Analysis, Insights and Forecast - by Products & Services
- 9.1.1. Standalone Solutions
- 9.1.2. Integrated Solutions
- 9.2. Market Analysis, Insights and Forecast - by Modality
- 9.2.1. Computed Tomography
- 9.2.2. Fluoroscopy and Interventional Imaging
- 9.2.3. Nuclear Medicine
- 9.2.4. Radiography and Mammography
- 9.3. Market Analysis, Insights and Forecast - by End User
- 9.3.1. Ambulatory Care Settings
- 9.3.2. Hospital
- 9.3.3. Other End Users
- 9.1. Market Analysis, Insights and Forecast - by Products & Services
- 10. Middle East and Africa Radiation Dose Management Market Analysis, Insights and Forecast, 2020-2032
- 10.1. Market Analysis, Insights and Forecast - by Products & Services
- 10.1.1. Standalone Solutions
- 10.1.2. Integrated Solutions
- 10.2. Market Analysis, Insights and Forecast - by Modality
- 10.2.1. Computed Tomography
- 10.2.2. Fluoroscopy and Interventional Imaging
- 10.2.3. Nuclear Medicine
- 10.2.4. Radiography and Mammography
- 10.3. Market Analysis, Insights and Forecast - by End User
- 10.3.1. Ambulatory Care Settings
- 10.3.2. Hospital
- 10.3.3. Other End Users
- 10.1. Market Analysis, Insights and Forecast - by Products & Services
- 11. South America Radiation Dose Management Market Analysis, Insights and Forecast, 2020-2032
- 11.1. Market Analysis, Insights and Forecast - by Products & Services
- 11.1.1. Standalone Solutions
- 11.1.2. Integrated Solutions
- 11.2. Market Analysis, Insights and Forecast - by Modality
- 11.2.1. Computed Tomography
- 11.2.2. Fluoroscopy and Interventional Imaging
- 11.2.3. Nuclear Medicine
- 11.2.4. Radiography and Mammography
- 11.3. Market Analysis, Insights and Forecast - by End User
- 11.3.1. Ambulatory Care Settings
- 11.3.2. Hospital
- 11.3.3. Other End Users
- 11.1. Market Analysis, Insights and Forecast - by Products & Services
- 12. Competitive Analysis
- 12.1. Company Profiles
- 12.1.1 Medsquare
- 12.1.1.1. Company Overview
- 12.1.1.2. Products
- 12.1.1.3. Company Financials
- 12.1.1.4. SWOT Analysis
- 12.1.2 Bayer AG
- 12.1.2.1. Company Overview
- 12.1.2.2. Products
- 12.1.2.3. Company Financials
- 12.1.2.4. SWOT Analysis
- 12.1.3 PACShealth LLC
- 12.1.3.1. Company Overview
- 12.1.3.2. Products
- 12.1.3.3. Company Financials
- 12.1.3.4. SWOT Analysis
- 12.1.4 GE Healthcare
- 12.1.4.1. Company Overview
- 12.1.4.2. Products
- 12.1.4.3. Company Financials
- 12.1.4.4. SWOT Analysis
- 12.1.5 Bracco Imaging SpA
- 12.1.5.1. Company Overview
- 12.1.5.2. Products
- 12.1.5.3. Company Financials
- 12.1.5.4. SWOT Analysis
- 12.1.6 Koninklijke Philips N V
- 12.1.6.1. Company Overview
- 12.1.6.2. Products
- 12.1.6.3. Company Financials
- 12.1.6.4. SWOT Analysis
- 12.1.7 Qaelum NV
- 12.1.7.1. Company Overview
- 12.1.7.2. Products
- 12.1.7.3. Company Financials
- 12.1.7.4. SWOT Analysis
- 12.1.8 Sectra AB*List Not Exhaustive
- 12.1.8.1. Company Overview
- 12.1.8.2. Products
- 12.1.8.3. Company Financials
- 12.1.8.4. SWOT Analysis
- 12.1.9 Novarad Corporation
- 12.1.9.1. Company Overview
- 12.1.9.2. Products
- 12.1.9.3. Company Financials
- 12.1.9.4. SWOT Analysis
- 12.1.10 Fujifilm Holdings Corporation
- 12.1.10.1. Company Overview
- 12.1.10.2. Products
- 12.1.10.3. Company Financials
- 12.1.10.4. SWOT Analysis
- 12.1.1 Medsquare
- 12.2. Market Entropy
- 12.2.1 Company's Key Areas Served
- 12.2.2 Recent Developments
- 12.3. Company Market Share Analysis 2025
- 12.3.1 Top 5 Companies Market Share Analysis
- 12.3.2 Top 3 Companies Market Share Analysis
- 12.4. List of Potential Customers
- 13. Research Methodology
List of Figures
- Figure 1: Global Radiation Dose Management Market Revenue Breakdown (million, %) by Region 2025 & 2033
- Figure 2: North America Radiation Dose Management Market Revenue (million), by Products & Services 2025 & 2033
- Figure 3: North America Radiation Dose Management Market Revenue Share (%), by Products & Services 2025 & 2033
- Figure 4: North America Radiation Dose Management Market Revenue (million), by Modality 2025 & 2033
- Figure 5: North America Radiation Dose Management Market Revenue Share (%), by Modality 2025 & 2033
- Figure 6: North America Radiation Dose Management Market Revenue (million), by End User 2025 & 2033
- Figure 7: North America Radiation Dose Management Market Revenue Share (%), by End User 2025 & 2033
- Figure 8: North America Radiation Dose Management Market Revenue (million), by Country 2025 & 2033
- Figure 9: North America Radiation Dose Management Market Revenue Share (%), by Country 2025 & 2033
- Figure 10: Europe Radiation Dose Management Market Revenue (million), by Products & Services 2025 & 2033
- Figure 11: Europe Radiation Dose Management Market Revenue Share (%), by Products & Services 2025 & 2033
- Figure 12: Europe Radiation Dose Management Market Revenue (million), by Modality 2025 & 2033
- Figure 13: Europe Radiation Dose Management Market Revenue Share (%), by Modality 2025 & 2033
- Figure 14: Europe Radiation Dose Management Market Revenue (million), by End User 2025 & 2033
- Figure 15: Europe Radiation Dose Management Market Revenue Share (%), by End User 2025 & 2033
- Figure 16: Europe Radiation Dose Management Market Revenue (million), by Country 2025 & 2033
- Figure 17: Europe Radiation Dose Management Market Revenue Share (%), by Country 2025 & 2033
- Figure 18: Asia Pacific Radiation Dose Management Market Revenue (million), by Products & Services 2025 & 2033
- Figure 19: Asia Pacific Radiation Dose Management Market Revenue Share (%), by Products & Services 2025 & 2033
- Figure 20: Asia Pacific Radiation Dose Management Market Revenue (million), by Modality 2025 & 2033
- Figure 21: Asia Pacific Radiation Dose Management Market Revenue Share (%), by Modality 2025 & 2033
- Figure 22: Asia Pacific Radiation Dose Management Market Revenue (million), by End User 2025 & 2033
- Figure 23: Asia Pacific Radiation Dose Management Market Revenue Share (%), by End User 2025 & 2033
- Figure 24: Asia Pacific Radiation Dose Management Market Revenue (million), by Country 2025 & 2033
- Figure 25: Asia Pacific Radiation Dose Management Market Revenue Share (%), by Country 2025 & 2033
- Figure 26: Middle East and Africa Radiation Dose Management Market Revenue (million), by Products & Services 2025 & 2033
- Figure 27: Middle East and Africa Radiation Dose Management Market Revenue Share (%), by Products & Services 2025 & 2033
- Figure 28: Middle East and Africa Radiation Dose Management Market Revenue (million), by Modality 2025 & 2033
- Figure 29: Middle East and Africa Radiation Dose Management Market Revenue Share (%), by Modality 2025 & 2033
- Figure 30: Middle East and Africa Radiation Dose Management Market Revenue (million), by End User 2025 & 2033
- Figure 31: Middle East and Africa Radiation Dose Management Market Revenue Share (%), by End User 2025 & 2033
- Figure 32: Middle East and Africa Radiation Dose Management Market Revenue (million), by Country 2025 & 2033
- Figure 33: Middle East and Africa Radiation Dose Management Market Revenue Share (%), by Country 2025 & 2033
- Figure 34: South America Radiation Dose Management Market Revenue (million), by Products & Services 2025 & 2033
- Figure 35: South America Radiation Dose Management Market Revenue Share (%), by Products & Services 2025 & 2033
- Figure 36: South America Radiation Dose Management Market Revenue (million), by Modality 2025 & 2033
- Figure 37: South America Radiation Dose Management Market Revenue Share (%), by Modality 2025 & 2033
- Figure 38: South America Radiation Dose Management Market Revenue (million), by End User 2025 & 2033
- Figure 39: South America Radiation Dose Management Market Revenue Share (%), by End User 2025 & 2033
- Figure 40: South America Radiation Dose Management Market Revenue (million), by Country 2025 & 2033
- Figure 41: South America Radiation Dose Management Market Revenue Share (%), by Country 2025 & 2033
List of Tables
- Table 1: Global Radiation Dose Management Market Revenue million Forecast, by Products & Services 2020 & 2033
- Table 2: Global Radiation Dose Management Market Revenue million Forecast, by Modality 2020 & 2033
- Table 3: Global Radiation Dose Management Market Revenue million Forecast, by End User 2020 & 2033
- Table 4: Global Radiation Dose Management Market Revenue million Forecast, by Region 2020 & 2033
- Table 5: Global Radiation Dose Management Market Revenue million Forecast, by Products & Services 2020 & 2033
- Table 6: Global Radiation Dose Management Market Revenue million Forecast, by Modality 2020 & 2033
- Table 7: Global Radiation Dose Management Market Revenue million Forecast, by End User 2020 & 2033
- Table 8: Global Radiation Dose Management Market Revenue million Forecast, by Country 2020 & 2033
- Table 9: United States Radiation Dose Management Market Revenue (million) Forecast, by Application 2020 & 2033
- Table 10: Canada Radiation Dose Management Market Revenue (million) Forecast, by Application 2020 & 2033
- Table 11: Mexico Radiation Dose Management Market Revenue (million) Forecast, by Application 2020 & 2033
- Table 12: Global Radiation Dose Management Market Revenue million Forecast, by Products & Services 2020 & 2033
- Table 13: Global Radiation Dose Management Market Revenue million Forecast, by Modality 2020 & 2033
- Table 14: Global Radiation Dose Management Market Revenue million Forecast, by End User 2020 & 2033
- Table 15: Global Radiation Dose Management Market Revenue million Forecast, by Country 2020 & 2033
- Table 16: Germany Radiation Dose Management Market Revenue (million) Forecast, by Application 2020 & 2033
- Table 17: United Kingdom Radiation Dose Management Market Revenue (million) Forecast, by Application 2020 & 2033
- Table 18: France Radiation Dose Management Market Revenue (million) Forecast, by Application 2020 & 2033
- Table 19: Italy Radiation Dose Management Market Revenue (million) Forecast, by Application 2020 & 2033
- Table 20: Spain Radiation Dose Management Market Revenue (million) Forecast, by Application 2020 & 2033
- Table 21: Rest of Europe Radiation Dose Management Market Revenue (million) Forecast, by Application 2020 & 2033
- Table 22: Global Radiation Dose Management Market Revenue million Forecast, by Products & Services 2020 & 2033
- Table 23: Global Radiation Dose Management Market Revenue million Forecast, by Modality 2020 & 2033
- Table 24: Global Radiation Dose Management Market Revenue million Forecast, by End User 2020 & 2033
- Table 25: Global Radiation Dose Management Market Revenue million Forecast, by Country 2020 & 2033
- Table 26: China Radiation Dose Management Market Revenue (million) Forecast, by Application 2020 & 2033
- Table 27: Japan Radiation Dose Management Market Revenue (million) Forecast, by Application 2020 & 2033
- Table 28: India Radiation Dose Management Market Revenue (million) Forecast, by Application 2020 & 2033
- Table 29: Australia Radiation Dose Management Market Revenue (million) Forecast, by Application 2020 & 2033
- Table 30: South Korea Radiation Dose Management Market Revenue (million) Forecast, by Application 2020 & 2033
- Table 31: Rest of Asia Pacific Radiation Dose Management Market Revenue (million) Forecast, by Application 2020 & 2033
- Table 32: Global Radiation Dose Management Market Revenue million Forecast, by Products & Services 2020 & 2033
- Table 33: Global Radiation Dose Management Market Revenue million Forecast, by Modality 2020 & 2033
- Table 34: Global Radiation Dose Management Market Revenue million Forecast, by End User 2020 & 2033
- Table 35: Global Radiation Dose Management Market Revenue million Forecast, by Country 2020 & 2033
- Table 36: GCC Radiation Dose Management Market Revenue (million) Forecast, by Application 2020 & 2033
- Table 37: South Africa Radiation Dose Management Market Revenue (million) Forecast, by Application 2020 & 2033
- Table 38: Rest of Middle East and Africa Radiation Dose Management Market Revenue (million) Forecast, by Application 2020 & 2033
- Table 39: Global Radiation Dose Management Market Revenue million Forecast, by Products & Services 2020 & 2033
- Table 40: Global Radiation Dose Management Market Revenue million Forecast, by Modality 2020 & 2033
- Table 41: Global Radiation Dose Management Market Revenue million Forecast, by End User 2020 & 2033
- Table 42: Global Radiation Dose Management Market Revenue million Forecast, by Country 2020 & 2033
- Table 43: Brazil Radiation Dose Management Market Revenue (million) Forecast, by Application 2020 & 2033
- Table 44: Argentina Radiation Dose Management Market Revenue (million) Forecast, by Application 2020 & 2033
- Table 45: Rest of South America Radiation Dose Management Market Revenue (million) Forecast, by Application 2020 & 2033
Frequently Asked Questions
1. What is the projected Compound Annual Growth Rate (CAGR) of the Radiation Dose Management Market?
The projected CAGR is approximately 15.1%.
2. Which companies are prominent players in the Radiation Dose Management Market?
Key companies in the market include Medsquare, Bayer AG, PACShealth LLC, GE Healthcare, Bracco Imaging SpA, Koninklijke Philips N V, Qaelum NV, Sectra AB*List Not Exhaustive, Novarad Corporation, Fujifilm Holdings Corporation.
3. What are the main segments of the Radiation Dose Management Market?
The market segments include Products & Services, Modality, End User.
4. Can you provide details about the market size?
The market size is estimated to be USD 854.2 million as of 2022.
5. What are some drivers contributing to market growth?
; Rising Cases of Chronic Diseases Demanding Radiation Therapy; Increasing Concerns over Radiation Overexposure; Rising Awareness and Industry Initiatives for Radiation Dose Management.
6. What are the notable trends driving market growth?
Computed Tomography is Expected to Register Highest CAGR in the Modality Segment.
7. Are there any restraints impacting market growth?
; Low Adoption of radiation Dose Management Solutions in Emerging Countries.
8. Can you provide examples of recent developments in the market?
N/A
9. What pricing options are available for accessing the report?
Pricing options include single-user, multi-user, and enterprise licenses priced at USD 4750, USD 5250, and USD 8750 respectively.
10. Is the market size provided in terms of value or volume?
The market size is provided in terms of value, measured in million.
11. Are there any specific market keywords associated with the report?
Yes, the market keyword associated with the report is "Radiation Dose Management Market," which aids in identifying and referencing the specific market segment covered.
12. How do I determine which pricing option suits my needs best?
The pricing options vary based on user requirements and access needs. Individual users may opt for single-user licenses, while businesses requiring broader access may choose multi-user or enterprise licenses for cost-effective access to the report.
13. Are there any additional resources or data provided in the Radiation Dose Management Market report?
While the report offers comprehensive insights, it's advisable to review the specific contents or supplementary materials provided to ascertain if additional resources or data are available.
14. How can I stay updated on further developments or reports in the Radiation Dose Management Market?
To stay informed about further developments, trends, and reports in the Radiation Dose Management Market, consider subscribing to industry newsletters, following relevant companies and organizations, or regularly checking reputable industry news sources and publications.
Methodology
Step 1 - Identification of Relevant Samples Size from Population Database


Step 2 - Approaches for Defining Global Market Size (Value, Volume* & Price*)

Note*: In applicable scenarios
Step 3 - Data Sources
Primary Research
- Web Analytics
- Survey Reports
- Research Institute
- Latest Research Reports
- Opinion Leaders
Secondary Research
- Annual Reports
- White Paper
- Latest Press Release
- Industry Association
- Paid Database
- Investor Presentations

Step 4 - Data Triangulation
Involves using different sources of information in order to increase the validity of a study
These sources are likely to be stakeholders in a program - participants, other researchers, program staff, other community members, and so on.
Then we put all data in single framework & apply various statistical tools to find out the dynamic on the market.
During the analysis stage, feedback from the stakeholder groups would be compared to determine areas of agreement as well as areas of divergence