

Key Insights
The global Specialty PACS market, encompassing cardiovascular, orthopedic, and oncology solutions, is poised for significant expansion. Driven by the increasing adoption of digital imaging and the demand for efficient image management, the market is projected to reach $5.31 billion by 2025, growing at a compound annual growth rate (CAGR) of 8.5% from 2025 to 2033. Key growth drivers include the rising prevalence of chronic diseases, the need for enhanced diagnostic accuracy and clinician collaboration, and the adoption of scalable, cost-effective cloud-based PACS. Technological advancements like AI-powered image analysis and integration with healthcare IT systems further propel market growth. While initial infrastructure investment may be a consideration for smaller facilities, the long-term benefits in efficiency and patient care are substantial. Cardiovascular PACS are anticipated to hold a dominant market share. Within components, software is expected to lead, and web/cloud-based deployment models offer significant growth potential due to accessibility and reduced IT overhead. North America and Europe currently lead, with Asia-Pacific projected for substantial growth driven by healthcare infrastructure development and rising disposable incomes.
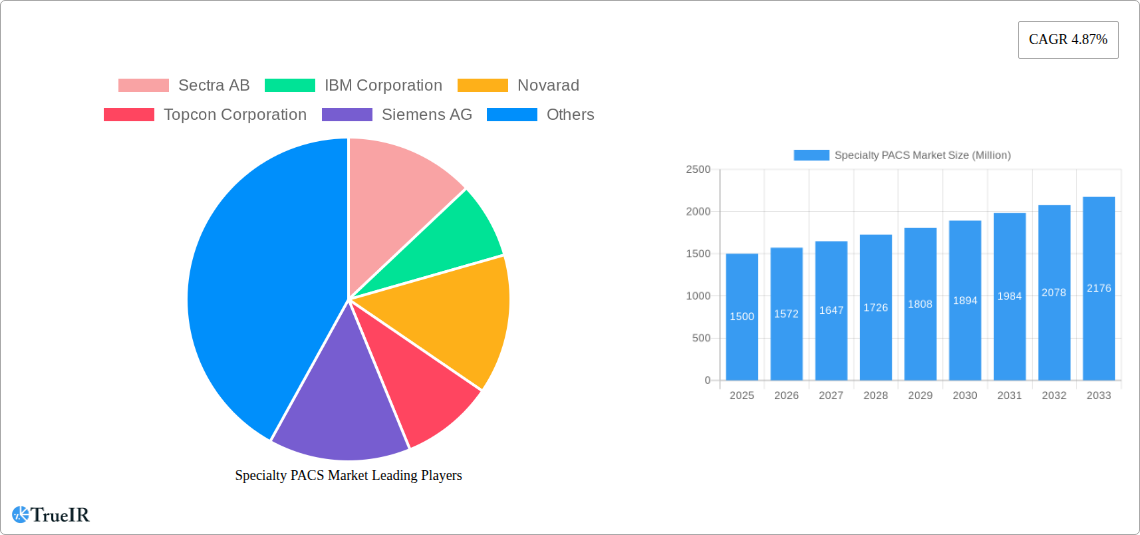
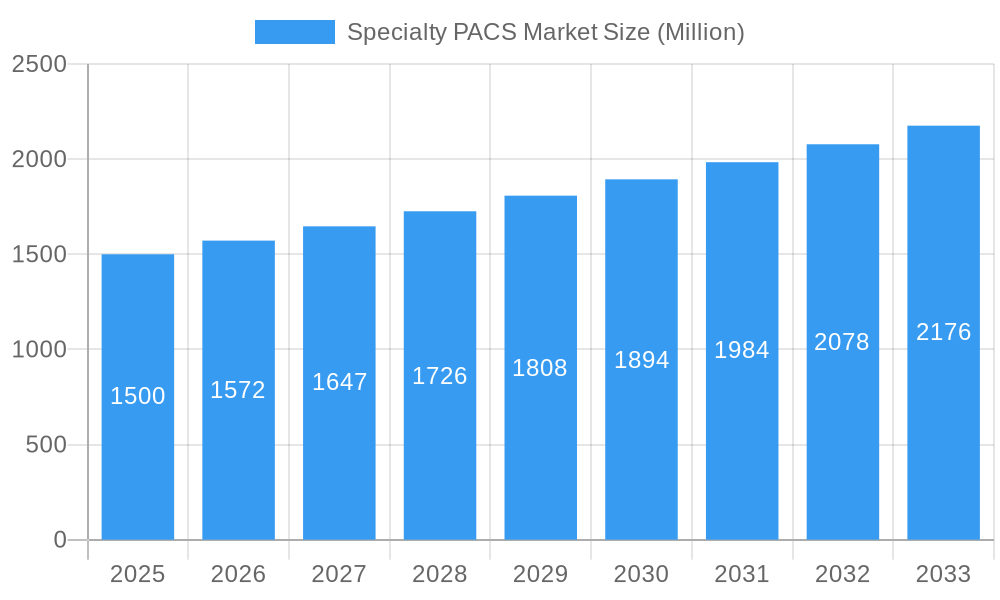
Specialty PACS Market Market Size (In Billion)
The competitive landscape features established vendors and specialized providers actively investing in R&D to enhance PACS functionality and capabilities. Future market growth hinges on regulatory approvals, telehealth adoption, integration with broader healthcare information platforms, and expanded high-speed internet infrastructure, particularly in emerging markets. Strategic partnerships and M&A activities will likely shape the competitive environment, focusing on delivering integrated solutions to meet evolving healthcare provider needs.
Specialty PACS Market Company Market Share
Specialty PACS Market Report: 2019-2033
This comprehensive report provides a detailed analysis of the Specialty PACS Market, offering invaluable insights for industry stakeholders, investors, and researchers. With a focus on market dynamics, competitive landscape, and future trends, this report covers the period from 2019 to 2033, with a base year of 2025 and a forecast period of 2025-2033. The report analyzes key segments including Cardiovascular PACS, Orthopedic PACS, Oncology PACS, and other specialty areas, across various components (Software, Services, Hardware), deployment models (On-premise, Web/Cloud-based), and end-users (Hospitals, Diagnostic Centers, Others). Major players like Sectra AB, IBM Corporation, Novarad, Topcon Corporation, Siemens AG, Philips Healthcare, Canon USA Inc, Agfa Healthcare, McKesson Corporation, and Fujifilm Holdings Corporation (Fujifilm Medical Systems) are profiled, providing a thorough understanding of the competitive landscape. The report also examines significant industry milestones and future growth potential.
Specialty PACS Market Market Structure & Competitive Landscape
The Specialty PACS market exhibits a moderately concentrated structure, with the top 5 players holding approximately xx% of the market share in 2024. This concentration is driven by significant investments in R&D, strong brand recognition, and established distribution networks. However, the market is also witnessing increased competition from smaller, specialized vendors offering innovative solutions. Innovation is a key driver, with companies continuously developing advanced features such as AI-powered image analysis, enhanced visualization tools, and improved interoperability. Regulatory compliance, particularly HIPAA and GDPR, significantly influences market dynamics, pushing vendors to prioritize data security and privacy. Product substitutes, such as cloud-based image management systems, are increasingly challenging the traditional on-premise solutions. The end-user segmentation is predominantly driven by hospitals and diagnostic centers, accounting for approximately xx% and xx% of market revenue respectively in 2024. M&A activity in the Specialty PACS market has been moderate, with xx mergers and acquisitions recorded between 2019 and 2024, primarily focusing on expanding product portfolios and market reach.
Specialty PACS Market Market Trends & Opportunities
The Specialty PACS market is experiencing robust growth, with a projected Compound Annual Growth Rate (CAGR) of xx% from 2025 to 2033, reaching a market size of $xx Million by 2033. This growth is fueled by several key trends: the increasing adoption of digital imaging technologies in healthcare; a rising prevalence of chronic diseases requiring specialized imaging; advancements in artificial intelligence (AI) and machine learning (ML) for image analysis; the growing demand for cloud-based PACS solutions that improve accessibility and collaboration; and increasing government initiatives promoting the digitalization of healthcare records. The market penetration rate for Specialty PACS in hospitals and diagnostic centers is expected to increase from xx% in 2025 to xx% by 2033, driven by factors such as improved workflow efficiency, reduced storage costs, and enhanced diagnostic accuracy. Competitive dynamics are marked by intense rivalry, with established players and emerging companies vying for market share through product innovation, strategic partnerships, and expansion into new markets. Consumer preferences are shifting towards integrated, user-friendly, and cost-effective solutions.
Dominant Markets & Segments in Specialty PACS Market
The North American region is currently the dominant market for Specialty PACS, holding approximately xx% of the global market share in 2024. This is driven by factors such as high healthcare expenditure, early adoption of advanced technologies, and the presence of major players. Within segments:
- Type: Cardiovascular PACS holds the largest market share due to the high volume of cardiac imaging procedures.
- Component: Software commands a significant portion, reflecting the increasing demand for advanced image processing and analysis tools.
- Development: Web/Cloud-based Specialty PACS is witnessing rapid growth due to its scalability, accessibility, and cost-effectiveness.
- End User: Hospitals represent the primary customer base, accounting for a significant share of market revenue.
Key growth drivers include:
- Robust healthcare infrastructure: Well-established healthcare systems in developed nations contribute to higher adoption rates.
- Favorable government policies: Initiatives promoting digital healthcare and interoperability are driving market expansion.
- Technological advancements: AI and cloud technologies are enhancing the capabilities and accessibility of PACS solutions.
Specialty PACS Market Product Analysis
Significant innovations in Specialty PACS include the integration of AI and ML algorithms for automated image analysis, improved visualization tools, enhanced interoperability with other healthcare IT systems, and the development of cloud-based platforms offering improved accessibility and scalability. These advancements enable faster and more accurate diagnoses, streamlined workflows, and reduced operational costs. Competitive advantages are gained by offering superior image quality, faster processing speeds, user-friendly interfaces, robust security features, and efficient integration with existing healthcare IT infrastructure.
Key Drivers, Barriers & Challenges in Specialty PACS Market
Key Drivers: The increasing prevalence of chronic diseases, the rising demand for improved diagnostic accuracy, the growing adoption of digital imaging technologies, and government initiatives promoting the digitalization of healthcare records are key drivers of market growth.
Challenges: High initial investment costs, the complexity of integrating PACS with existing IT infrastructure, data security concerns, and the need for ongoing maintenance and training can pose significant challenges. Furthermore, regulatory compliance requirements and the potential for vendor lock-in can also restrain market expansion. The impact of supply chain disruptions on component availability has resulted in a xx% increase in hardware prices in 2024, impacting overall market growth.
Growth Drivers in the Specialty PACS Market Market
Technological advancements like AI and cloud computing, increasing healthcare spending, the rising prevalence of chronic diseases, and favorable regulatory environments are key growth drivers.
Challenges Impacting Specialty PACS Market Growth
High initial investment costs, integration complexities, data security concerns, and regulatory hurdles are major challenges. Supply chain disruptions further exacerbate these issues, resulting in increased prices and potential delays.
Key Players Shaping the Specialty PACS Market Market
- Sectra AB
- IBM Corporation
- Novarad
- Topcon Corporation
- Siemens AG
- Philips Healthcare
- Canon USA Inc
- Agfa Healthcare
- McKesson Corporation
- Fujifilm Holdings Corporation (Fujifilm Medical Systems)
Significant Specialty PACS Market Industry Milestones
- April 2022: FUJIFILM Healthcare Americas Corporation installed Fujifilm's Synapse Cardiology PACS version 7 throughout Emory Healthcare facilities, showcasing the growing adoption of advanced PACS solutions in large healthcare systems.
- March 2022: Intelerad Medical Systems launched its new Enterprise Imaging and Informatics Suite, highlighting the increasing focus on integrated, vendor-neutral platforms for improved data management and interoperability.
Future Outlook for Specialty PACS Market Market
The Specialty PACS market is poised for continued growth, driven by technological advancements, increasing demand for improved diagnostic capabilities, and favorable regulatory environments. Strategic partnerships, product innovation, and expansion into emerging markets will be crucial for success. The integration of AI and cloud technologies will further enhance the capabilities and accessibility of PACS solutions, creating new opportunities for growth and market expansion.
Specialty PACS Market Segmentation
-
1. Type
- 1.1. Cardiovascular PACS
- 1.2. Orthopedic PACS
- 1.3. Oncology PACS
- 1.4. Other Types
-
2. Component
- 2.1. Software
- 2.2. Services
- 2.3. Hardware
-
3. Development
- 3.1. On-premise Specialty PACS
- 3.2. Web/Cloud-based Specialty PACS
-
4. End User
- 4.1. Hospitals
- 4.2. Diagnostic Centers
- 4.3. Other End Users
Specialty PACS Market Segmentation By Geography
-
1. North America
- 1.1. United States
- 1.2. Canada
- 1.3. Mexico
-
2. Europe
- 2.1. Germany
- 2.2. United Kingdom
- 2.3. France
- 2.4. Italy
- 2.5. Spain
- 2.6. Rest of Europe
-
3. Asia Pacific
- 3.1. China
- 3.2. Japan
- 3.3. India
- 3.4. Australia
- 3.5. South Korea
- 3.6. Rest of Asia Pacific
-
4. Middle East and Africa
- 4.1. GCC
- 4.2. South Africa
- 4.3. Rest of Middle East and Africa
-
5. South America
- 5.1. Brazil
- 5.2. Argentina
- 5.3. Rest of South America
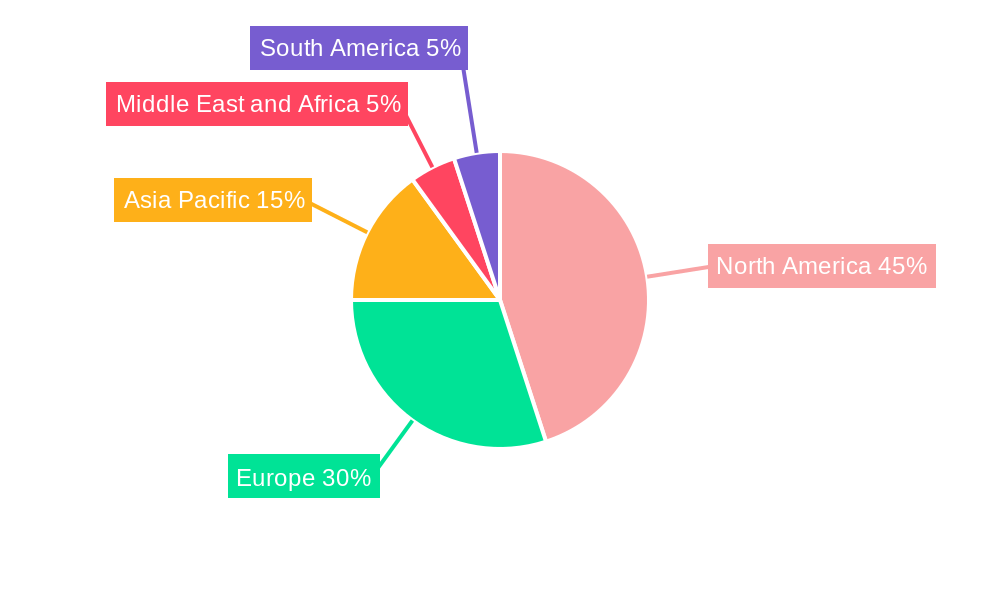
Specialty PACS Market Regional Market Share
Geographic Coverage of Specialty PACS Market
Specialty PACS Market REPORT HIGHLIGHTS
| Aspects | Details |
|---|---|
| Study Period | 2020-2034 |
| Base Year | 2025 |
| Estimated Year | 2026 |
| Forecast Period | 2026-2034 |
| Historical Period | 2020-2025 |
| Growth Rate | CAGR of 8.5% from 2020-2034 |
| Segmentation |
|
Table of Contents
- 1. Introduction
- 1.1. Research Scope
- 1.2. Market Segmentation
- 1.3. Research Objective
- 1.4. Definitions and Assumptions
- 2. Executive Summary
- 2.1. Market Snapshot
- 3. Market Dynamics
- 3.1. Market Drivers
- 3.2. Market Restrains
- 3.3. Market Trends
- 3.4. Market Opportunities
- 4. Market Factor Analysis
- 4.1. Porters Five Forces
- 4.1.1. Bargaining Power of Suppliers
- 4.1.2. Bargaining Power of Buyers
- 4.1.3. Threat of New Entrants
- 4.1.4. Threat of Substitutes
- 4.1.5. Competitive Rivalry
- 4.2. PESTEL analysis
- 4.3. BCG Analysis
- 4.3.1. Stars (High Growth, High Market Share)
- 4.3.2. Cash Cows (Low Growth, High Market Share)
- 4.3.3. Question Mark (High Growth, Low Market Share)
- 4.3.4. Dogs (Low Growth, Low Market Share)
- 4.4. Ansoff Matrix Analysis
- 4.5. Supply Chain Analysis
- 4.6. Regulatory Landscape
- 4.7. Current Market Potential and Opportunity Assessment (TAM–SAM–SOM Framework)
- 4.8. TIR Analyst Note
- 4.1. Porters Five Forces
- 5. Market Analysis, Insights and Forecast 2021-2033
- 5.1. Market Analysis, Insights and Forecast - by Type
- 5.1.1. Cardiovascular PACS
- 5.1.2. Orthopedic PACS
- 5.1.3. Oncology PACS
- 5.1.4. Other Types
- 5.2. Market Analysis, Insights and Forecast - by Component
- 5.2.1. Software
- 5.2.2. Services
- 5.2.3. Hardware
- 5.3. Market Analysis, Insights and Forecast - by Development
- 5.3.1. On-premise Specialty PACS
- 5.3.2. Web/Cloud-based Specialty PACS
- 5.4. Market Analysis, Insights and Forecast - by End User
- 5.4.1. Hospitals
- 5.4.2. Diagnostic Centers
- 5.4.3. Other End Users
- 5.5. Market Analysis, Insights and Forecast - by Region
- 5.5.1. North America
- 5.5.2. Europe
- 5.5.3. Asia Pacific
- 5.5.4. Middle East and Africa
- 5.5.5. South America
- 5.1. Market Analysis, Insights and Forecast - by Type
- 6. Global Specialty PACS Market Analysis, Insights and Forecast, 2021-2033
- 6.1. Market Analysis, Insights and Forecast - by Type
- 6.1.1. Cardiovascular PACS
- 6.1.2. Orthopedic PACS
- 6.1.3. Oncology PACS
- 6.1.4. Other Types
- 6.2. Market Analysis, Insights and Forecast - by Component
- 6.2.1. Software
- 6.2.2. Services
- 6.2.3. Hardware
- 6.3. Market Analysis, Insights and Forecast - by Development
- 6.3.1. On-premise Specialty PACS
- 6.3.2. Web/Cloud-based Specialty PACS
- 6.4. Market Analysis, Insights and Forecast - by End User
- 6.4.1. Hospitals
- 6.4.2. Diagnostic Centers
- 6.4.3. Other End Users
- 6.1. Market Analysis, Insights and Forecast - by Type
- 7. North America Specialty PACS Market Analysis, Insights and Forecast, 2020-2032
- 7.1. Market Analysis, Insights and Forecast - by Type
- 7.1.1. Cardiovascular PACS
- 7.1.2. Orthopedic PACS
- 7.1.3. Oncology PACS
- 7.1.4. Other Types
- 7.2. Market Analysis, Insights and Forecast - by Component
- 7.2.1. Software
- 7.2.2. Services
- 7.2.3. Hardware
- 7.3. Market Analysis, Insights and Forecast - by Development
- 7.3.1. On-premise Specialty PACS
- 7.3.2. Web/Cloud-based Specialty PACS
- 7.4. Market Analysis, Insights and Forecast - by End User
- 7.4.1. Hospitals
- 7.4.2. Diagnostic Centers
- 7.4.3. Other End Users
- 7.1. Market Analysis, Insights and Forecast - by Type
- 8. Europe Specialty PACS Market Analysis, Insights and Forecast, 2020-2032
- 8.1. Market Analysis, Insights and Forecast - by Type
- 8.1.1. Cardiovascular PACS
- 8.1.2. Orthopedic PACS
- 8.1.3. Oncology PACS
- 8.1.4. Other Types
- 8.2. Market Analysis, Insights and Forecast - by Component
- 8.2.1. Software
- 8.2.2. Services
- 8.2.3. Hardware
- 8.3. Market Analysis, Insights and Forecast - by Development
- 8.3.1. On-premise Specialty PACS
- 8.3.2. Web/Cloud-based Specialty PACS
- 8.4. Market Analysis, Insights and Forecast - by End User
- 8.4.1. Hospitals
- 8.4.2. Diagnostic Centers
- 8.4.3. Other End Users
- 8.1. Market Analysis, Insights and Forecast - by Type
- 9. Asia Pacific Specialty PACS Market Analysis, Insights and Forecast, 2020-2032
- 9.1. Market Analysis, Insights and Forecast - by Type
- 9.1.1. Cardiovascular PACS
- 9.1.2. Orthopedic PACS
- 9.1.3. Oncology PACS
- 9.1.4. Other Types
- 9.2. Market Analysis, Insights and Forecast - by Component
- 9.2.1. Software
- 9.2.2. Services
- 9.2.3. Hardware
- 9.3. Market Analysis, Insights and Forecast - by Development
- 9.3.1. On-premise Specialty PACS
- 9.3.2. Web/Cloud-based Specialty PACS
- 9.4. Market Analysis, Insights and Forecast - by End User
- 9.4.1. Hospitals
- 9.4.2. Diagnostic Centers
- 9.4.3. Other End Users
- 9.1. Market Analysis, Insights and Forecast - by Type
- 10. Middle East and Africa Specialty PACS Market Analysis, Insights and Forecast, 2020-2032
- 10.1. Market Analysis, Insights and Forecast - by Type
- 10.1.1. Cardiovascular PACS
- 10.1.2. Orthopedic PACS
- 10.1.3. Oncology PACS
- 10.1.4. Other Types
- 10.2. Market Analysis, Insights and Forecast - by Component
- 10.2.1. Software
- 10.2.2. Services
- 10.2.3. Hardware
- 10.3. Market Analysis, Insights and Forecast - by Development
- 10.3.1. On-premise Specialty PACS
- 10.3.2. Web/Cloud-based Specialty PACS
- 10.4. Market Analysis, Insights and Forecast - by End User
- 10.4.1. Hospitals
- 10.4.2. Diagnostic Centers
- 10.4.3. Other End Users
- 10.1. Market Analysis, Insights and Forecast - by Type
- 11. South America Specialty PACS Market Analysis, Insights and Forecast, 2020-2032
- 11.1. Market Analysis, Insights and Forecast - by Type
- 11.1.1. Cardiovascular PACS
- 11.1.2. Orthopedic PACS
- 11.1.3. Oncology PACS
- 11.1.4. Other Types
- 11.2. Market Analysis, Insights and Forecast - by Component
- 11.2.1. Software
- 11.2.2. Services
- 11.2.3. Hardware
- 11.3. Market Analysis, Insights and Forecast - by Development
- 11.3.1. On-premise Specialty PACS
- 11.3.2. Web/Cloud-based Specialty PACS
- 11.4. Market Analysis, Insights and Forecast - by End User
- 11.4.1. Hospitals
- 11.4.2. Diagnostic Centers
- 11.4.3. Other End Users
- 11.1. Market Analysis, Insights and Forecast - by Type
- 12. Competitive Analysis
- 12.1. Company Profiles
- 12.1.1 Sectra AB
- 12.1.1.1. Company Overview
- 12.1.1.2. Products
- 12.1.1.3. Company Financials
- 12.1.1.4. SWOT Analysis
- 12.1.2 IBM Corporation
- 12.1.2.1. Company Overview
- 12.1.2.2. Products
- 12.1.2.3. Company Financials
- 12.1.2.4. SWOT Analysis
- 12.1.3 Novarad
- 12.1.3.1. Company Overview
- 12.1.3.2. Products
- 12.1.3.3. Company Financials
- 12.1.3.4. SWOT Analysis
- 12.1.4 Topcon Corporation
- 12.1.4.1. Company Overview
- 12.1.4.2. Products
- 12.1.4.3. Company Financials
- 12.1.4.4. SWOT Analysis
- 12.1.5 Siemens AG
- 12.1.5.1. Company Overview
- 12.1.5.2. Products
- 12.1.5.3. Company Financials
- 12.1.5.4. SWOT Analysis
- 12.1.6 Philips Healthcare
- 12.1.6.1. Company Overview
- 12.1.6.2. Products
- 12.1.6.3. Company Financials
- 12.1.6.4. SWOT Analysis
- 12.1.7 Canon USA Inc
- 12.1.7.1. Company Overview
- 12.1.7.2. Products
- 12.1.7.3. Company Financials
- 12.1.7.4. SWOT Analysis
- 12.1.8 Agfa Healthcare
- 12.1.8.1. Company Overview
- 12.1.8.2. Products
- 12.1.8.3. Company Financials
- 12.1.8.4. SWOT Analysis
- 12.1.9 McKesson Corporation
- 12.1.9.1. Company Overview
- 12.1.9.2. Products
- 12.1.9.3. Company Financials
- 12.1.9.4. SWOT Analysis
- 12.1.10 Fujifilm Holdings Corporation (Fujifilm Medical Systems)
- 12.1.10.1. Company Overview
- 12.1.10.2. Products
- 12.1.10.3. Company Financials
- 12.1.10.4. SWOT Analysis
- 12.1.1 Sectra AB
- 12.2. Market Entropy
- 12.2.1 Company's Key Areas Served
- 12.2.2 Recent Developments
- 12.3. Company Market Share Analysis 2025
- 12.3.1 Top 5 Companies Market Share Analysis
- 12.3.2 Top 3 Companies Market Share Analysis
- 12.4. List of Potential Customers
- 13. Research Methodology
List of Figures
- Figure 1: Global Specialty PACS Market Revenue Breakdown (billion, %) by Region 2025 & 2033
- Figure 2: Global Specialty PACS Market Volume Breakdown (K Unit, %) by Region 2025 & 2033
- Figure 3: North America Specialty PACS Market Revenue (billion), by Type 2025 & 2033
- Figure 4: North America Specialty PACS Market Volume (K Unit), by Type 2025 & 2033
- Figure 5: North America Specialty PACS Market Revenue Share (%), by Type 2025 & 2033
- Figure 6: North America Specialty PACS Market Volume Share (%), by Type 2025 & 2033
- Figure 7: North America Specialty PACS Market Revenue (billion), by Component 2025 & 2033
- Figure 8: North America Specialty PACS Market Volume (K Unit), by Component 2025 & 2033
- Figure 9: North America Specialty PACS Market Revenue Share (%), by Component 2025 & 2033
- Figure 10: North America Specialty PACS Market Volume Share (%), by Component 2025 & 2033
- Figure 11: North America Specialty PACS Market Revenue (billion), by Development 2025 & 2033
- Figure 12: North America Specialty PACS Market Volume (K Unit), by Development 2025 & 2033
- Figure 13: North America Specialty PACS Market Revenue Share (%), by Development 2025 & 2033
- Figure 14: North America Specialty PACS Market Volume Share (%), by Development 2025 & 2033
- Figure 15: North America Specialty PACS Market Revenue (billion), by End User 2025 & 2033
- Figure 16: North America Specialty PACS Market Volume (K Unit), by End User 2025 & 2033
- Figure 17: North America Specialty PACS Market Revenue Share (%), by End User 2025 & 2033
- Figure 18: North America Specialty PACS Market Volume Share (%), by End User 2025 & 2033
- Figure 19: North America Specialty PACS Market Revenue (billion), by Country 2025 & 2033
- Figure 20: North America Specialty PACS Market Volume (K Unit), by Country 2025 & 2033
- Figure 21: North America Specialty PACS Market Revenue Share (%), by Country 2025 & 2033
- Figure 22: North America Specialty PACS Market Volume Share (%), by Country 2025 & 2033
- Figure 23: Europe Specialty PACS Market Revenue (billion), by Type 2025 & 2033
- Figure 24: Europe Specialty PACS Market Volume (K Unit), by Type 2025 & 2033
- Figure 25: Europe Specialty PACS Market Revenue Share (%), by Type 2025 & 2033
- Figure 26: Europe Specialty PACS Market Volume Share (%), by Type 2025 & 2033
- Figure 27: Europe Specialty PACS Market Revenue (billion), by Component 2025 & 2033
- Figure 28: Europe Specialty PACS Market Volume (K Unit), by Component 2025 & 2033
- Figure 29: Europe Specialty PACS Market Revenue Share (%), by Component 2025 & 2033
- Figure 30: Europe Specialty PACS Market Volume Share (%), by Component 2025 & 2033
- Figure 31: Europe Specialty PACS Market Revenue (billion), by Development 2025 & 2033
- Figure 32: Europe Specialty PACS Market Volume (K Unit), by Development 2025 & 2033
- Figure 33: Europe Specialty PACS Market Revenue Share (%), by Development 2025 & 2033
- Figure 34: Europe Specialty PACS Market Volume Share (%), by Development 2025 & 2033
- Figure 35: Europe Specialty PACS Market Revenue (billion), by End User 2025 & 2033
- Figure 36: Europe Specialty PACS Market Volume (K Unit), by End User 2025 & 2033
- Figure 37: Europe Specialty PACS Market Revenue Share (%), by End User 2025 & 2033
- Figure 38: Europe Specialty PACS Market Volume Share (%), by End User 2025 & 2033
- Figure 39: Europe Specialty PACS Market Revenue (billion), by Country 2025 & 2033
- Figure 40: Europe Specialty PACS Market Volume (K Unit), by Country 2025 & 2033
- Figure 41: Europe Specialty PACS Market Revenue Share (%), by Country 2025 & 2033
- Figure 42: Europe Specialty PACS Market Volume Share (%), by Country 2025 & 2033
- Figure 43: Asia Pacific Specialty PACS Market Revenue (billion), by Type 2025 & 2033
- Figure 44: Asia Pacific Specialty PACS Market Volume (K Unit), by Type 2025 & 2033
- Figure 45: Asia Pacific Specialty PACS Market Revenue Share (%), by Type 2025 & 2033
- Figure 46: Asia Pacific Specialty PACS Market Volume Share (%), by Type 2025 & 2033
- Figure 47: Asia Pacific Specialty PACS Market Revenue (billion), by Component 2025 & 2033
- Figure 48: Asia Pacific Specialty PACS Market Volume (K Unit), by Component 2025 & 2033
- Figure 49: Asia Pacific Specialty PACS Market Revenue Share (%), by Component 2025 & 2033
- Figure 50: Asia Pacific Specialty PACS Market Volume Share (%), by Component 2025 & 2033
- Figure 51: Asia Pacific Specialty PACS Market Revenue (billion), by Development 2025 & 2033
- Figure 52: Asia Pacific Specialty PACS Market Volume (K Unit), by Development 2025 & 2033
- Figure 53: Asia Pacific Specialty PACS Market Revenue Share (%), by Development 2025 & 2033
- Figure 54: Asia Pacific Specialty PACS Market Volume Share (%), by Development 2025 & 2033
- Figure 55: Asia Pacific Specialty PACS Market Revenue (billion), by End User 2025 & 2033
- Figure 56: Asia Pacific Specialty PACS Market Volume (K Unit), by End User 2025 & 2033
- Figure 57: Asia Pacific Specialty PACS Market Revenue Share (%), by End User 2025 & 2033
- Figure 58: Asia Pacific Specialty PACS Market Volume Share (%), by End User 2025 & 2033
- Figure 59: Asia Pacific Specialty PACS Market Revenue (billion), by Country 2025 & 2033
- Figure 60: Asia Pacific Specialty PACS Market Volume (K Unit), by Country 2025 & 2033
- Figure 61: Asia Pacific Specialty PACS Market Revenue Share (%), by Country 2025 & 2033
- Figure 62: Asia Pacific Specialty PACS Market Volume Share (%), by Country 2025 & 2033
- Figure 63: Middle East and Africa Specialty PACS Market Revenue (billion), by Type 2025 & 2033
- Figure 64: Middle East and Africa Specialty PACS Market Volume (K Unit), by Type 2025 & 2033
- Figure 65: Middle East and Africa Specialty PACS Market Revenue Share (%), by Type 2025 & 2033
- Figure 66: Middle East and Africa Specialty PACS Market Volume Share (%), by Type 2025 & 2033
- Figure 67: Middle East and Africa Specialty PACS Market Revenue (billion), by Component 2025 & 2033
- Figure 68: Middle East and Africa Specialty PACS Market Volume (K Unit), by Component 2025 & 2033
- Figure 69: Middle East and Africa Specialty PACS Market Revenue Share (%), by Component 2025 & 2033
- Figure 70: Middle East and Africa Specialty PACS Market Volume Share (%), by Component 2025 & 2033
- Figure 71: Middle East and Africa Specialty PACS Market Revenue (billion), by Development 2025 & 2033
- Figure 72: Middle East and Africa Specialty PACS Market Volume (K Unit), by Development 2025 & 2033
- Figure 73: Middle East and Africa Specialty PACS Market Revenue Share (%), by Development 2025 & 2033
- Figure 74: Middle East and Africa Specialty PACS Market Volume Share (%), by Development 2025 & 2033
- Figure 75: Middle East and Africa Specialty PACS Market Revenue (billion), by End User 2025 & 2033
- Figure 76: Middle East and Africa Specialty PACS Market Volume (K Unit), by End User 2025 & 2033
- Figure 77: Middle East and Africa Specialty PACS Market Revenue Share (%), by End User 2025 & 2033
- Figure 78: Middle East and Africa Specialty PACS Market Volume Share (%), by End User 2025 & 2033
- Figure 79: Middle East and Africa Specialty PACS Market Revenue (billion), by Country 2025 & 2033
- Figure 80: Middle East and Africa Specialty PACS Market Volume (K Unit), by Country 2025 & 2033
- Figure 81: Middle East and Africa Specialty PACS Market Revenue Share (%), by Country 2025 & 2033
- Figure 82: Middle East and Africa Specialty PACS Market Volume Share (%), by Country 2025 & 2033
- Figure 83: South America Specialty PACS Market Revenue (billion), by Type 2025 & 2033
- Figure 84: South America Specialty PACS Market Volume (K Unit), by Type 2025 & 2033
- Figure 85: South America Specialty PACS Market Revenue Share (%), by Type 2025 & 2033
- Figure 86: South America Specialty PACS Market Volume Share (%), by Type 2025 & 2033
- Figure 87: South America Specialty PACS Market Revenue (billion), by Component 2025 & 2033
- Figure 88: South America Specialty PACS Market Volume (K Unit), by Component 2025 & 2033
- Figure 89: South America Specialty PACS Market Revenue Share (%), by Component 2025 & 2033
- Figure 90: South America Specialty PACS Market Volume Share (%), by Component 2025 & 2033
- Figure 91: South America Specialty PACS Market Revenue (billion), by Development 2025 & 2033
- Figure 92: South America Specialty PACS Market Volume (K Unit), by Development 2025 & 2033
- Figure 93: South America Specialty PACS Market Revenue Share (%), by Development 2025 & 2033
- Figure 94: South America Specialty PACS Market Volume Share (%), by Development 2025 & 2033
- Figure 95: South America Specialty PACS Market Revenue (billion), by End User 2025 & 2033
- Figure 96: South America Specialty PACS Market Volume (K Unit), by End User 2025 & 2033
- Figure 97: South America Specialty PACS Market Revenue Share (%), by End User 2025 & 2033
- Figure 98: South America Specialty PACS Market Volume Share (%), by End User 2025 & 2033
- Figure 99: South America Specialty PACS Market Revenue (billion), by Country 2025 & 2033
- Figure 100: South America Specialty PACS Market Volume (K Unit), by Country 2025 & 2033
- Figure 101: South America Specialty PACS Market Revenue Share (%), by Country 2025 & 2033
- Figure 102: South America Specialty PACS Market Volume Share (%), by Country 2025 & 2033
List of Tables
- Table 1: Global Specialty PACS Market Revenue billion Forecast, by Type 2020 & 2033
- Table 2: Global Specialty PACS Market Volume K Unit Forecast, by Type 2020 & 2033
- Table 3: Global Specialty PACS Market Revenue billion Forecast, by Component 2020 & 2033
- Table 4: Global Specialty PACS Market Volume K Unit Forecast, by Component 2020 & 2033
- Table 5: Global Specialty PACS Market Revenue billion Forecast, by Development 2020 & 2033
- Table 6: Global Specialty PACS Market Volume K Unit Forecast, by Development 2020 & 2033
- Table 7: Global Specialty PACS Market Revenue billion Forecast, by End User 2020 & 2033
- Table 8: Global Specialty PACS Market Volume K Unit Forecast, by End User 2020 & 2033
- Table 9: Global Specialty PACS Market Revenue billion Forecast, by Region 2020 & 2033
- Table 10: Global Specialty PACS Market Volume K Unit Forecast, by Region 2020 & 2033
- Table 11: Global Specialty PACS Market Revenue billion Forecast, by Type 2020 & 2033
- Table 12: Global Specialty PACS Market Volume K Unit Forecast, by Type 2020 & 2033
- Table 13: Global Specialty PACS Market Revenue billion Forecast, by Component 2020 & 2033
- Table 14: Global Specialty PACS Market Volume K Unit Forecast, by Component 2020 & 2033
- Table 15: Global Specialty PACS Market Revenue billion Forecast, by Development 2020 & 2033
- Table 16: Global Specialty PACS Market Volume K Unit Forecast, by Development 2020 & 2033
- Table 17: Global Specialty PACS Market Revenue billion Forecast, by End User 2020 & 2033
- Table 18: Global Specialty PACS Market Volume K Unit Forecast, by End User 2020 & 2033
- Table 19: Global Specialty PACS Market Revenue billion Forecast, by Country 2020 & 2033
- Table 20: Global Specialty PACS Market Volume K Unit Forecast, by Country 2020 & 2033
- Table 21: United States Specialty PACS Market Revenue (billion) Forecast, by Application 2020 & 2033
- Table 22: United States Specialty PACS Market Volume (K Unit) Forecast, by Application 2020 & 2033
- Table 23: Canada Specialty PACS Market Revenue (billion) Forecast, by Application 2020 & 2033
- Table 24: Canada Specialty PACS Market Volume (K Unit) Forecast, by Application 2020 & 2033
- Table 25: Mexico Specialty PACS Market Revenue (billion) Forecast, by Application 2020 & 2033
- Table 26: Mexico Specialty PACS Market Volume (K Unit) Forecast, by Application 2020 & 2033
- Table 27: Global Specialty PACS Market Revenue billion Forecast, by Type 2020 & 2033
- Table 28: Global Specialty PACS Market Volume K Unit Forecast, by Type 2020 & 2033
- Table 29: Global Specialty PACS Market Revenue billion Forecast, by Component 2020 & 2033
- Table 30: Global Specialty PACS Market Volume K Unit Forecast, by Component 2020 & 2033
- Table 31: Global Specialty PACS Market Revenue billion Forecast, by Development 2020 & 2033
- Table 32: Global Specialty PACS Market Volume K Unit Forecast, by Development 2020 & 2033
- Table 33: Global Specialty PACS Market Revenue billion Forecast, by End User 2020 & 2033
- Table 34: Global Specialty PACS Market Volume K Unit Forecast, by End User 2020 & 2033
- Table 35: Global Specialty PACS Market Revenue billion Forecast, by Country 2020 & 2033
- Table 36: Global Specialty PACS Market Volume K Unit Forecast, by Country 2020 & 2033
- Table 37: Germany Specialty PACS Market Revenue (billion) Forecast, by Application 2020 & 2033
- Table 38: Germany Specialty PACS Market Volume (K Unit) Forecast, by Application 2020 & 2033
- Table 39: United Kingdom Specialty PACS Market Revenue (billion) Forecast, by Application 2020 & 2033
- Table 40: United Kingdom Specialty PACS Market Volume (K Unit) Forecast, by Application 2020 & 2033
- Table 41: France Specialty PACS Market Revenue (billion) Forecast, by Application 2020 & 2033
- Table 42: France Specialty PACS Market Volume (K Unit) Forecast, by Application 2020 & 2033
- Table 43: Italy Specialty PACS Market Revenue (billion) Forecast, by Application 2020 & 2033
- Table 44: Italy Specialty PACS Market Volume (K Unit) Forecast, by Application 2020 & 2033
- Table 45: Spain Specialty PACS Market Revenue (billion) Forecast, by Application 2020 & 2033
- Table 46: Spain Specialty PACS Market Volume (K Unit) Forecast, by Application 2020 & 2033
- Table 47: Rest of Europe Specialty PACS Market Revenue (billion) Forecast, by Application 2020 & 2033
- Table 48: Rest of Europe Specialty PACS Market Volume (K Unit) Forecast, by Application 2020 & 2033
- Table 49: Global Specialty PACS Market Revenue billion Forecast, by Type 2020 & 2033
- Table 50: Global Specialty PACS Market Volume K Unit Forecast, by Type 2020 & 2033
- Table 51: Global Specialty PACS Market Revenue billion Forecast, by Component 2020 & 2033
- Table 52: Global Specialty PACS Market Volume K Unit Forecast, by Component 2020 & 2033
- Table 53: Global Specialty PACS Market Revenue billion Forecast, by Development 2020 & 2033
- Table 54: Global Specialty PACS Market Volume K Unit Forecast, by Development 2020 & 2033
- Table 55: Global Specialty PACS Market Revenue billion Forecast, by End User 2020 & 2033
- Table 56: Global Specialty PACS Market Volume K Unit Forecast, by End User 2020 & 2033
- Table 57: Global Specialty PACS Market Revenue billion Forecast, by Country 2020 & 2033
- Table 58: Global Specialty PACS Market Volume K Unit Forecast, by Country 2020 & 2033
- Table 59: China Specialty PACS Market Revenue (billion) Forecast, by Application 2020 & 2033
- Table 60: China Specialty PACS Market Volume (K Unit) Forecast, by Application 2020 & 2033
- Table 61: Japan Specialty PACS Market Revenue (billion) Forecast, by Application 2020 & 2033
- Table 62: Japan Specialty PACS Market Volume (K Unit) Forecast, by Application 2020 & 2033
- Table 63: India Specialty PACS Market Revenue (billion) Forecast, by Application 2020 & 2033
- Table 64: India Specialty PACS Market Volume (K Unit) Forecast, by Application 2020 & 2033
- Table 65: Australia Specialty PACS Market Revenue (billion) Forecast, by Application 2020 & 2033
- Table 66: Australia Specialty PACS Market Volume (K Unit) Forecast, by Application 2020 & 2033
- Table 67: South Korea Specialty PACS Market Revenue (billion) Forecast, by Application 2020 & 2033
- Table 68: South Korea Specialty PACS Market Volume (K Unit) Forecast, by Application 2020 & 2033
- Table 69: Rest of Asia Pacific Specialty PACS Market Revenue (billion) Forecast, by Application 2020 & 2033
- Table 70: Rest of Asia Pacific Specialty PACS Market Volume (K Unit) Forecast, by Application 2020 & 2033
- Table 71: Global Specialty PACS Market Revenue billion Forecast, by Type 2020 & 2033
- Table 72: Global Specialty PACS Market Volume K Unit Forecast, by Type 2020 & 2033
- Table 73: Global Specialty PACS Market Revenue billion Forecast, by Component 2020 & 2033
- Table 74: Global Specialty PACS Market Volume K Unit Forecast, by Component 2020 & 2033
- Table 75: Global Specialty PACS Market Revenue billion Forecast, by Development 2020 & 2033
- Table 76: Global Specialty PACS Market Volume K Unit Forecast, by Development 2020 & 2033
- Table 77: Global Specialty PACS Market Revenue billion Forecast, by End User 2020 & 2033
- Table 78: Global Specialty PACS Market Volume K Unit Forecast, by End User 2020 & 2033
- Table 79: Global Specialty PACS Market Revenue billion Forecast, by Country 2020 & 2033
- Table 80: Global Specialty PACS Market Volume K Unit Forecast, by Country 2020 & 2033
- Table 81: GCC Specialty PACS Market Revenue (billion) Forecast, by Application 2020 & 2033
- Table 82: GCC Specialty PACS Market Volume (K Unit) Forecast, by Application 2020 & 2033
- Table 83: South Africa Specialty PACS Market Revenue (billion) Forecast, by Application 2020 & 2033
- Table 84: South Africa Specialty PACS Market Volume (K Unit) Forecast, by Application 2020 & 2033
- Table 85: Rest of Middle East and Africa Specialty PACS Market Revenue (billion) Forecast, by Application 2020 & 2033
- Table 86: Rest of Middle East and Africa Specialty PACS Market Volume (K Unit) Forecast, by Application 2020 & 2033
- Table 87: Global Specialty PACS Market Revenue billion Forecast, by Type 2020 & 2033
- Table 88: Global Specialty PACS Market Volume K Unit Forecast, by Type 2020 & 2033
- Table 89: Global Specialty PACS Market Revenue billion Forecast, by Component 2020 & 2033
- Table 90: Global Specialty PACS Market Volume K Unit Forecast, by Component 2020 & 2033
- Table 91: Global Specialty PACS Market Revenue billion Forecast, by Development 2020 & 2033
- Table 92: Global Specialty PACS Market Volume K Unit Forecast, by Development 2020 & 2033
- Table 93: Global Specialty PACS Market Revenue billion Forecast, by End User 2020 & 2033
- Table 94: Global Specialty PACS Market Volume K Unit Forecast, by End User 2020 & 2033
- Table 95: Global Specialty PACS Market Revenue billion Forecast, by Country 2020 & 2033
- Table 96: Global Specialty PACS Market Volume K Unit Forecast, by Country 2020 & 2033
- Table 97: Brazil Specialty PACS Market Revenue (billion) Forecast, by Application 2020 & 2033
- Table 98: Brazil Specialty PACS Market Volume (K Unit) Forecast, by Application 2020 & 2033
- Table 99: Argentina Specialty PACS Market Revenue (billion) Forecast, by Application 2020 & 2033
- Table 100: Argentina Specialty PACS Market Volume (K Unit) Forecast, by Application 2020 & 2033
- Table 101: Rest of South America Specialty PACS Market Revenue (billion) Forecast, by Application 2020 & 2033
- Table 102: Rest of South America Specialty PACS Market Volume (K Unit) Forecast, by Application 2020 & 2033
Frequently Asked Questions
1. What is the projected Compound Annual Growth Rate (CAGR) of the Specialty PACS Market?
The projected CAGR is approximately 8.5%.
2. Which companies are prominent players in the Specialty PACS Market?
Key companies in the market include Sectra AB, IBM Corporation, Novarad, Topcon Corporation, Siemens AG, Philips Healthcare, Canon USA Inc, Agfa Healthcare, McKesson Corporation, Fujifilm Holdings Corporation (Fujifilm Medical Systems).
3. What are the main segments of the Specialty PACS Market?
The market segments include Type, Component, Development, End User.
4. Can you provide details about the market size?
The market size is estimated to be USD 5.31 billion as of 2022.
5. What are some drivers contributing to market growth?
Growing Use of Imaging Devices; Growing Burden of Chronic Diseases.
6. What are the notable trends driving market growth?
On-premise Specialty PACS are Expected to Hold the Largest Market Share in the Specialty PACS Market.
7. Are there any restraints impacting market growth?
Data Security and Privacy Issues.
8. Can you provide examples of recent developments in the market?
April 2022: FUJIFILM Healthcare Americas Corporation installed Fujifilm's Synapse Cardiology PACS version 7 throughout Emory Healthcare facilities to store, process, and analyze heart and vascular imaging. Emory Healthcare is the most comprehensive academic health system in Georgia.
9. What pricing options are available for accessing the report?
Pricing options include single-user, multi-user, and enterprise licenses priced at USD 4750, USD 5250, and USD 8750 respectively.
10. Is the market size provided in terms of value or volume?
The market size is provided in terms of value, measured in billion and volume, measured in K Unit.
11. Are there any specific market keywords associated with the report?
Yes, the market keyword associated with the report is "Specialty PACS Market," which aids in identifying and referencing the specific market segment covered.
12. How do I determine which pricing option suits my needs best?
The pricing options vary based on user requirements and access needs. Individual users may opt for single-user licenses, while businesses requiring broader access may choose multi-user or enterprise licenses for cost-effective access to the report.
13. Are there any additional resources or data provided in the Specialty PACS Market report?
While the report offers comprehensive insights, it's advisable to review the specific contents or supplementary materials provided to ascertain if additional resources or data are available.
14. How can I stay updated on further developments or reports in the Specialty PACS Market?
To stay informed about further developments, trends, and reports in the Specialty PACS Market, consider subscribing to industry newsletters, following relevant companies and organizations, or regularly checking reputable industry news sources and publications.
Methodology
Step 1 - Identification of Relevant Samples Size from Population Database


Step 2 - Approaches for Defining Global Market Size (Value, Volume* & Price*)

Note*: In applicable scenarios
Step 3 - Data Sources
Primary Research
- Web Analytics
- Survey Reports
- Research Institute
- Latest Research Reports
- Opinion Leaders
Secondary Research
- Annual Reports
- White Paper
- Latest Press Release
- Industry Association
- Paid Database
- Investor Presentations

Step 4 - Data Triangulation
Involves using different sources of information in order to increase the validity of a study
These sources are likely to be stakeholders in a program - participants, other researchers, program staff, other community members, and so on.
Then we put all data in single framework & apply various statistical tools to find out the dynamic on the market.
During the analysis stage, feedback from the stakeholder groups would be compared to determine areas of agreement as well as areas of divergence