

Key Insights
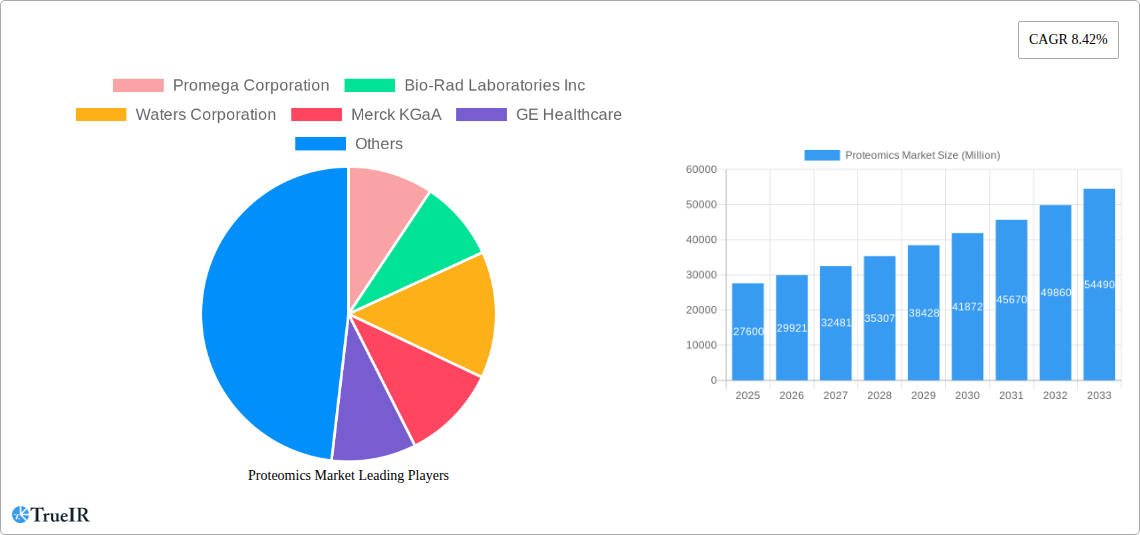
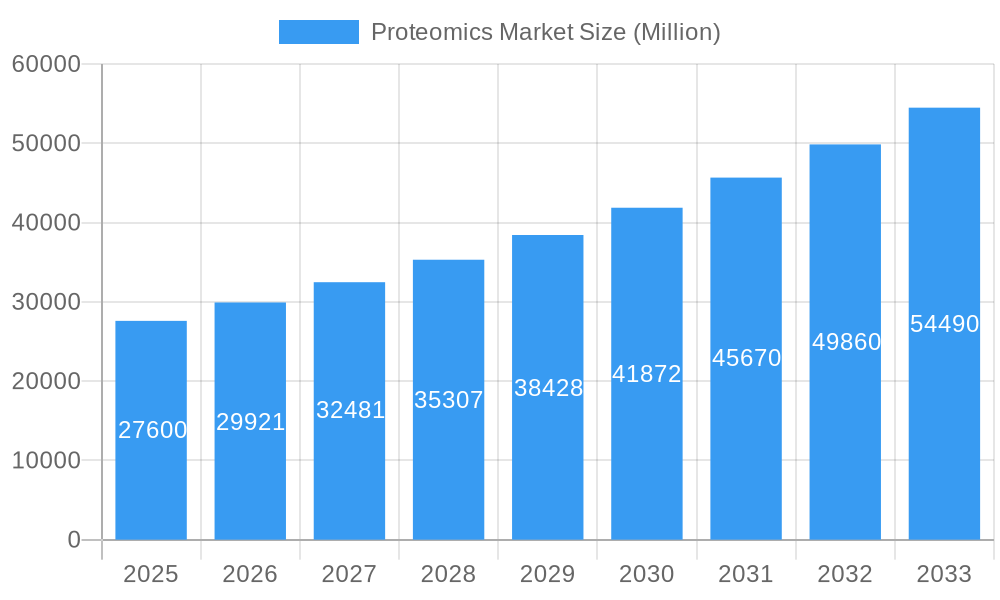
The global proteomics market, valued at $27.60 billion in 2025, is projected to experience robust growth, driven by a compound annual growth rate (CAGR) of 8.42% from 2025 to 2033. This expansion is fueled by several key factors. Advancements in mass spectrometry technologies are enabling higher throughput and more sensitive proteomic analyses, leading to faster and more cost-effective research. The increasing prevalence of chronic diseases like cancer and diabetes is driving demand for improved diagnostic tools and personalized medicine approaches, where proteomics plays a crucial role in identifying disease biomarkers and therapeutic targets. Furthermore, the rising adoption of proteomics in drug discovery and development, particularly in areas like biopharmaceutical characterization and biomarker validation, significantly contributes to market growth. The pharmaceutical and biotechnology industries are investing heavily in proteomic research to accelerate the development of novel therapies. Growth is also being witnessed across various applications, including clinical diagnostics, drug discovery, and academic research.
Proteomics Market Market Size (In Billion)
Segment-wise, the instrumentation technology segment within product and services is expected to dominate, due to continuous innovation and the release of advanced instruments. Geographically, North America currently holds a significant market share, driven by robust funding for research and development and the presence of major players. However, the Asia Pacific region is poised for substantial growth, propelled by expanding healthcare infrastructure and rising investments in biotechnology and pharmaceutical industries, particularly in countries like China and India. While regulatory hurdles and high costs associated with proteomics technologies could act as restraints, the overall market outlook remains highly positive, driven by the aforementioned factors and the continuous development of more sophisticated and accessible proteomic tools. The forecast period of 2025-2033 anticipates considerable expansion, making the proteomics market an attractive area for investment and innovation.
Proteomics Market Company Market Share
Proteomics Market: A Comprehensive Report (2019-2033)
This dynamic report provides a detailed analysis of the global proteomics market, offering invaluable insights for stakeholders seeking to navigate this rapidly evolving landscape. From market sizing and segmentation to competitive analysis and future projections, this report equips you with the knowledge needed to make informed business decisions. The study period spans from 2019 to 2033, with 2025 serving as both the base and estimated year. The forecast period covers 2025-2033, and the historical period encompasses 2019-2024. The global proteomics market is projected to reach xx Million by 2033, exhibiting a robust CAGR of xx% during the forecast period.
Proteomics Market Market Structure & Competitive Landscape
The proteomics market exhibits a moderately concentrated structure, with a few major players holding significant market share. The Herfindahl-Hirschman Index (HHI) is estimated at xx, indicating a moderately consolidated market. Key players such as Thermo Fisher Scientific Inc, Danaher Corporation, and Agilent Technologies Inc, dominate through their comprehensive product portfolios and strong global presence. Innovation drives competition, with companies continuously investing in R&D to develop advanced technologies like high-throughput mass spectrometry and improved bioinformatics tools. Regulatory approvals, particularly within the clinical diagnostics segment, significantly impact market entry and growth. The market experiences ongoing M&A activity, with smaller companies being acquired by larger players to expand their product offerings and geographical reach. The total value of M&A transactions in the proteomics market from 2019 to 2024 is estimated at xx Million. End-user segmentation includes academic research institutions, pharmaceutical companies, biotechnology firms, and clinical diagnostic laboratories, each with unique needs and preferences. Substitute technologies, such as genomics and transcriptomics, also influence market dynamics.
- Market Concentration: Moderately concentrated, HHI estimated at xx.
- Innovation Drivers: Advancements in mass spectrometry, bioinformatics, and sample preparation.
- Regulatory Impacts: Stringent regulatory frameworks for clinical diagnostics applications.
- Product Substitutes: Genomics, transcriptomics.
- End-User Segmentation: Academic research, pharmaceutical companies, biotech firms, clinical labs.
- M&A Trends: Significant M&A activity, with total value estimated at xx Million (2019-2024).
Proteomics Market Market Trends & Opportunities
The global proteomics market is experiencing robust growth, driven by several key factors. Technological advancements in mass spectrometry and bioinformatics have significantly improved the speed, accuracy, and throughput of proteomic analyses. This has broadened the applications of proteomics in various fields, including drug discovery, clinical diagnostics, and personalized medicine. Increased funding for research and development in proteomics is another significant driver. Government initiatives and private investments are fueling innovation and accelerating market expansion. The rising prevalence of chronic diseases, such as cancer and Alzheimer's disease, is also boosting demand for proteomic-based diagnostics and therapeutics. This demand is further amplified by growing awareness among patients and healthcare professionals about the benefits of personalized medicine approaches enabled by proteomics. The market is witnessing a shift towards automated and high-throughput systems, catering to the demand for faster turnaround times and increased efficiency. Furthermore, the development of sophisticated software and data analysis tools is simplifying the complexities of proteomic data interpretation, making the technology more accessible to a wider range of users. The market penetration rate for proteomics in clinical diagnostics is currently estimated at xx% and is projected to grow significantly in the forecast period. The compound annual growth rate (CAGR) for the global proteomics market is projected to be xx% during the forecast period (2025-2033).
Dominant Markets & Segments in Proteomics Market
The North American region currently dominates the proteomics market, driven by strong R&D investments, well-established healthcare infrastructure, and the presence of key market players. Within this region, the United States holds the largest market share. In terms of application, the drug discovery segment exhibits the highest growth potential, fueled by the increasing use of proteomics in target identification, biomarker discovery, and drug development. Within Product & Services, instrumentation technology, specifically mass spectrometers, holds the largest market share, reflecting the core role of this technology in proteomic workflows. Reagents and software also experience robust growth, reflecting the increasing demand for high-quality consumables and sophisticated data analysis tools.
- Leading Region: North America (United States)
- Fastest Growing Application: Drug Discovery
- Largest Product Segment: Instrumentation Technology (Mass Spectrometry)
- Key Growth Drivers in North America: Strong R&D investment, advanced healthcare infrastructure, presence of major players.
- Key Growth Drivers in Drug Discovery: Growing need for target identification, biomarker discovery, personalized medicine.
Proteomics Market Product Analysis
Recent product innovations focus on improving the sensitivity, speed, and automation of proteomic workflows. New mass spectrometry technologies, such as high-resolution and high-mass accuracy instruments, allow for the identification and quantification of a wider range of proteins. The development of improved sample preparation techniques, such as automated protein extraction and digestion methods, increases the efficiency of proteomic analyses. These innovations, coupled with sophisticated software and data analysis tools, enhance the accessibility and interpretability of proteomic data, broadening the application of the technology across various sectors. The competitive advantage lies in offering comprehensive solutions that integrate hardware, software, and services to cater to the specific needs of different end-users.
Key Drivers, Barriers & Challenges in Proteomics Market
Key Drivers: Technological advancements (high-throughput mass spectrometry, improved bioinformatics), increased funding for research and development, rising prevalence of chronic diseases, and increasing demand for personalized medicine. Government initiatives and private investments, particularly in countries with strong healthcare infrastructure, also play a significant role.
Key Challenges: High cost of instrumentation and reagents, complexity of data analysis, regulatory hurdles for clinical applications, and the need for skilled personnel to operate and interpret data. Supply chain disruptions can also impact the availability of critical components and reagents, potentially affecting market growth. Furthermore, intense competition among established players and emerging companies presents a challenge for smaller players aiming to gain market share.
Growth Drivers in the Proteomics Market Market
The major drivers are the increasing adoption of proteomics in the pharmaceutical and biotechnology industries for drug discovery and development; advancements in mass spectrometry technologies, improving both sensitivity and throughput; and the growing need for personalized medicine solutions, which depend heavily on accurate and comprehensive proteomic analysis. Regulatory approvals and collaborations across industry and academia further accelerate market growth.
Challenges Impacting Proteomics Market Growth
The high cost of instrumentation, reagents, and software represents a major barrier to market entry and adoption. Complex data analysis requirements necessitates skilled personnel, leading to increased operational costs. Stringent regulatory pathways, especially for clinical diagnostic applications, add delays and increase development costs. Finally, competition from established players and the emergence of new technologies present significant hurdles for sustained market growth.
Key Players Shaping the Proteomics Market Market
Significant Proteomics Market Industry Milestones
- 2020-03: Thermo Fisher Scientific launches a new high-resolution mass spectrometer, significantly improving proteomic analysis capabilities.
- 2021-11: Bio-Rad Laboratories acquires a smaller proteomics company, expanding its product portfolio.
- 2022-06: A major pharmaceutical company announces a significant investment in proteomics-based drug discovery research.
- 2023-09: New regulatory guidelines are implemented for clinical proteomic applications, streamlining the approval process. (More milestones can be added here as they become available)
Future Outlook for Proteomics Market Market
The proteomics market is poised for continued growth, driven by technological advancements, increasing research funding, and the growing demand for personalized medicine. Strategic opportunities exist for companies to focus on developing innovative solutions that address the challenges of data analysis, sample preparation, and cost-effectiveness. The market will continue to witness M&A activity and collaborations to accelerate innovation and expand market reach. The continued integration of proteomics with other omics technologies, such as genomics and metabolomics, will further expand the scope of applications and drive market growth.
Proteomics Market Segmentation
-
1. Product & Services
-
1.1. Instrumentation Technology
- 1.1.1. Spectroscopy
- 1.1.2. Chromatography
- 1.1.3. Electrophoresis
- 1.1.4. Protein Microarrays
- 1.1.5. X-Ray Crystallography
- 1.1.6. Other Instrumentation Technologies
- 1.2. Reagents
- 1.3. Software and Services
-
1.1. Instrumentation Technology
-
2. Application
- 2.1. Clinical Diagnostics
- 2.2. Drug Discovery
- 2.3. Other Applications
Proteomics Market Segmentation By Geography
-
1. North America
- 1.1. United States
- 1.2. Canada
- 1.3. Mexico
-
2. Europe
- 2.1. Germany
- 2.2. United Kingdom
- 2.3. France
- 2.4. Italy
- 2.5. Spain
- 2.6. Rest of Europe
-
3. Asia Pacific
- 3.1. China
- 3.2. Japan
- 3.3. India
- 3.4. Australia
- 3.5. South Korea
- 3.6. Rest of Asia Pacific
- 4. Middle East
-
5. GCC
- 5.1. South Africa
- 5.2. Rest of Middle East
-
6. South America
- 6.1. Brazil
- 6.2. Argentina
- 6.3. Rest of South America
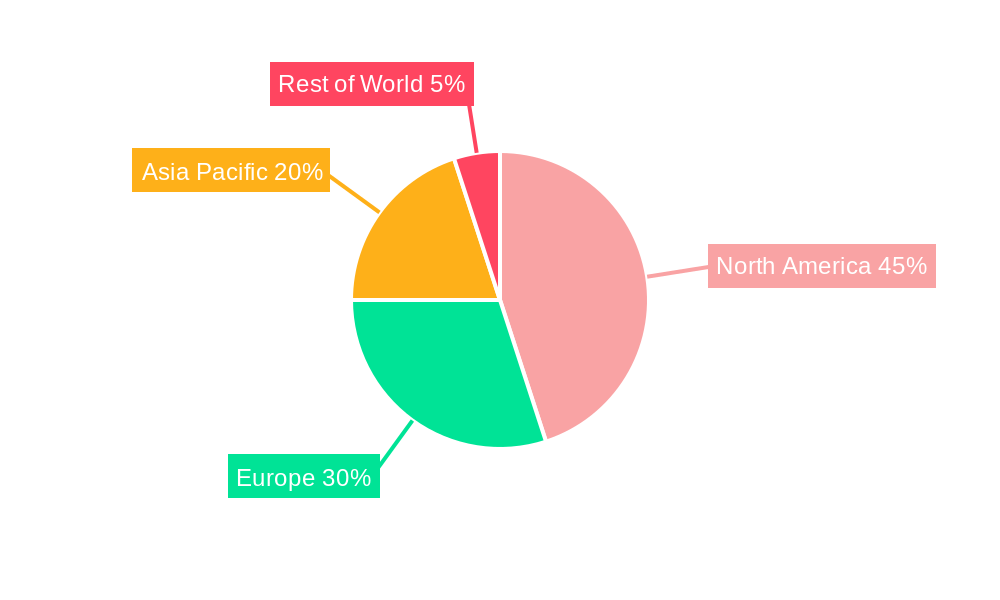
Proteomics Market Regional Market Share
Geographic Coverage of Proteomics Market
Proteomics Market REPORT HIGHLIGHTS
| Aspects | Details |
|---|---|
| Study Period | 2020-2034 |
| Base Year | 2025 |
| Estimated Year | 2026 |
| Forecast Period | 2026-2034 |
| Historical Period | 2020-2025 |
| Growth Rate | CAGR of 8.42% from 2020-2034 |
| Segmentation |
|
Table of Contents
- 1. Introduction
- 1.1. Research Scope
- 1.2. Market Segmentation
- 1.3. Research Objective
- 1.4. Definitions and Assumptions
- 2. Executive Summary
- 2.1. Market Snapshot
- 3. Market Dynamics
- 3.1. Market Drivers
- 3.2. Market Restrains
- 3.3. Market Trends
- 3.4. Market Opportunities
- 4. Market Factor Analysis
- 4.1. Porters Five Forces
- 4.1.1. Bargaining Power of Suppliers
- 4.1.2. Bargaining Power of Buyers
- 4.1.3. Threat of New Entrants
- 4.1.4. Threat of Substitutes
- 4.1.5. Competitive Rivalry
- 4.2. PESTEL analysis
- 4.3. BCG Analysis
- 4.3.1. Stars (High Growth, High Market Share)
- 4.3.2. Cash Cows (Low Growth, High Market Share)
- 4.3.3. Question Mark (High Growth, Low Market Share)
- 4.3.4. Dogs (Low Growth, Low Market Share)
- 4.4. Ansoff Matrix Analysis
- 4.5. Supply Chain Analysis
- 4.6. Regulatory Landscape
- 4.7. Current Market Potential and Opportunity Assessment (TAM–SAM–SOM Framework)
- 4.8. TIR Analyst Note
- 4.1. Porters Five Forces
- 5. Market Analysis, Insights and Forecast 2021-2033
- 5.1. Market Analysis, Insights and Forecast - by Product & Services
- 5.1.1. Instrumentation Technology
- 5.1.1.1. Spectroscopy
- 5.1.1.2. Chromatography
- 5.1.1.3. Electrophoresis
- 5.1.1.4. Protein Microarrays
- 5.1.1.5. X-Ray Crystallography
- 5.1.1.6. Other Instrumentation Technologies
- 5.1.2. Reagents
- 5.1.3. Software and Services
- 5.1.1. Instrumentation Technology
- 5.2. Market Analysis, Insights and Forecast - by Application
- 5.2.1. Clinical Diagnostics
- 5.2.2. Drug Discovery
- 5.2.3. Other Applications
- 5.3. Market Analysis, Insights and Forecast - by Region
- 5.3.1. North America
- 5.3.2. Europe
- 5.3.3. Asia Pacific
- 5.3.4. Middle East
- 5.3.5. GCC
- 5.3.6. South America
- 5.1. Market Analysis, Insights and Forecast - by Product & Services
- 6. Global Proteomics Market Analysis, Insights and Forecast, 2021-2033
- 6.1. Market Analysis, Insights and Forecast - by Product & Services
- 6.1.1. Instrumentation Technology
- 6.1.1.1. Spectroscopy
- 6.1.1.2. Chromatography
- 6.1.1.3. Electrophoresis
- 6.1.1.4. Protein Microarrays
- 6.1.1.5. X-Ray Crystallography
- 6.1.1.6. Other Instrumentation Technologies
- 6.1.2. Reagents
- 6.1.3. Software and Services
- 6.1.1. Instrumentation Technology
- 6.2. Market Analysis, Insights and Forecast - by Application
- 6.2.1. Clinical Diagnostics
- 6.2.2. Drug Discovery
- 6.2.3. Other Applications
- 6.1. Market Analysis, Insights and Forecast - by Product & Services
- 7. North America Proteomics Market Analysis, Insights and Forecast, 2020-2032
- 7.1. Market Analysis, Insights and Forecast - by Product & Services
- 7.1.1. Instrumentation Technology
- 7.1.1.1. Spectroscopy
- 7.1.1.2. Chromatography
- 7.1.1.3. Electrophoresis
- 7.1.1.4. Protein Microarrays
- 7.1.1.5. X-Ray Crystallography
- 7.1.1.6. Other Instrumentation Technologies
- 7.1.2. Reagents
- 7.1.3. Software and Services
- 7.1.1. Instrumentation Technology
- 7.2. Market Analysis, Insights and Forecast - by Application
- 7.2.1. Clinical Diagnostics
- 7.2.2. Drug Discovery
- 7.2.3. Other Applications
- 7.1. Market Analysis, Insights and Forecast - by Product & Services
- 8. Europe Proteomics Market Analysis, Insights and Forecast, 2020-2032
- 8.1. Market Analysis, Insights and Forecast - by Product & Services
- 8.1.1. Instrumentation Technology
- 8.1.1.1. Spectroscopy
- 8.1.1.2. Chromatography
- 8.1.1.3. Electrophoresis
- 8.1.1.4. Protein Microarrays
- 8.1.1.5. X-Ray Crystallography
- 8.1.1.6. Other Instrumentation Technologies
- 8.1.2. Reagents
- 8.1.3. Software and Services
- 8.1.1. Instrumentation Technology
- 8.2. Market Analysis, Insights and Forecast - by Application
- 8.2.1. Clinical Diagnostics
- 8.2.2. Drug Discovery
- 8.2.3. Other Applications
- 8.1. Market Analysis, Insights and Forecast - by Product & Services
- 9. Asia Pacific Proteomics Market Analysis, Insights and Forecast, 2020-2032
- 9.1. Market Analysis, Insights and Forecast - by Product & Services
- 9.1.1. Instrumentation Technology
- 9.1.1.1. Spectroscopy
- 9.1.1.2. Chromatography
- 9.1.1.3. Electrophoresis
- 9.1.1.4. Protein Microarrays
- 9.1.1.5. X-Ray Crystallography
- 9.1.1.6. Other Instrumentation Technologies
- 9.1.2. Reagents
- 9.1.3. Software and Services
- 9.1.1. Instrumentation Technology
- 9.2. Market Analysis, Insights and Forecast - by Application
- 9.2.1. Clinical Diagnostics
- 9.2.2. Drug Discovery
- 9.2.3. Other Applications
- 9.1. Market Analysis, Insights and Forecast - by Product & Services
- 10. Middle East Proteomics Market Analysis, Insights and Forecast, 2020-2032
- 10.1. Market Analysis, Insights and Forecast - by Product & Services
- 10.1.1. Instrumentation Technology
- 10.1.1.1. Spectroscopy
- 10.1.1.2. Chromatography
- 10.1.1.3. Electrophoresis
- 10.1.1.4. Protein Microarrays
- 10.1.1.5. X-Ray Crystallography
- 10.1.1.6. Other Instrumentation Technologies
- 10.1.2. Reagents
- 10.1.3. Software and Services
- 10.1.1. Instrumentation Technology
- 10.2. Market Analysis, Insights and Forecast - by Application
- 10.2.1. Clinical Diagnostics
- 10.2.2. Drug Discovery
- 10.2.3. Other Applications
- 10.1. Market Analysis, Insights and Forecast - by Product & Services
- 11. GCC Proteomics Market Analysis, Insights and Forecast, 2020-2032
- 11.1. Market Analysis, Insights and Forecast - by Product & Services
- 11.1.1. Instrumentation Technology
- 11.1.1.1. Spectroscopy
- 11.1.1.2. Chromatography
- 11.1.1.3. Electrophoresis
- 11.1.1.4. Protein Microarrays
- 11.1.1.5. X-Ray Crystallography
- 11.1.1.6. Other Instrumentation Technologies
- 11.1.2. Reagents
- 11.1.3. Software and Services
- 11.1.1. Instrumentation Technology
- 11.2. Market Analysis, Insights and Forecast - by Application
- 11.2.1. Clinical Diagnostics
- 11.2.2. Drug Discovery
- 11.2.3. Other Applications
- 11.1. Market Analysis, Insights and Forecast - by Product & Services
- 12. South America Proteomics Market Analysis, Insights and Forecast, 2020-2032
- 12.1. Market Analysis, Insights and Forecast - by Product & Services
- 12.1.1. Instrumentation Technology
- 12.1.1.1. Spectroscopy
- 12.1.1.2. Chromatography
- 12.1.1.3. Electrophoresis
- 12.1.1.4. Protein Microarrays
- 12.1.1.5. X-Ray Crystallography
- 12.1.1.6. Other Instrumentation Technologies
- 12.1.2. Reagents
- 12.1.3. Software and Services
- 12.1.1. Instrumentation Technology
- 12.2. Market Analysis, Insights and Forecast - by Application
- 12.2.1. Clinical Diagnostics
- 12.2.2. Drug Discovery
- 12.2.3. Other Applications
- 12.1. Market Analysis, Insights and Forecast - by Product & Services
- 13. Competitive Analysis
- 13.1. Company Profiles
- 13.1.1 Promega Corporation
- 13.1.1.1. Company Overview
- 13.1.1.2. Products
- 13.1.1.3. Company Financials
- 13.1.1.4. SWOT Analysis
- 13.1.2 Bio-Rad Laboratories Inc
- 13.1.2.1. Company Overview
- 13.1.2.2. Products
- 13.1.2.3. Company Financials
- 13.1.2.4. SWOT Analysis
- 13.1.3 Waters Corporation
- 13.1.3.1. Company Overview
- 13.1.3.2. Products
- 13.1.3.3. Company Financials
- 13.1.3.4. SWOT Analysis
- 13.1.4 Merck KGaA
- 13.1.4.1. Company Overview
- 13.1.4.2. Products
- 13.1.4.3. Company Financials
- 13.1.4.4. SWOT Analysis
- 13.1.5 GE Healthcare
- 13.1.5.1. Company Overview
- 13.1.5.2. Products
- 13.1.5.3. Company Financials
- 13.1.5.4. SWOT Analysis
- 13.1.6 Thermo Fisher Scientific Inc
- 13.1.6.1. Company Overview
- 13.1.6.2. Products
- 13.1.6.3. Company Financials
- 13.1.6.4. SWOT Analysis
- 13.1.7 Danaher Corporation
- 13.1.7.1. Company Overview
- 13.1.7.2. Products
- 13.1.7.3. Company Financials
- 13.1.7.4. SWOT Analysis
- 13.1.8 Agilent Technologies Inc
- 13.1.8.1. Company Overview
- 13.1.8.2. Products
- 13.1.8.3. Company Financials
- 13.1.8.4. SWOT Analysis
- 13.1.9 Bruker Corporation
- 13.1.9.1. Company Overview
- 13.1.9.2. Products
- 13.1.9.3. Company Financials
- 13.1.9.4. SWOT Analysis
- 13.1.1 Promega Corporation
- 13.2. Market Entropy
- 13.2.1 Company's Key Areas Served
- 13.2.2 Recent Developments
- 13.3. Company Market Share Analysis 2025
- 13.3.1 Top 5 Companies Market Share Analysis
- 13.3.2 Top 3 Companies Market Share Analysis
- 13.4. List of Potential Customers
- 14. Research Methodology
List of Figures
- Figure 1: Global Proteomics Market Revenue Breakdown (Million, %) by Region 2025 & 2033
- Figure 2: Global Proteomics Market Volume Breakdown (K Unit, %) by Region 2025 & 2033
- Figure 3: North America Proteomics Market Revenue (Million), by Product & Services 2025 & 2033
- Figure 4: North America Proteomics Market Volume (K Unit), by Product & Services 2025 & 2033
- Figure 5: North America Proteomics Market Revenue Share (%), by Product & Services 2025 & 2033
- Figure 6: North America Proteomics Market Volume Share (%), by Product & Services 2025 & 2033
- Figure 7: North America Proteomics Market Revenue (Million), by Application 2025 & 2033
- Figure 8: North America Proteomics Market Volume (K Unit), by Application 2025 & 2033
- Figure 9: North America Proteomics Market Revenue Share (%), by Application 2025 & 2033
- Figure 10: North America Proteomics Market Volume Share (%), by Application 2025 & 2033
- Figure 11: North America Proteomics Market Revenue (Million), by Country 2025 & 2033
- Figure 12: North America Proteomics Market Volume (K Unit), by Country 2025 & 2033
- Figure 13: North America Proteomics Market Revenue Share (%), by Country 2025 & 2033
- Figure 14: North America Proteomics Market Volume Share (%), by Country 2025 & 2033
- Figure 15: Europe Proteomics Market Revenue (Million), by Product & Services 2025 & 2033
- Figure 16: Europe Proteomics Market Volume (K Unit), by Product & Services 2025 & 2033
- Figure 17: Europe Proteomics Market Revenue Share (%), by Product & Services 2025 & 2033
- Figure 18: Europe Proteomics Market Volume Share (%), by Product & Services 2025 & 2033
- Figure 19: Europe Proteomics Market Revenue (Million), by Application 2025 & 2033
- Figure 20: Europe Proteomics Market Volume (K Unit), by Application 2025 & 2033
- Figure 21: Europe Proteomics Market Revenue Share (%), by Application 2025 & 2033
- Figure 22: Europe Proteomics Market Volume Share (%), by Application 2025 & 2033
- Figure 23: Europe Proteomics Market Revenue (Million), by Country 2025 & 2033
- Figure 24: Europe Proteomics Market Volume (K Unit), by Country 2025 & 2033
- Figure 25: Europe Proteomics Market Revenue Share (%), by Country 2025 & 2033
- Figure 26: Europe Proteomics Market Volume Share (%), by Country 2025 & 2033
- Figure 27: Asia Pacific Proteomics Market Revenue (Million), by Product & Services 2025 & 2033
- Figure 28: Asia Pacific Proteomics Market Volume (K Unit), by Product & Services 2025 & 2033
- Figure 29: Asia Pacific Proteomics Market Revenue Share (%), by Product & Services 2025 & 2033
- Figure 30: Asia Pacific Proteomics Market Volume Share (%), by Product & Services 2025 & 2033
- Figure 31: Asia Pacific Proteomics Market Revenue (Million), by Application 2025 & 2033
- Figure 32: Asia Pacific Proteomics Market Volume (K Unit), by Application 2025 & 2033
- Figure 33: Asia Pacific Proteomics Market Revenue Share (%), by Application 2025 & 2033
- Figure 34: Asia Pacific Proteomics Market Volume Share (%), by Application 2025 & 2033
- Figure 35: Asia Pacific Proteomics Market Revenue (Million), by Country 2025 & 2033
- Figure 36: Asia Pacific Proteomics Market Volume (K Unit), by Country 2025 & 2033
- Figure 37: Asia Pacific Proteomics Market Revenue Share (%), by Country 2025 & 2033
- Figure 38: Asia Pacific Proteomics Market Volume Share (%), by Country 2025 & 2033
- Figure 39: Middle East Proteomics Market Revenue (Million), by Product & Services 2025 & 2033
- Figure 40: Middle East Proteomics Market Volume (K Unit), by Product & Services 2025 & 2033
- Figure 41: Middle East Proteomics Market Revenue Share (%), by Product & Services 2025 & 2033
- Figure 42: Middle East Proteomics Market Volume Share (%), by Product & Services 2025 & 2033
- Figure 43: Middle East Proteomics Market Revenue (Million), by Application 2025 & 2033
- Figure 44: Middle East Proteomics Market Volume (K Unit), by Application 2025 & 2033
- Figure 45: Middle East Proteomics Market Revenue Share (%), by Application 2025 & 2033
- Figure 46: Middle East Proteomics Market Volume Share (%), by Application 2025 & 2033
- Figure 47: Middle East Proteomics Market Revenue (Million), by Country 2025 & 2033
- Figure 48: Middle East Proteomics Market Volume (K Unit), by Country 2025 & 2033
- Figure 49: Middle East Proteomics Market Revenue Share (%), by Country 2025 & 2033
- Figure 50: Middle East Proteomics Market Volume Share (%), by Country 2025 & 2033
- Figure 51: GCC Proteomics Market Revenue (Million), by Product & Services 2025 & 2033
- Figure 52: GCC Proteomics Market Volume (K Unit), by Product & Services 2025 & 2033
- Figure 53: GCC Proteomics Market Revenue Share (%), by Product & Services 2025 & 2033
- Figure 54: GCC Proteomics Market Volume Share (%), by Product & Services 2025 & 2033
- Figure 55: GCC Proteomics Market Revenue (Million), by Application 2025 & 2033
- Figure 56: GCC Proteomics Market Volume (K Unit), by Application 2025 & 2033
- Figure 57: GCC Proteomics Market Revenue Share (%), by Application 2025 & 2033
- Figure 58: GCC Proteomics Market Volume Share (%), by Application 2025 & 2033
- Figure 59: GCC Proteomics Market Revenue (Million), by Country 2025 & 2033
- Figure 60: GCC Proteomics Market Volume (K Unit), by Country 2025 & 2033
- Figure 61: GCC Proteomics Market Revenue Share (%), by Country 2025 & 2033
- Figure 62: GCC Proteomics Market Volume Share (%), by Country 2025 & 2033
- Figure 63: South America Proteomics Market Revenue (Million), by Product & Services 2025 & 2033
- Figure 64: South America Proteomics Market Volume (K Unit), by Product & Services 2025 & 2033
- Figure 65: South America Proteomics Market Revenue Share (%), by Product & Services 2025 & 2033
- Figure 66: South America Proteomics Market Volume Share (%), by Product & Services 2025 & 2033
- Figure 67: South America Proteomics Market Revenue (Million), by Application 2025 & 2033
- Figure 68: South America Proteomics Market Volume (K Unit), by Application 2025 & 2033
- Figure 69: South America Proteomics Market Revenue Share (%), by Application 2025 & 2033
- Figure 70: South America Proteomics Market Volume Share (%), by Application 2025 & 2033
- Figure 71: South America Proteomics Market Revenue (Million), by Country 2025 & 2033
- Figure 72: South America Proteomics Market Volume (K Unit), by Country 2025 & 2033
- Figure 73: South America Proteomics Market Revenue Share (%), by Country 2025 & 2033
- Figure 74: South America Proteomics Market Volume Share (%), by Country 2025 & 2033
List of Tables
- Table 1: Global Proteomics Market Revenue Million Forecast, by Product & Services 2020 & 2033
- Table 2: Global Proteomics Market Volume K Unit Forecast, by Product & Services 2020 & 2033
- Table 3: Global Proteomics Market Revenue Million Forecast, by Application 2020 & 2033
- Table 4: Global Proteomics Market Volume K Unit Forecast, by Application 2020 & 2033
- Table 5: Global Proteomics Market Revenue Million Forecast, by Region 2020 & 2033
- Table 6: Global Proteomics Market Volume K Unit Forecast, by Region 2020 & 2033
- Table 7: Global Proteomics Market Revenue Million Forecast, by Product & Services 2020 & 2033
- Table 8: Global Proteomics Market Volume K Unit Forecast, by Product & Services 2020 & 2033
- Table 9: Global Proteomics Market Revenue Million Forecast, by Application 2020 & 2033
- Table 10: Global Proteomics Market Volume K Unit Forecast, by Application 2020 & 2033
- Table 11: Global Proteomics Market Revenue Million Forecast, by Country 2020 & 2033
- Table 12: Global Proteomics Market Volume K Unit Forecast, by Country 2020 & 2033
- Table 13: United States Proteomics Market Revenue (Million) Forecast, by Application 2020 & 2033
- Table 14: United States Proteomics Market Volume (K Unit) Forecast, by Application 2020 & 2033
- Table 15: Canada Proteomics Market Revenue (Million) Forecast, by Application 2020 & 2033
- Table 16: Canada Proteomics Market Volume (K Unit) Forecast, by Application 2020 & 2033
- Table 17: Mexico Proteomics Market Revenue (Million) Forecast, by Application 2020 & 2033
- Table 18: Mexico Proteomics Market Volume (K Unit) Forecast, by Application 2020 & 2033
- Table 19: Global Proteomics Market Revenue Million Forecast, by Product & Services 2020 & 2033
- Table 20: Global Proteomics Market Volume K Unit Forecast, by Product & Services 2020 & 2033
- Table 21: Global Proteomics Market Revenue Million Forecast, by Application 2020 & 2033
- Table 22: Global Proteomics Market Volume K Unit Forecast, by Application 2020 & 2033
- Table 23: Global Proteomics Market Revenue Million Forecast, by Country 2020 & 2033
- Table 24: Global Proteomics Market Volume K Unit Forecast, by Country 2020 & 2033
- Table 25: Germany Proteomics Market Revenue (Million) Forecast, by Application 2020 & 2033
- Table 26: Germany Proteomics Market Volume (K Unit) Forecast, by Application 2020 & 2033
- Table 27: United Kingdom Proteomics Market Revenue (Million) Forecast, by Application 2020 & 2033
- Table 28: United Kingdom Proteomics Market Volume (K Unit) Forecast, by Application 2020 & 2033
- Table 29: France Proteomics Market Revenue (Million) Forecast, by Application 2020 & 2033
- Table 30: France Proteomics Market Volume (K Unit) Forecast, by Application 2020 & 2033
- Table 31: Italy Proteomics Market Revenue (Million) Forecast, by Application 2020 & 2033
- Table 32: Italy Proteomics Market Volume (K Unit) Forecast, by Application 2020 & 2033
- Table 33: Spain Proteomics Market Revenue (Million) Forecast, by Application 2020 & 2033
- Table 34: Spain Proteomics Market Volume (K Unit) Forecast, by Application 2020 & 2033
- Table 35: Rest of Europe Proteomics Market Revenue (Million) Forecast, by Application 2020 & 2033
- Table 36: Rest of Europe Proteomics Market Volume (K Unit) Forecast, by Application 2020 & 2033
- Table 37: Global Proteomics Market Revenue Million Forecast, by Product & Services 2020 & 2033
- Table 38: Global Proteomics Market Volume K Unit Forecast, by Product & Services 2020 & 2033
- Table 39: Global Proteomics Market Revenue Million Forecast, by Application 2020 & 2033
- Table 40: Global Proteomics Market Volume K Unit Forecast, by Application 2020 & 2033
- Table 41: Global Proteomics Market Revenue Million Forecast, by Country 2020 & 2033
- Table 42: Global Proteomics Market Volume K Unit Forecast, by Country 2020 & 2033
- Table 43: China Proteomics Market Revenue (Million) Forecast, by Application 2020 & 2033
- Table 44: China Proteomics Market Volume (K Unit) Forecast, by Application 2020 & 2033
- Table 45: Japan Proteomics Market Revenue (Million) Forecast, by Application 2020 & 2033
- Table 46: Japan Proteomics Market Volume (K Unit) Forecast, by Application 2020 & 2033
- Table 47: India Proteomics Market Revenue (Million) Forecast, by Application 2020 & 2033
- Table 48: India Proteomics Market Volume (K Unit) Forecast, by Application 2020 & 2033
- Table 49: Australia Proteomics Market Revenue (Million) Forecast, by Application 2020 & 2033
- Table 50: Australia Proteomics Market Volume (K Unit) Forecast, by Application 2020 & 2033
- Table 51: South Korea Proteomics Market Revenue (Million) Forecast, by Application 2020 & 2033
- Table 52: South Korea Proteomics Market Volume (K Unit) Forecast, by Application 2020 & 2033
- Table 53: Rest of Asia Pacific Proteomics Market Revenue (Million) Forecast, by Application 2020 & 2033
- Table 54: Rest of Asia Pacific Proteomics Market Volume (K Unit) Forecast, by Application 2020 & 2033
- Table 55: Global Proteomics Market Revenue Million Forecast, by Product & Services 2020 & 2033
- Table 56: Global Proteomics Market Volume K Unit Forecast, by Product & Services 2020 & 2033
- Table 57: Global Proteomics Market Revenue Million Forecast, by Application 2020 & 2033
- Table 58: Global Proteomics Market Volume K Unit Forecast, by Application 2020 & 2033
- Table 59: Global Proteomics Market Revenue Million Forecast, by Country 2020 & 2033
- Table 60: Global Proteomics Market Volume K Unit Forecast, by Country 2020 & 2033
- Table 61: Global Proteomics Market Revenue Million Forecast, by Product & Services 2020 & 2033
- Table 62: Global Proteomics Market Volume K Unit Forecast, by Product & Services 2020 & 2033
- Table 63: Global Proteomics Market Revenue Million Forecast, by Application 2020 & 2033
- Table 64: Global Proteomics Market Volume K Unit Forecast, by Application 2020 & 2033
- Table 65: Global Proteomics Market Revenue Million Forecast, by Country 2020 & 2033
- Table 66: Global Proteomics Market Volume K Unit Forecast, by Country 2020 & 2033
- Table 67: South Africa Proteomics Market Revenue (Million) Forecast, by Application 2020 & 2033
- Table 68: South Africa Proteomics Market Volume (K Unit) Forecast, by Application 2020 & 2033
- Table 69: Rest of Middle East Proteomics Market Revenue (Million) Forecast, by Application 2020 & 2033
- Table 70: Rest of Middle East Proteomics Market Volume (K Unit) Forecast, by Application 2020 & 2033
- Table 71: Global Proteomics Market Revenue Million Forecast, by Product & Services 2020 & 2033
- Table 72: Global Proteomics Market Volume K Unit Forecast, by Product & Services 2020 & 2033
- Table 73: Global Proteomics Market Revenue Million Forecast, by Application 2020 & 2033
- Table 74: Global Proteomics Market Volume K Unit Forecast, by Application 2020 & 2033
- Table 75: Global Proteomics Market Revenue Million Forecast, by Country 2020 & 2033
- Table 76: Global Proteomics Market Volume K Unit Forecast, by Country 2020 & 2033
- Table 77: Brazil Proteomics Market Revenue (Million) Forecast, by Application 2020 & 2033
- Table 78: Brazil Proteomics Market Volume (K Unit) Forecast, by Application 2020 & 2033
- Table 79: Argentina Proteomics Market Revenue (Million) Forecast, by Application 2020 & 2033
- Table 80: Argentina Proteomics Market Volume (K Unit) Forecast, by Application 2020 & 2033
- Table 81: Rest of South America Proteomics Market Revenue (Million) Forecast, by Application 2020 & 2033
- Table 82: Rest of South America Proteomics Market Volume (K Unit) Forecast, by Application 2020 & 2033
Frequently Asked Questions
1. What is the projected Compound Annual Growth Rate (CAGR) of the Proteomics Market?
The projected CAGR is approximately 8.42%.
2. Which companies are prominent players in the Proteomics Market?
Key companies in the market include Promega Corporation, Bio-Rad Laboratories Inc, Waters Corporation, Merck KGaA, GE Healthcare, Thermo Fisher Scientific Inc, Danaher Corporation, Agilent Technologies Inc, Bruker Corporation.
3. What are the main segments of the Proteomics Market?
The market segments include Product & Services, Application.
4. Can you provide details about the market size?
The market size is estimated to be USD 27.60 Million as of 2022.
5. What are some drivers contributing to market growth?
Rising Demand for Personalized Medicine; Increasing R&D Expenditure and Government Funding for Proteomics; Technological Advancements.
6. What are the notable trends driving market growth?
Drug Discovery is Expected to Witness Healthy CAGR in Future.
7. Are there any restraints impacting market growth?
High Cost of Instruments.
8. Can you provide examples of recent developments in the market?
N/A
9. What pricing options are available for accessing the report?
Pricing options include single-user, multi-user, and enterprise licenses priced at USD 4750, USD 5250, and USD 8750 respectively.
10. Is the market size provided in terms of value or volume?
The market size is provided in terms of value, measured in Million and volume, measured in K Unit.
11. Are there any specific market keywords associated with the report?
Yes, the market keyword associated with the report is "Proteomics Market," which aids in identifying and referencing the specific market segment covered.
12. How do I determine which pricing option suits my needs best?
The pricing options vary based on user requirements and access needs. Individual users may opt for single-user licenses, while businesses requiring broader access may choose multi-user or enterprise licenses for cost-effective access to the report.
13. Are there any additional resources or data provided in the Proteomics Market report?
While the report offers comprehensive insights, it's advisable to review the specific contents or supplementary materials provided to ascertain if additional resources or data are available.
14. How can I stay updated on further developments or reports in the Proteomics Market?
To stay informed about further developments, trends, and reports in the Proteomics Market, consider subscribing to industry newsletters, following relevant companies and organizations, or regularly checking reputable industry news sources and publications.
Methodology
Step 1 - Identification of Relevant Samples Size from Population Database


Step 2 - Approaches for Defining Global Market Size (Value, Volume* & Price*)

Note*: In applicable scenarios
Step 3 - Data Sources
Primary Research
- Web Analytics
- Survey Reports
- Research Institute
- Latest Research Reports
- Opinion Leaders
Secondary Research
- Annual Reports
- White Paper
- Latest Press Release
- Industry Association
- Paid Database
- Investor Presentations

Step 4 - Data Triangulation
Involves using different sources of information in order to increase the validity of a study
These sources are likely to be stakeholders in a program - participants, other researchers, program staff, other community members, and so on.
Then we put all data in single framework & apply various statistical tools to find out the dynamic on the market.
During the analysis stage, feedback from the stakeholder groups would be compared to determine areas of agreement as well as areas of divergence