

Key Insights
The global air starter market, valued at approximately $XX million in 2025, is projected to experience robust growth, exceeding a 3% CAGR throughout the forecast period (2025-2033). This expansion is primarily driven by the increasing demand for reliable engine starting solutions across diverse sectors. The Oil & Gas industry, a major consumer, is fueling market growth due to its reliance on efficient and dependable equipment in demanding operational environments. Simultaneously, the power generation sector’s ongoing modernization and expansion contribute significantly to market demand. Technological advancements, such as the development of more efficient and durable vane and turbine air starters, further enhance market prospects. Mining operations, characterized by harsh conditions and the need for heavy-duty equipment, also represent a substantial market segment. While rising raw material costs and supply chain disruptions present some challenges, the overall positive outlook is underpinned by the continued growth in energy production, infrastructure development, and industrial automation.
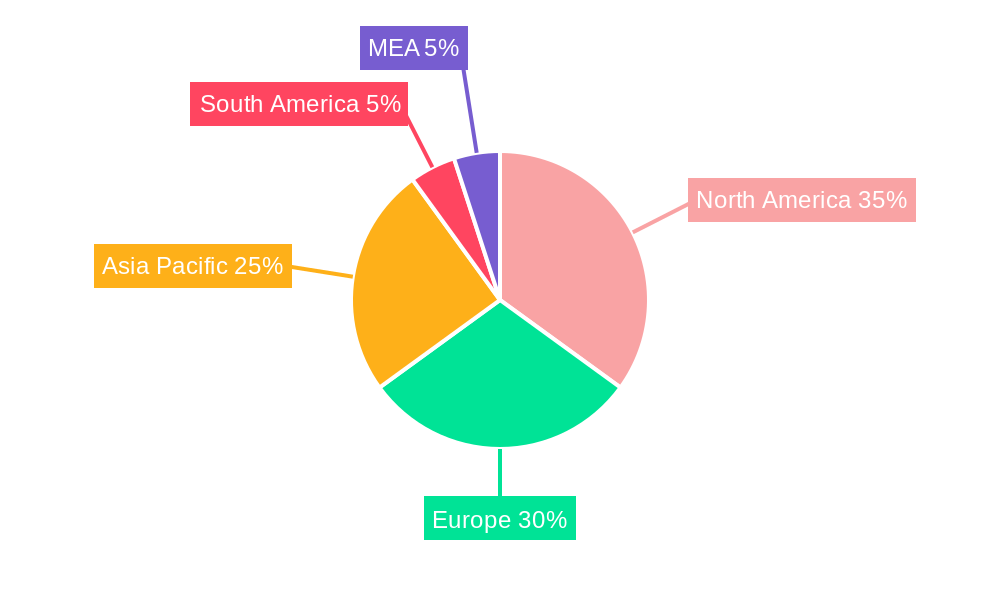
Segmentation analysis reveals that vane air starters currently dominate the market share due to their cost-effectiveness and suitability for various applications. However, turbine air starters are gaining traction due to their superior performance in demanding applications, particularly in heavy-duty machinery and extreme climates. Geographically, North America and Europe are currently the leading regions, driven by robust industrial activity and technological advancements. However, significant growth potential exists within the Asia-Pacific region, fueled by rapid industrialization and increasing energy demand in countries like China and India. Key players in the market, including Maradyne Corp, Austart Air Starters, and Ingersoll-Rand Plc, are strategically investing in research and development, focusing on product innovation and expansion into emerging markets to maintain a competitive edge. The market's competitive landscape is characterized by both established players and smaller, specialized manufacturers catering to niche segments.

Air Starter Industry Market Report: 2019-2033
This comprehensive report provides a detailed analysis of the global Air Starter industry, projecting a market value exceeding $XX Million by 2033. The study covers the period 2019-2033, with 2025 as the base and estimated year. It offers in-depth insights into market trends, competitive dynamics, segment performance, and future growth opportunities. This report is crucial for businesses, investors, and stakeholders seeking to understand and navigate this dynamic industry.
Air Starter Industry Market Structure & Competitive Landscape
The global air starter market presents a moderately fragmented landscape, with numerous key players actively competing for market share. Prominent participants include Maradyne Corp, Austart Air Starters, Ingersoll-Rand Plc, Miller Air Starter Co Inc, IPU Group, Multi Torque Industries Pty Ltd, The Rowland Company, KH Equipment Pty Ltd, Air Starter Components, and Gali Group. While the market exhibits moderate concentration, with the top five players holding an estimated XX% market share in 2025, the competitive intensity is substantial. Innovation is a pivotal driver, with companies continuously developing new materials and designs to enhance product performance, focusing particularly on energy efficiency and durability improvements. The regulatory environment significantly impacts the market, with evolving emission and safety standards demanding adaptation in product design and manufacturing processes. The emergence of electric starters presents a growing, though currently niche, competitive threat, mainly in specific applications where their advantages outweigh the limitations. The market is segmented by end-user, encompassing Oil & Gas (currently the dominant sector), Power Generation, Mining, and other industrial applications. Mergers and acquisitions (M&A) activity within the industry has been relatively subdued in recent years (approximately XX deals between 2019 and 2024), but future consolidation is anticipated as companies seek to expand their reach and optimize product portfolios.
- Market Concentration: Moderately fragmented, with the top five players holding approximately XX% of the market share (2025). Significant competitive intensity exists even within this relatively dispersed structure.
- Innovation Drivers: Continuous improvement in energy efficiency, enhanced durability, and the utilization of advanced materials are key innovation drivers.
- Regulatory Impacts: Stringent emission norms and evolving safety regulations are major factors shaping product design and manufacturing processes.
- Product Substitutes: Electric starters represent a growing competitive challenge, although their penetration is currently limited to specific application segments.
- End-User Segmentation: The market is significantly driven by Oil & Gas, followed by Power Generation, Mining, and other industrial sectors.
- M&A Trends: While M&A activity (approximately XX deals from 2019-2024) has been moderate, the potential for increased consolidation remains significant.
Air Starter Industry Market Trends & Opportunities
The global air starter market is projected to experience robust growth, with a projected CAGR of XX% during the forecast period (2025-2033). This expansion is propelled by several key factors: increasing demand from the oil and gas industry, a global rise in power generation capacity, escalating investments in mining operations, and the ongoing development of more efficient and reliable air starter technologies. A growing preference for environmentally sustainable solutions is also influencing market dynamics, prompting manufacturers to adopt greener materials and manufacturing processes. The competitive landscape continues to intensify, with established players investing heavily in research and development to maintain their market positions, and new entrants seeking to capitalize on emerging opportunities. Market penetration rates vary across geographical regions and market segments, with mature markets such as North America and Europe demonstrating higher penetration levels. A notable trend is the increasing demand for customized solutions tailored to the specific needs of individual customers. Pricing strategies range from price competition in the low-end segments to premium pricing for products offering advanced features and enhanced reliability.
Dominant Markets & Segments in Air Starter Industry
The Oil & Gas sector represents the dominant end-user segment, accounting for approximately XX% of the total market value in 2025. North America and Europe currently hold a significant portion of the global market share.
Key Growth Drivers:
- Oil & Gas: Exploration and production activities driving demand for robust and reliable air starters.
- Power Generation: Increased investment in renewable energy infrastructure boosting demand.
- Mining: Expansion of mining operations leading to increased equipment needs.
- Technological Advancements: Development of efficient and durable air starters fueling market growth.
Market Dominance Analysis: North America's dominance stems from the presence of established oil and gas industries and a robust manufacturing base. The region's advanced technological capabilities and high adoption rates of innovative products also contribute to its leading market position. Europe follows a similar pattern, but with a slightly lower market share.
Air Starter Industry Product Analysis
The air starter market encompasses two primary product types: vane air starters and turbine air starters. Vane air starters dominate the market due to their lower cost and suitability for various applications. Turbine air starters, while more expensive, offer superior performance in high-demand situations, especially in larger engines and harsh environments. Technological advancements are focused on improving efficiency, reducing emissions, and enhancing durability. New materials and design innovations are key drivers of these improvements, allowing for a better fit with diverse market needs and offering competitive advantages to manufacturers.
Key Drivers, Barriers & Challenges in Air Starter Industry
Key Drivers:
The air starter market’s growth is primarily driven by the consistent need for dependable engine starting systems across diverse industrial sectors. This demand is fueled by expansion in energy and resource extraction activities globally. Continuous technological advancements, such as the utilization of lighter and more efficient materials, significantly enhance the appeal and adoption of air starters. Furthermore, increasingly stringent government regulations on emission standards are a key driver, pushing for the adoption of cleaner and more efficient technologies.
Challenges & Restraints:
Significant challenges impacting the market include supply chain disruptions, particularly affecting the availability of raw materials and crucial components. These disruptions directly impact production costs and lead times. Stringent environmental regulations and safety standards impose considerable compliance costs on manufacturers. Finally, the intensely competitive market environment exerts downward pressure on prices, potentially impacting profitability and growth in the short term.
Growth Drivers in the Air Starter Industry Market
The key growth drivers in the air starter industry are multifaceted. The escalating global demand for reliable engine starting mechanisms across a broad spectrum of industries stands out. In parallel, technological advancements focusing on improved efficiency and durability of air starters play a significant role. Furthermore, government regulations aimed at emission reduction incentivize manufacturers to adopt cleaner and more efficient technologies, ultimately contributing to market expansion.
Challenges Impacting Air Starter Industry Growth
Several challenges hinder the growth of the air starter industry. Supply chain disruptions and escalating material costs directly affect profitability. Stringent environmental regulations necessitate substantial investments in compliance, further increasing costs. Finally, aggressive price competition among industry players limits profitability margins.
Key Players Shaping the Air Starter Industry Market
- Maradyne Corp
- Austart Air Starters
- Ingersoll-Rand Plc
- Miller Air Starter Co Inc
- IPU Group
- Multi Torque Industries Pty Ltd
- The Rowland Company
- KH Equipment Pty Ltd
- Air Starter Components
- Gali Group
Significant Air Starter Industry Industry Milestones
- 2020: Ingersoll Rand releases a new line of high-efficiency air starters.
- 2021: Maradyne Corp acquires a smaller competitor, expanding its market share.
- 2022: New emission standards implemented in several key markets.
- 2023: Several companies launch new air starters incorporating sustainable materials.
Future Outlook for Air Starter Industry Market
The air starter industry is projected to experience robust growth over the forecast period, driven by continued investment in energy and resource extraction sectors. Technological innovations and increasing demand for reliable starting mechanisms will further stimulate market expansion. Opportunities exist for companies that can offer efficient, cost-effective, and sustainable solutions. Strategic partnerships and acquisitions are expected to shape the competitive landscape.
Air Starter Industry Segmentation
-
1. Type
- 1.1. Vane Air Starter
- 1.2. Turbine Air Starter
-
2. End-User
- 2.1. Oil & Gas
- 2.2. Power Generation
- 2.3. Mining
- 2.4. Others
Air Starter Industry Segmentation By Geography
- 1. North America
- 2. Asia Pacific
- 3. Europe
- 4. South America
- 5. Middle East and Africa
Air Starter Industry REPORT HIGHLIGHTS
| Aspects | Details |
|---|---|
| Study Period | 2019-2033 |
| Base Year | 2024 |
| Estimated Year | 2025 |
| Forecast Period | 2025-2033 |
| Historical Period | 2019-2024 |
| Growth Rate | CAGR of > 3.00% from 2019-2033 |
| Segmentation |
|
Table of Contents
- 1. Introduction
- 1.1. Research Scope
- 1.2. Market Segmentation
- 1.3. Research Methodology
- 1.4. Definitions and Assumptions
- 2. Executive Summary
- 2.1. Introduction
- 3. Market Dynamics
- 3.1. Introduction
- 3.2. Market Drivers
- 3.2.1. 4.; Growing Vehicle Ownership4.; Government Initiatives
- 3.3. Market Restrains
- 3.3.1. 4.; Volatile Crude Oil Prices
- 3.4. Market Trends
- 3.4.1. Oil & Gas Sector to Dominate the Market
- 4. Market Factor Analysis
- 4.1. Porters Five Forces
- 4.2. Supply/Value Chain
- 4.3. PESTEL analysis
- 4.4. Market Entropy
- 4.5. Patent/Trademark Analysis
- 5. Global Air Starter Industry Analysis, Insights and Forecast, 2019-2031
- 5.1. Market Analysis, Insights and Forecast - by Type
- 5.1.1. Vane Air Starter
- 5.1.2. Turbine Air Starter
- 5.2. Market Analysis, Insights and Forecast - by End-User
- 5.2.1. Oil & Gas
- 5.2.2. Power Generation
- 5.2.3. Mining
- 5.2.4. Others
- 5.3. Market Analysis, Insights and Forecast - by Region
- 5.3.1. North America
- 5.3.2. Asia Pacific
- 5.3.3. Europe
- 5.3.4. South America
- 5.3.5. Middle East and Africa
- 5.1. Market Analysis, Insights and Forecast - by Type
- 6. North America Air Starter Industry Analysis, Insights and Forecast, 2019-2031
- 6.1. Market Analysis, Insights and Forecast - by Type
- 6.1.1. Vane Air Starter
- 6.1.2. Turbine Air Starter
- 6.2. Market Analysis, Insights and Forecast - by End-User
- 6.2.1. Oil & Gas
- 6.2.2. Power Generation
- 6.2.3. Mining
- 6.2.4. Others
- 6.1. Market Analysis, Insights and Forecast - by Type
- 7. Asia Pacific Air Starter Industry Analysis, Insights and Forecast, 2019-2031
- 7.1. Market Analysis, Insights and Forecast - by Type
- 7.1.1. Vane Air Starter
- 7.1.2. Turbine Air Starter
- 7.2. Market Analysis, Insights and Forecast - by End-User
- 7.2.1. Oil & Gas
- 7.2.2. Power Generation
- 7.2.3. Mining
- 7.2.4. Others
- 7.1. Market Analysis, Insights and Forecast - by Type
- 8. Europe Air Starter Industry Analysis, Insights and Forecast, 2019-2031
- 8.1. Market Analysis, Insights and Forecast - by Type
- 8.1.1. Vane Air Starter
- 8.1.2. Turbine Air Starter
- 8.2. Market Analysis, Insights and Forecast - by End-User
- 8.2.1. Oil & Gas
- 8.2.2. Power Generation
- 8.2.3. Mining
- 8.2.4. Others
- 8.1. Market Analysis, Insights and Forecast - by Type
- 9. South America Air Starter Industry Analysis, Insights and Forecast, 2019-2031
- 9.1. Market Analysis, Insights and Forecast - by Type
- 9.1.1. Vane Air Starter
- 9.1.2. Turbine Air Starter
- 9.2. Market Analysis, Insights and Forecast - by End-User
- 9.2.1. Oil & Gas
- 9.2.2. Power Generation
- 9.2.3. Mining
- 9.2.4. Others
- 9.1. Market Analysis, Insights and Forecast - by Type
- 10. Middle East and Africa Air Starter Industry Analysis, Insights and Forecast, 2019-2031
- 10.1. Market Analysis, Insights and Forecast - by Type
- 10.1.1. Vane Air Starter
- 10.1.2. Turbine Air Starter
- 10.2. Market Analysis, Insights and Forecast - by End-User
- 10.2.1. Oil & Gas
- 10.2.2. Power Generation
- 10.2.3. Mining
- 10.2.4. Others
- 10.1. Market Analysis, Insights and Forecast - by Type
- 11. North America Air Starter Industry Analysis, Insights and Forecast, 2019-2031
- 11.1. Market Analysis, Insights and Forecast - By Country/Sub-region
- 11.1.1 United States
- 11.1.2 Canada
- 11.1.3 Mexico
- 12. Europe Air Starter Industry Analysis, Insights and Forecast, 2019-2031
- 12.1. Market Analysis, Insights and Forecast - By Country/Sub-region
- 12.1.1 Germany
- 12.1.2 United Kingdom
- 12.1.3 France
- 12.1.4 Spain
- 12.1.5 Italy
- 12.1.6 Spain
- 12.1.7 Belgium
- 12.1.8 Netherland
- 12.1.9 Nordics
- 12.1.10 Rest of Europe
- 13. Asia Pacific Air Starter Industry Analysis, Insights and Forecast, 2019-2031
- 13.1. Market Analysis, Insights and Forecast - By Country/Sub-region
- 13.1.1 China
- 13.1.2 Japan
- 13.1.3 India
- 13.1.4 South Korea
- 13.1.5 Southeast Asia
- 13.1.6 Australia
- 13.1.7 Indonesia
- 13.1.8 Phillipes
- 13.1.9 Singapore
- 13.1.10 Thailandc
- 13.1.11 Rest of Asia Pacific
- 14. South America Air Starter Industry Analysis, Insights and Forecast, 2019-2031
- 14.1. Market Analysis, Insights and Forecast - By Country/Sub-region
- 14.1.1 Brazil
- 14.1.2 Argentina
- 14.1.3 Peru
- 14.1.4 Chile
- 14.1.5 Colombia
- 14.1.6 Ecuador
- 14.1.7 Venezuela
- 14.1.8 Rest of South America
- 15. MEA Air Starter Industry Analysis, Insights and Forecast, 2019-2031
- 15.1. Market Analysis, Insights and Forecast - By Country/Sub-region
- 15.1.1 United Arab Emirates
- 15.1.2 Saudi Arabia
- 15.1.3 South Africa
- 15.1.4 Rest of Middle East and Africa
- 16. Competitive Analysis
- 16.1. Global Market Share Analysis 2024
- 16.2. Company Profiles
- 16.2.1 Maradyne Corp
- 16.2.1.1. Overview
- 16.2.1.2. Products
- 16.2.1.3. SWOT Analysis
- 16.2.1.4. Recent Developments
- 16.2.1.5. Financials (Based on Availability)
- 16.2.2 Austart Air Starters
- 16.2.2.1. Overview
- 16.2.2.2. Products
- 16.2.2.3. SWOT Analysis
- 16.2.2.4. Recent Developments
- 16.2.2.5. Financials (Based on Availability)
- 16.2.3 Ingersoll-Rand Plc
- 16.2.3.1. Overview
- 16.2.3.2. Products
- 16.2.3.3. SWOT Analysis
- 16.2.3.4. Recent Developments
- 16.2.3.5. Financials (Based on Availability)
- 16.2.4 Miller Air Starter Co Inc
- 16.2.4.1. Overview
- 16.2.4.2. Products
- 16.2.4.3. SWOT Analysis
- 16.2.4.4. Recent Developments
- 16.2.4.5. Financials (Based on Availability)
- 16.2.5 IPU Group
- 16.2.5.1. Overview
- 16.2.5.2. Products
- 16.2.5.3. SWOT Analysis
- 16.2.5.4. Recent Developments
- 16.2.5.5. Financials (Based on Availability)
- 16.2.6 Multi Torque Industries Pty Ltd
- 16.2.6.1. Overview
- 16.2.6.2. Products
- 16.2.6.3. SWOT Analysis
- 16.2.6.4. Recent Developments
- 16.2.6.5. Financials (Based on Availability)
- 16.2.7 The Rowland Company
- 16.2.7.1. Overview
- 16.2.7.2. Products
- 16.2.7.3. SWOT Analysis
- 16.2.7.4. Recent Developments
- 16.2.7.5. Financials (Based on Availability)
- 16.2.8 KH Equipment Pty Ltd
- 16.2.8.1. Overview
- 16.2.8.2. Products
- 16.2.8.3. SWOT Analysis
- 16.2.8.4. Recent Developments
- 16.2.8.5. Financials (Based on Availability)
- 16.2.9 Air Starter Components
- 16.2.9.1. Overview
- 16.2.9.2. Products
- 16.2.9.3. SWOT Analysis
- 16.2.9.4. Recent Developments
- 16.2.9.5. Financials (Based on Availability)
- 16.2.10 Gali Group
- 16.2.10.1. Overview
- 16.2.10.2. Products
- 16.2.10.3. SWOT Analysis
- 16.2.10.4. Recent Developments
- 16.2.10.5. Financials (Based on Availability)
- 16.2.1 Maradyne Corp
List of Figures
- Figure 1: Global Air Starter Industry Revenue Breakdown (Million, %) by Region 2024 & 2032
- Figure 2: Global Air Starter Industry Volume Breakdown (K Units, %) by Region 2024 & 2032
- Figure 3: North America Air Starter Industry Revenue (Million), by Country 2024 & 2032
- Figure 4: North America Air Starter Industry Volume (K Units), by Country 2024 & 2032
- Figure 5: North America Air Starter Industry Revenue Share (%), by Country 2024 & 2032
- Figure 6: North America Air Starter Industry Volume Share (%), by Country 2024 & 2032
- Figure 7: Europe Air Starter Industry Revenue (Million), by Country 2024 & 2032
- Figure 8: Europe Air Starter Industry Volume (K Units), by Country 2024 & 2032
- Figure 9: Europe Air Starter Industry Revenue Share (%), by Country 2024 & 2032
- Figure 10: Europe Air Starter Industry Volume Share (%), by Country 2024 & 2032
- Figure 11: Asia Pacific Air Starter Industry Revenue (Million), by Country 2024 & 2032
- Figure 12: Asia Pacific Air Starter Industry Volume (K Units), by Country 2024 & 2032
- Figure 13: Asia Pacific Air Starter Industry Revenue Share (%), by Country 2024 & 2032
- Figure 14: Asia Pacific Air Starter Industry Volume Share (%), by Country 2024 & 2032
- Figure 15: South America Air Starter Industry Revenue (Million), by Country 2024 & 2032
- Figure 16: South America Air Starter Industry Volume (K Units), by Country 2024 & 2032
- Figure 17: South America Air Starter Industry Revenue Share (%), by Country 2024 & 2032
- Figure 18: South America Air Starter Industry Volume Share (%), by Country 2024 & 2032
- Figure 19: MEA Air Starter Industry Revenue (Million), by Country 2024 & 2032
- Figure 20: MEA Air Starter Industry Volume (K Units), by Country 2024 & 2032
- Figure 21: MEA Air Starter Industry Revenue Share (%), by Country 2024 & 2032
- Figure 22: MEA Air Starter Industry Volume Share (%), by Country 2024 & 2032
- Figure 23: North America Air Starter Industry Revenue (Million), by Type 2024 & 2032
- Figure 24: North America Air Starter Industry Volume (K Units), by Type 2024 & 2032
- Figure 25: North America Air Starter Industry Revenue Share (%), by Type 2024 & 2032
- Figure 26: North America Air Starter Industry Volume Share (%), by Type 2024 & 2032
- Figure 27: North America Air Starter Industry Revenue (Million), by End-User 2024 & 2032
- Figure 28: North America Air Starter Industry Volume (K Units), by End-User 2024 & 2032
- Figure 29: North America Air Starter Industry Revenue Share (%), by End-User 2024 & 2032
- Figure 30: North America Air Starter Industry Volume Share (%), by End-User 2024 & 2032
- Figure 31: North America Air Starter Industry Revenue (Million), by Country 2024 & 2032
- Figure 32: North America Air Starter Industry Volume (K Units), by Country 2024 & 2032
- Figure 33: North America Air Starter Industry Revenue Share (%), by Country 2024 & 2032
- Figure 34: North America Air Starter Industry Volume Share (%), by Country 2024 & 2032
- Figure 35: Asia Pacific Air Starter Industry Revenue (Million), by Type 2024 & 2032
- Figure 36: Asia Pacific Air Starter Industry Volume (K Units), by Type 2024 & 2032
- Figure 37: Asia Pacific Air Starter Industry Revenue Share (%), by Type 2024 & 2032
- Figure 38: Asia Pacific Air Starter Industry Volume Share (%), by Type 2024 & 2032
- Figure 39: Asia Pacific Air Starter Industry Revenue (Million), by End-User 2024 & 2032
- Figure 40: Asia Pacific Air Starter Industry Volume (K Units), by End-User 2024 & 2032
- Figure 41: Asia Pacific Air Starter Industry Revenue Share (%), by End-User 2024 & 2032
- Figure 42: Asia Pacific Air Starter Industry Volume Share (%), by End-User 2024 & 2032
- Figure 43: Asia Pacific Air Starter Industry Revenue (Million), by Country 2024 & 2032
- Figure 44: Asia Pacific Air Starter Industry Volume (K Units), by Country 2024 & 2032
- Figure 45: Asia Pacific Air Starter Industry Revenue Share (%), by Country 2024 & 2032
- Figure 46: Asia Pacific Air Starter Industry Volume Share (%), by Country 2024 & 2032
- Figure 47: Europe Air Starter Industry Revenue (Million), by Type 2024 & 2032
- Figure 48: Europe Air Starter Industry Volume (K Units), by Type 2024 & 2032
- Figure 49: Europe Air Starter Industry Revenue Share (%), by Type 2024 & 2032
- Figure 50: Europe Air Starter Industry Volume Share (%), by Type 2024 & 2032
- Figure 51: Europe Air Starter Industry Revenue (Million), by End-User 2024 & 2032
- Figure 52: Europe Air Starter Industry Volume (K Units), by End-User 2024 & 2032
- Figure 53: Europe Air Starter Industry Revenue Share (%), by End-User 2024 & 2032
- Figure 54: Europe Air Starter Industry Volume Share (%), by End-User 2024 & 2032
- Figure 55: Europe Air Starter Industry Revenue (Million), by Country 2024 & 2032
- Figure 56: Europe Air Starter Industry Volume (K Units), by Country 2024 & 2032
- Figure 57: Europe Air Starter Industry Revenue Share (%), by Country 2024 & 2032
- Figure 58: Europe Air Starter Industry Volume Share (%), by Country 2024 & 2032
- Figure 59: South America Air Starter Industry Revenue (Million), by Type 2024 & 2032
- Figure 60: South America Air Starter Industry Volume (K Units), by Type 2024 & 2032
- Figure 61: South America Air Starter Industry Revenue Share (%), by Type 2024 & 2032
- Figure 62: South America Air Starter Industry Volume Share (%), by Type 2024 & 2032
- Figure 63: South America Air Starter Industry Revenue (Million), by End-User 2024 & 2032
- Figure 64: South America Air Starter Industry Volume (K Units), by End-User 2024 & 2032
- Figure 65: South America Air Starter Industry Revenue Share (%), by End-User 2024 & 2032
- Figure 66: South America Air Starter Industry Volume Share (%), by End-User 2024 & 2032
- Figure 67: South America Air Starter Industry Revenue (Million), by Country 2024 & 2032
- Figure 68: South America Air Starter Industry Volume (K Units), by Country 2024 & 2032
- Figure 69: South America Air Starter Industry Revenue Share (%), by Country 2024 & 2032
- Figure 70: South America Air Starter Industry Volume Share (%), by Country 2024 & 2032
- Figure 71: Middle East and Africa Air Starter Industry Revenue (Million), by Type 2024 & 2032
- Figure 72: Middle East and Africa Air Starter Industry Volume (K Units), by Type 2024 & 2032
- Figure 73: Middle East and Africa Air Starter Industry Revenue Share (%), by Type 2024 & 2032
- Figure 74: Middle East and Africa Air Starter Industry Volume Share (%), by Type 2024 & 2032
- Figure 75: Middle East and Africa Air Starter Industry Revenue (Million), by End-User 2024 & 2032
- Figure 76: Middle East and Africa Air Starter Industry Volume (K Units), by End-User 2024 & 2032
- Figure 77: Middle East and Africa Air Starter Industry Revenue Share (%), by End-User 2024 & 2032
- Figure 78: Middle East and Africa Air Starter Industry Volume Share (%), by End-User 2024 & 2032
- Figure 79: Middle East and Africa Air Starter Industry Revenue (Million), by Country 2024 & 2032
- Figure 80: Middle East and Africa Air Starter Industry Volume (K Units), by Country 2024 & 2032
- Figure 81: Middle East and Africa Air Starter Industry Revenue Share (%), by Country 2024 & 2032
- Figure 82: Middle East and Africa Air Starter Industry Volume Share (%), by Country 2024 & 2032
List of Tables
- Table 1: Global Air Starter Industry Revenue Million Forecast, by Region 2019 & 2032
- Table 2: Global Air Starter Industry Volume K Units Forecast, by Region 2019 & 2032
- Table 3: Global Air Starter Industry Revenue Million Forecast, by Type 2019 & 2032
- Table 4: Global Air Starter Industry Volume K Units Forecast, by Type 2019 & 2032
- Table 5: Global Air Starter Industry Revenue Million Forecast, by End-User 2019 & 2032
- Table 6: Global Air Starter Industry Volume K Units Forecast, by End-User 2019 & 2032
- Table 7: Global Air Starter Industry Revenue Million Forecast, by Region 2019 & 2032
- Table 8: Global Air Starter Industry Volume K Units Forecast, by Region 2019 & 2032
- Table 9: Global Air Starter Industry Revenue Million Forecast, by Country 2019 & 2032
- Table 10: Global Air Starter Industry Volume K Units Forecast, by Country 2019 & 2032
- Table 11: United States Air Starter Industry Revenue (Million) Forecast, by Application 2019 & 2032
- Table 12: United States Air Starter Industry Volume (K Units) Forecast, by Application 2019 & 2032
- Table 13: Canada Air Starter Industry Revenue (Million) Forecast, by Application 2019 & 2032
- Table 14: Canada Air Starter Industry Volume (K Units) Forecast, by Application 2019 & 2032
- Table 15: Mexico Air Starter Industry Revenue (Million) Forecast, by Application 2019 & 2032
- Table 16: Mexico Air Starter Industry Volume (K Units) Forecast, by Application 2019 & 2032
- Table 17: Global Air Starter Industry Revenue Million Forecast, by Country 2019 & 2032
- Table 18: Global Air Starter Industry Volume K Units Forecast, by Country 2019 & 2032
- Table 19: Germany Air Starter Industry Revenue (Million) Forecast, by Application 2019 & 2032
- Table 20: Germany Air Starter Industry Volume (K Units) Forecast, by Application 2019 & 2032
- Table 21: United Kingdom Air Starter Industry Revenue (Million) Forecast, by Application 2019 & 2032
- Table 22: United Kingdom Air Starter Industry Volume (K Units) Forecast, by Application 2019 & 2032
- Table 23: France Air Starter Industry Revenue (Million) Forecast, by Application 2019 & 2032
- Table 24: France Air Starter Industry Volume (K Units) Forecast, by Application 2019 & 2032
- Table 25: Spain Air Starter Industry Revenue (Million) Forecast, by Application 2019 & 2032
- Table 26: Spain Air Starter Industry Volume (K Units) Forecast, by Application 2019 & 2032
- Table 27: Italy Air Starter Industry Revenue (Million) Forecast, by Application 2019 & 2032
- Table 28: Italy Air Starter Industry Volume (K Units) Forecast, by Application 2019 & 2032
- Table 29: Spain Air Starter Industry Revenue (Million) Forecast, by Application 2019 & 2032
- Table 30: Spain Air Starter Industry Volume (K Units) Forecast, by Application 2019 & 2032
- Table 31: Belgium Air Starter Industry Revenue (Million) Forecast, by Application 2019 & 2032
- Table 32: Belgium Air Starter Industry Volume (K Units) Forecast, by Application 2019 & 2032
- Table 33: Netherland Air Starter Industry Revenue (Million) Forecast, by Application 2019 & 2032
- Table 34: Netherland Air Starter Industry Volume (K Units) Forecast, by Application 2019 & 2032
- Table 35: Nordics Air Starter Industry Revenue (Million) Forecast, by Application 2019 & 2032
- Table 36: Nordics Air Starter Industry Volume (K Units) Forecast, by Application 2019 & 2032
- Table 37: Rest of Europe Air Starter Industry Revenue (Million) Forecast, by Application 2019 & 2032
- Table 38: Rest of Europe Air Starter Industry Volume (K Units) Forecast, by Application 2019 & 2032
- Table 39: Global Air Starter Industry Revenue Million Forecast, by Country 2019 & 2032
- Table 40: Global Air Starter Industry Volume K Units Forecast, by Country 2019 & 2032
- Table 41: China Air Starter Industry Revenue (Million) Forecast, by Application 2019 & 2032
- Table 42: China Air Starter Industry Volume (K Units) Forecast, by Application 2019 & 2032
- Table 43: Japan Air Starter Industry Revenue (Million) Forecast, by Application 2019 & 2032
- Table 44: Japan Air Starter Industry Volume (K Units) Forecast, by Application 2019 & 2032
- Table 45: India Air Starter Industry Revenue (Million) Forecast, by Application 2019 & 2032
- Table 46: India Air Starter Industry Volume (K Units) Forecast, by Application 2019 & 2032
- Table 47: South Korea Air Starter Industry Revenue (Million) Forecast, by Application 2019 & 2032
- Table 48: South Korea Air Starter Industry Volume (K Units) Forecast, by Application 2019 & 2032
- Table 49: Southeast Asia Air Starter Industry Revenue (Million) Forecast, by Application 2019 & 2032
- Table 50: Southeast Asia Air Starter Industry Volume (K Units) Forecast, by Application 2019 & 2032
- Table 51: Australia Air Starter Industry Revenue (Million) Forecast, by Application 2019 & 2032
- Table 52: Australia Air Starter Industry Volume (K Units) Forecast, by Application 2019 & 2032
- Table 53: Indonesia Air Starter Industry Revenue (Million) Forecast, by Application 2019 & 2032
- Table 54: Indonesia Air Starter Industry Volume (K Units) Forecast, by Application 2019 & 2032
- Table 55: Phillipes Air Starter Industry Revenue (Million) Forecast, by Application 2019 & 2032
- Table 56: Phillipes Air Starter Industry Volume (K Units) Forecast, by Application 2019 & 2032
- Table 57: Singapore Air Starter Industry Revenue (Million) Forecast, by Application 2019 & 2032
- Table 58: Singapore Air Starter Industry Volume (K Units) Forecast, by Application 2019 & 2032
- Table 59: Thailandc Air Starter Industry Revenue (Million) Forecast, by Application 2019 & 2032
- Table 60: Thailandc Air Starter Industry Volume (K Units) Forecast, by Application 2019 & 2032
- Table 61: Rest of Asia Pacific Air Starter Industry Revenue (Million) Forecast, by Application 2019 & 2032
- Table 62: Rest of Asia Pacific Air Starter Industry Volume (K Units) Forecast, by Application 2019 & 2032
- Table 63: Global Air Starter Industry Revenue Million Forecast, by Country 2019 & 2032
- Table 64: Global Air Starter Industry Volume K Units Forecast, by Country 2019 & 2032
- Table 65: Brazil Air Starter Industry Revenue (Million) Forecast, by Application 2019 & 2032
- Table 66: Brazil Air Starter Industry Volume (K Units) Forecast, by Application 2019 & 2032
- Table 67: Argentina Air Starter Industry Revenue (Million) Forecast, by Application 2019 & 2032
- Table 68: Argentina Air Starter Industry Volume (K Units) Forecast, by Application 2019 & 2032
- Table 69: Peru Air Starter Industry Revenue (Million) Forecast, by Application 2019 & 2032
- Table 70: Peru Air Starter Industry Volume (K Units) Forecast, by Application 2019 & 2032
- Table 71: Chile Air Starter Industry Revenue (Million) Forecast, by Application 2019 & 2032
- Table 72: Chile Air Starter Industry Volume (K Units) Forecast, by Application 2019 & 2032
- Table 73: Colombia Air Starter Industry Revenue (Million) Forecast, by Application 2019 & 2032
- Table 74: Colombia Air Starter Industry Volume (K Units) Forecast, by Application 2019 & 2032
- Table 75: Ecuador Air Starter Industry Revenue (Million) Forecast, by Application 2019 & 2032
- Table 76: Ecuador Air Starter Industry Volume (K Units) Forecast, by Application 2019 & 2032
- Table 77: Venezuela Air Starter Industry Revenue (Million) Forecast, by Application 2019 & 2032
- Table 78: Venezuela Air Starter Industry Volume (K Units) Forecast, by Application 2019 & 2032
- Table 79: Rest of South America Air Starter Industry Revenue (Million) Forecast, by Application 2019 & 2032
- Table 80: Rest of South America Air Starter Industry Volume (K Units) Forecast, by Application 2019 & 2032
- Table 81: Global Air Starter Industry Revenue Million Forecast, by Country 2019 & 2032
- Table 82: Global Air Starter Industry Volume K Units Forecast, by Country 2019 & 2032
- Table 83: United Arab Emirates Air Starter Industry Revenue (Million) Forecast, by Application 2019 & 2032
- Table 84: United Arab Emirates Air Starter Industry Volume (K Units) Forecast, by Application 2019 & 2032
- Table 85: Saudi Arabia Air Starter Industry Revenue (Million) Forecast, by Application 2019 & 2032
- Table 86: Saudi Arabia Air Starter Industry Volume (K Units) Forecast, by Application 2019 & 2032
- Table 87: South Africa Air Starter Industry Revenue (Million) Forecast, by Application 2019 & 2032
- Table 88: South Africa Air Starter Industry Volume (K Units) Forecast, by Application 2019 & 2032
- Table 89: Rest of Middle East and Africa Air Starter Industry Revenue (Million) Forecast, by Application 2019 & 2032
- Table 90: Rest of Middle East and Africa Air Starter Industry Volume (K Units) Forecast, by Application 2019 & 2032
- Table 91: Global Air Starter Industry Revenue Million Forecast, by Type 2019 & 2032
- Table 92: Global Air Starter Industry Volume K Units Forecast, by Type 2019 & 2032
- Table 93: Global Air Starter Industry Revenue Million Forecast, by End-User 2019 & 2032
- Table 94: Global Air Starter Industry Volume K Units Forecast, by End-User 2019 & 2032
- Table 95: Global Air Starter Industry Revenue Million Forecast, by Country 2019 & 2032
- Table 96: Global Air Starter Industry Volume K Units Forecast, by Country 2019 & 2032
- Table 97: Global Air Starter Industry Revenue Million Forecast, by Type 2019 & 2032
- Table 98: Global Air Starter Industry Volume K Units Forecast, by Type 2019 & 2032
- Table 99: Global Air Starter Industry Revenue Million Forecast, by End-User 2019 & 2032
- Table 100: Global Air Starter Industry Volume K Units Forecast, by End-User 2019 & 2032
- Table 101: Global Air Starter Industry Revenue Million Forecast, by Country 2019 & 2032
- Table 102: Global Air Starter Industry Volume K Units Forecast, by Country 2019 & 2032
- Table 103: Global Air Starter Industry Revenue Million Forecast, by Type 2019 & 2032
- Table 104: Global Air Starter Industry Volume K Units Forecast, by Type 2019 & 2032
- Table 105: Global Air Starter Industry Revenue Million Forecast, by End-User 2019 & 2032
- Table 106: Global Air Starter Industry Volume K Units Forecast, by End-User 2019 & 2032
- Table 107: Global Air Starter Industry Revenue Million Forecast, by Country 2019 & 2032
- Table 108: Global Air Starter Industry Volume K Units Forecast, by Country 2019 & 2032
- Table 109: Global Air Starter Industry Revenue Million Forecast, by Type 2019 & 2032
- Table 110: Global Air Starter Industry Volume K Units Forecast, by Type 2019 & 2032
- Table 111: Global Air Starter Industry Revenue Million Forecast, by End-User 2019 & 2032
- Table 112: Global Air Starter Industry Volume K Units Forecast, by End-User 2019 & 2032
- Table 113: Global Air Starter Industry Revenue Million Forecast, by Country 2019 & 2032
- Table 114: Global Air Starter Industry Volume K Units Forecast, by Country 2019 & 2032
- Table 115: Global Air Starter Industry Revenue Million Forecast, by Type 2019 & 2032
- Table 116: Global Air Starter Industry Volume K Units Forecast, by Type 2019 & 2032
- Table 117: Global Air Starter Industry Revenue Million Forecast, by End-User 2019 & 2032
- Table 118: Global Air Starter Industry Volume K Units Forecast, by End-User 2019 & 2032
- Table 119: Global Air Starter Industry Revenue Million Forecast, by Country 2019 & 2032
- Table 120: Global Air Starter Industry Volume K Units Forecast, by Country 2019 & 2032
Frequently Asked Questions
1. What is the projected Compound Annual Growth Rate (CAGR) of the Air Starter Industry?
The projected CAGR is approximately > 3.00%.
2. Which companies are prominent players in the Air Starter Industry?
Key companies in the market include Maradyne Corp, Austart Air Starters, Ingersoll-Rand Plc, Miller Air Starter Co Inc, IPU Group, Multi Torque Industries Pty Ltd, The Rowland Company, KH Equipment Pty Ltd, Air Starter Components, Gali Group.
3. What are the main segments of the Air Starter Industry?
The market segments include Type, End-User.
4. Can you provide details about the market size?
The market size is estimated to be USD XX Million as of 2022.
5. What are some drivers contributing to market growth?
4.; Growing Vehicle Ownership4.; Government Initiatives.
6. What are the notable trends driving market growth?
Oil & Gas Sector to Dominate the Market.
7. Are there any restraints impacting market growth?
4.; Volatile Crude Oil Prices.
8. Can you provide examples of recent developments in the market?
N/A
9. What pricing options are available for accessing the report?
Pricing options include single-user, multi-user, and enterprise licenses priced at USD 4750, USD 5250, and USD 8750 respectively.
10. Is the market size provided in terms of value or volume?
The market size is provided in terms of value, measured in Million and volume, measured in K Units.
11. Are there any specific market keywords associated with the report?
Yes, the market keyword associated with the report is "Air Starter Industry," which aids in identifying and referencing the specific market segment covered.
12. How do I determine which pricing option suits my needs best?
The pricing options vary based on user requirements and access needs. Individual users may opt for single-user licenses, while businesses requiring broader access may choose multi-user or enterprise licenses for cost-effective access to the report.
13. Are there any additional resources or data provided in the Air Starter Industry report?
While the report offers comprehensive insights, it's advisable to review the specific contents or supplementary materials provided to ascertain if additional resources or data are available.
14. How can I stay updated on further developments or reports in the Air Starter Industry?
To stay informed about further developments, trends, and reports in the Air Starter Industry, consider subscribing to industry newsletters, following relevant companies and organizations, or regularly checking reputable industry news sources and publications.
Methodology
Step 1 - Identification of Relevant Samples Size from Population Database


Step 2 - Approaches for Defining Global Market Size (Value, Volume* & Price*)

Note*: In applicable scenarios
Step 3 - Data Sources
Primary Research
- Web Analytics
- Survey Reports
- Research Institute
- Latest Research Reports
- Opinion Leaders
Secondary Research
- Annual Reports
- White Paper
- Latest Press Release
- Industry Association
- Paid Database
- Investor Presentations

Step 4 - Data Triangulation
Involves using different sources of information in order to increase the validity of a study
These sources are likely to be stakeholders in a program - participants, other researchers, program staff, other community members, and so on.
Then we put all data in single framework & apply various statistical tools to find out the dynamic on the market.
During the analysis stage, feedback from the stakeholder groups would be compared to determine areas of agreement as well as areas of divergence
