

Key Insights
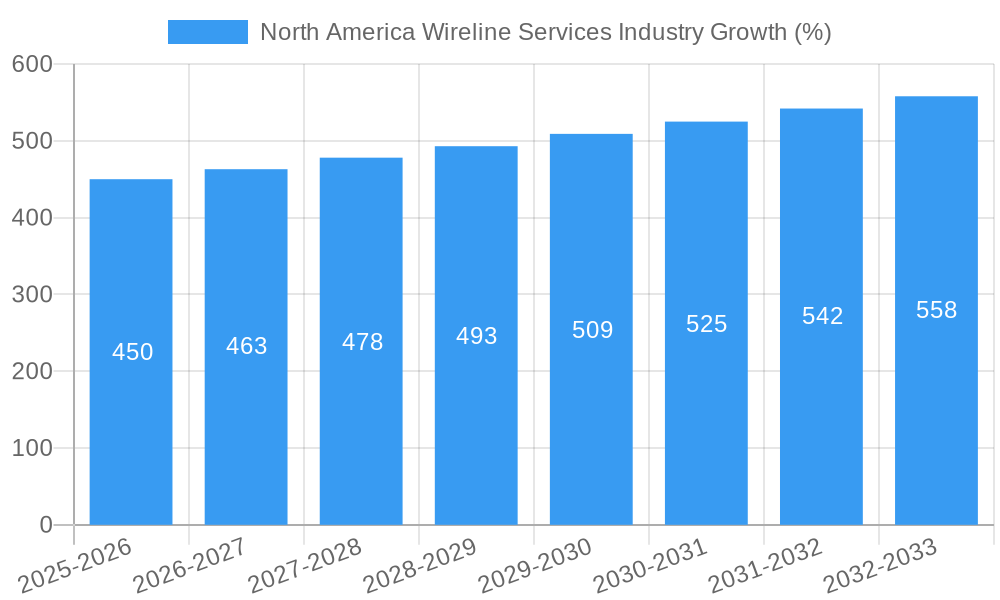
The North American wireline services market, encompassing electric line, slick line, open hole, and cased hole services deployed onshore and offshore, is experiencing robust growth. Driven by increasing oil and gas exploration and production activities, particularly in shale formations, the market is projected to maintain a Compound Annual Growth Rate (CAGR) exceeding 3% from 2025 to 2033. Technological advancements, such as improved logging tools and data acquisition techniques, are enhancing operational efficiency and driving demand. The shift toward enhanced oil recovery (EOR) methods also contributes to the market’s expansion, as wireline services are crucial for well intervention and stimulation treatments. While regulatory constraints and environmental concerns pose some challenges, the overall market outlook remains positive. Major players like Halliburton, Schlumberger, and Baker Hughes dominate the landscape, leveraging their technological prowess and extensive service networks. The onshore segment currently holds a larger market share due to the prevalence of onshore drilling activities in North America; however, offshore activities are expected to contribute significantly to market growth in the coming years. The open hole segment, essential for initial well evaluations, is also projected to witness significant growth.
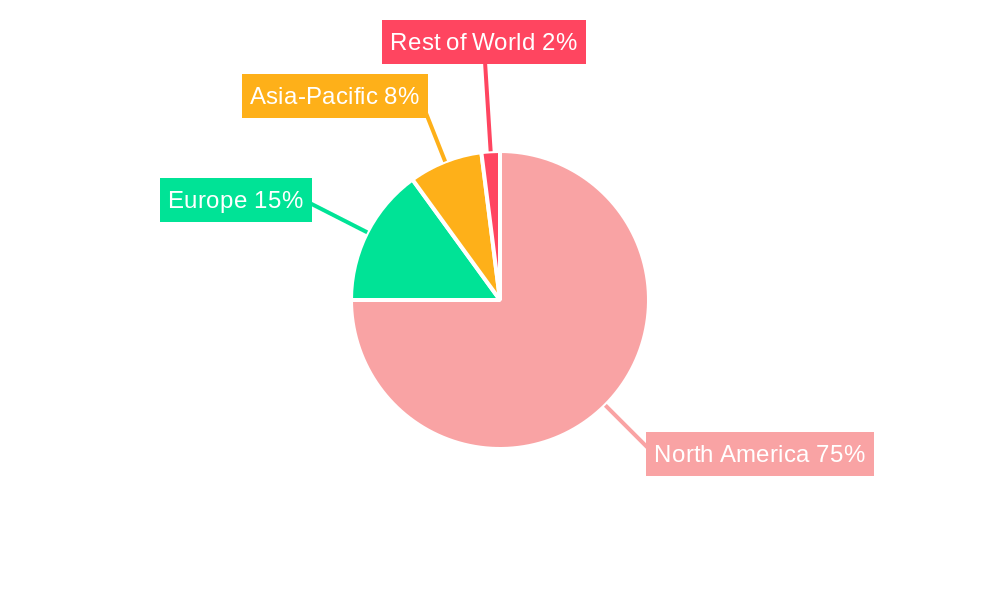
Competition within the North American wireline services market is intense, with companies vying for market share through technological innovation, service diversification, and strategic partnerships. The market's growth is expected to be geographically concentrated, with the United States being the largest contributor, followed by Canada and Mexico. The growth trajectory reflects a complex interplay of factors including fluctuating oil and gas prices, technological innovations, and government regulations. The industry's success hinges on adapting to the ever-evolving demands of the energy sector and consistently investing in research and development to offer advanced solutions. The market's future is tied to the continued exploration and production of hydrocarbons in North America, necessitating adaptability and strategic planning for companies to thrive in this dynamic environment.
North America Wireline Services Industry Report: 2019-2033
This comprehensive report provides a detailed analysis of the North America wireline services market, covering the period 2019-2033. It offers invaluable insights into market dynamics, competitive landscape, segment performance, and future growth projections, making it an essential resource for industry stakeholders, investors, and researchers. The report leverages extensive data analysis and industry expertise to provide a clear, concise, and actionable understanding of this dynamic sector. Expected market value in 2025 is estimated at xx Million.
North America Wireline Services Industry Market Structure & Competitive Landscape
The North America wireline services market is characterized by a moderately concentrated structure, with a few major players holding significant market share. Concentration ratios, such as the Herfindahl-Hirschman Index (HHI), will be calculated and presented within the full report. Innovation plays a crucial role, driven by the need for enhanced efficiency, improved safety, and the adoption of advanced technologies like automation and data analytics. Regulatory changes, including environmental regulations and safety standards, significantly impact market operations. The market witnesses substitution pressures from alternative well completion techniques. The end-user segmentation is primarily focused on upstream oil and gas companies, categorized by size and operational focus (onshore vs. offshore). Mergers and acquisitions (M&A) activity has been moderate in recent years, with an estimated xx Million USD in deal value over the 2019-2024 period. Key M&A trends include consolidation among smaller service providers and strategic acquisitions by larger companies to expand service offerings and geographic reach.
- Market Concentration: Moderate, with HHI calculated in the full report.
- Innovation Drivers: Enhanced efficiency, improved safety, automation, data analytics.
- Regulatory Impacts: Environmental regulations, safety standards.
- Product Substitutes: Alternative well completion technologies.
- End-User Segmentation: Upstream oil & gas companies (categorized by size and operational focus).
- M&A Trends: Consolidation, strategic acquisitions for expansion.
North America Wireline Services Industry Market Trends & Opportunities
The North America wireline services market is expected to witness steady growth throughout the forecast period (2025-2033), driven by increased oil and gas exploration and production activities, particularly in unconventional resource plays. The Compound Annual Growth Rate (CAGR) is projected at xx% during this period. Technological advancements, such as the development of advanced logging tools and automation systems, are enhancing operational efficiency and improving data quality. Consumer preferences are shifting towards providers that offer comprehensive solutions, integrating various wireline services with other well completion technologies. The competitive dynamics are characterized by intense rivalry amongst major players, leading to pricing pressures and a focus on differentiation through innovation and service quality. Market penetration rates vary significantly across different segments and regions. Further detailed analysis including specific regional data will be provided in the full report.
Dominant Markets & Segments in North America Wireline Services Industry
The onshore segment currently holds the largest market share, driven by extensive drilling activities in shale plays across North America. However, the offshore segment is expected to experience significant growth due to increasing exploration and production in deepwater environments. The electric line segment dominates the type category due to its versatility and higher efficiency compared to slick line services. Open hole operations currently lead the hole type segment. The United States is the largest market within North America, followed by Canada and Mexico.
- Key Growth Drivers (Onshore): Extensive shale gas and oil exploration and production; Government incentives; Increasing infrastructure development.
- Key Growth Drivers (Offshore): Rising deepwater exploration and production activities; technological advancements in offshore operations; government policies promoting energy independence.
- Dominant Regions: United States, Canada, Mexico.
- Dominant Segments: Onshore, Electric Line, Open Hole.
North America Wireline Services Industry Product Analysis
The wireline services industry is marked by continuous product innovation, with a focus on enhancing efficiency, safety, and data acquisition capabilities. New generation logging tools offer improved resolution and data processing capabilities, while automation and remote operations reduce the need for manual intervention, improving safety and operational efficiency. These advancements significantly impact market fit by enabling more accurate well evaluations, optimized completions, and ultimately reduced overall costs. The competitive advantage lies in offering cutting-edge technology and superior data analysis, which empowers clients to make informed decisions, increasing overall production and profitability.
Key Drivers, Barriers & Challenges in North America Wireline Services Industry
Key Drivers:
- Increasing demand for oil and gas, particularly from unconventional resources.
- Technological advancements enhancing efficiency and data acquisition.
- Government support for energy exploration and production.
Key Challenges:
- Fluctuations in oil and gas prices directly impacting demand and investment.
- Stringent environmental regulations increasing operational costs and complexity.
- Intense competition leading to pricing pressures and margins compression.
Growth Drivers in the North America Wireline Services Industry Market
The market is propelled by the persistent need for efficient and safe well completion and evaluation, leading to investments in advanced technologies and services. Growing demand for oil and gas from unconventional reservoirs necessitates high-quality wireline services. Supportive government policies in certain regions further fuel market expansion.
Challenges Impacting North America Wireline Services Industry Growth
Significant hurdles include fluctuations in energy prices, complex regulatory frameworks impacting profitability, and intense competition reducing profit margins. Supply chain disruptions and skilled labor shortages present further difficulties.
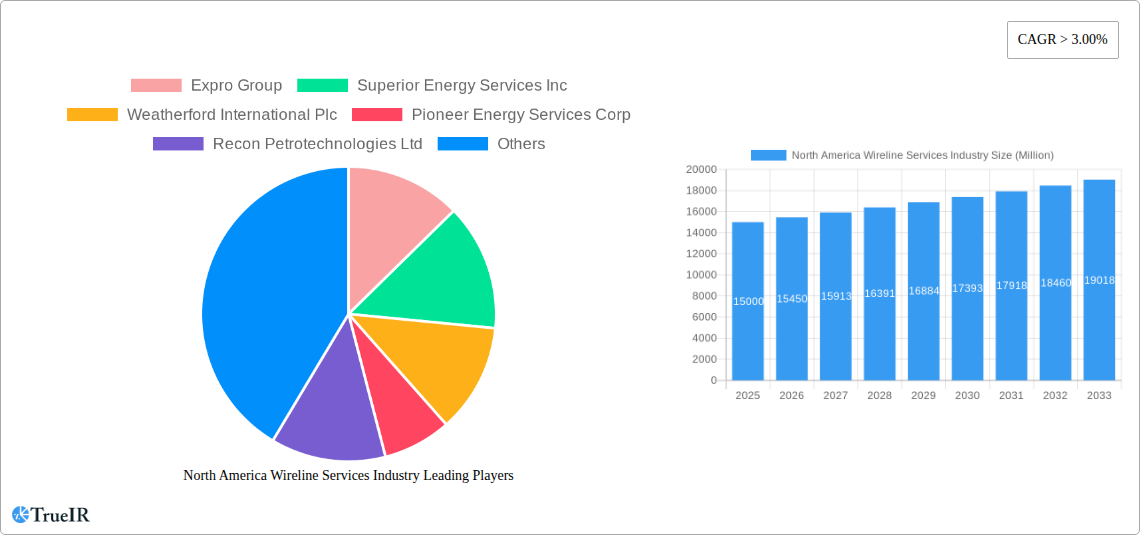
Key Players Shaping the North America Wireline Services Industry Market
- Expro Group
- Superior Energy Services Inc
- Weatherford International Plc
- Pioneer Energy Services Corp
- Recon Petrotechnologies Ltd
- SGS SA
- Nextier Oilfield Solutions Inc
- Baker Hughes Company
- Halliburton Company
- Schlumberger Limited
Significant North America Wireline Services Industry Milestones
- May 2022: Caliber Completion Services, LLC acquired substantially all the wireline assets from ClearWell Dynamics, LLC's subsidiary, formerly known as Pioneer Wireline Services, LLC.
- Q3 2022: Schlumberger awarded multiple scopes for an enhanced oil recovery pilot project by Denbury Onshore, LLC. This involved various downhole services and fiber optic solutions.
- Q3 2022: BP Canada Energy Group awarded Schlumberger an integrated well construction and evaluation contract for its Ephesus deepwater exploration well, signaling increased offshore activity.
Future Outlook for North America Wireline Services Industry Market
The North America wireline services market is poised for continued growth, driven by ongoing exploration and production activities, especially in unconventional resources. Technological advancements and the increasing demand for efficient and cost-effective well completion and evaluation solutions present significant opportunities for market expansion. Strategic partnerships and acquisitions are expected to further shape the competitive landscape. Further insights and detailed projections will be provided in the full report.
North America Wireline Services Industry Segmentation
-
1. Type
- 1.1. Electric Line
- 1.2. Slick Line
-
2. Hole Type
- 2.1. Open Hole
- 2.2. Cased Hole
-
3. Deployment
- 3.1. Onshore
- 3.2. Offshore
-
4. Geography
- 4.1. United States
- 4.2. Canada
- 4.3. Rest of North America
North America Wireline Services Industry Segmentation By Geography
- 1. United States
- 2. Canada
- 3. Rest of North America
North America Wireline Services Industry REPORT HIGHLIGHTS
| Aspects | Details |
|---|---|
| Study Period | 2019-2033 |
| Base Year | 2024 |
| Estimated Year | 2025 |
| Forecast Period | 2025-2033 |
| Historical Period | 2019-2024 |
| Growth Rate | CAGR of > 3.00% from 2019-2033 |
| Segmentation |
|
Table of Contents
- 1. Introduction
- 1.1. Research Scope
- 1.2. Market Segmentation
- 1.3. Research Methodology
- 1.4. Definitions and Assumptions
- 2. Executive Summary
- 2.1. Introduction
- 3. Market Dynamics
- 3.1. Introduction
- 3.2. Market Drivers
- 3.2.1. 4.; Increasing Automotive Sales in Saudi Arabia4.; Rising Demand from Heavy Automotives
- 3.3. Market Restrains
- 3.3.1. 4.; Rising Emphasis on Electric Vehicles
- 3.4. Market Trends
- 3.4.1. Onshore Segment to Dominate the Market
- 4. Market Factor Analysis
- 4.1. Porters Five Forces
- 4.2. Supply/Value Chain
- 4.3. PESTEL analysis
- 4.4. Market Entropy
- 4.5. Patent/Trademark Analysis
- 5. North America Wireline Services Industry Analysis, Insights and Forecast, 2019-2031
- 5.1. Market Analysis, Insights and Forecast - by Type
- 5.1.1. Electric Line
- 5.1.2. Slick Line
- 5.2. Market Analysis, Insights and Forecast - by Hole Type
- 5.2.1. Open Hole
- 5.2.2. Cased Hole
- 5.3. Market Analysis, Insights and Forecast - by Deployment
- 5.3.1. Onshore
- 5.3.2. Offshore
- 5.4. Market Analysis, Insights and Forecast - by Geography
- 5.4.1. United States
- 5.4.2. Canada
- 5.4.3. Rest of North America
- 5.5. Market Analysis, Insights and Forecast - by Region
- 5.5.1. United States
- 5.5.2. Canada
- 5.5.3. Rest of North America
- 5.1. Market Analysis, Insights and Forecast - by Type
- 6. United States North America Wireline Services Industry Analysis, Insights and Forecast, 2019-2031
- 6.1. Market Analysis, Insights and Forecast - by Type
- 6.1.1. Electric Line
- 6.1.2. Slick Line
- 6.2. Market Analysis, Insights and Forecast - by Hole Type
- 6.2.1. Open Hole
- 6.2.2. Cased Hole
- 6.3. Market Analysis, Insights and Forecast - by Deployment
- 6.3.1. Onshore
- 6.3.2. Offshore
- 6.4. Market Analysis, Insights and Forecast - by Geography
- 6.4.1. United States
- 6.4.2. Canada
- 6.4.3. Rest of North America
- 6.1. Market Analysis, Insights and Forecast - by Type
- 7. Canada North America Wireline Services Industry Analysis, Insights and Forecast, 2019-2031
- 7.1. Market Analysis, Insights and Forecast - by Type
- 7.1.1. Electric Line
- 7.1.2. Slick Line
- 7.2. Market Analysis, Insights and Forecast - by Hole Type
- 7.2.1. Open Hole
- 7.2.2. Cased Hole
- 7.3. Market Analysis, Insights and Forecast - by Deployment
- 7.3.1. Onshore
- 7.3.2. Offshore
- 7.4. Market Analysis, Insights and Forecast - by Geography
- 7.4.1. United States
- 7.4.2. Canada
- 7.4.3. Rest of North America
- 7.1. Market Analysis, Insights and Forecast - by Type
- 8. Rest of North America North America Wireline Services Industry Analysis, Insights and Forecast, 2019-2031
- 8.1. Market Analysis, Insights and Forecast - by Type
- 8.1.1. Electric Line
- 8.1.2. Slick Line
- 8.2. Market Analysis, Insights and Forecast - by Hole Type
- 8.2.1. Open Hole
- 8.2.2. Cased Hole
- 8.3. Market Analysis, Insights and Forecast - by Deployment
- 8.3.1. Onshore
- 8.3.2. Offshore
- 8.4. Market Analysis, Insights and Forecast - by Geography
- 8.4.1. United States
- 8.4.2. Canada
- 8.4.3. Rest of North America
- 8.1. Market Analysis, Insights and Forecast - by Type
- 9. United States North America Wireline Services Industry Analysis, Insights and Forecast, 2019-2031
- 10. Canada North America Wireline Services Industry Analysis, Insights and Forecast, 2019-2031
- 11. Mexico North America Wireline Services Industry Analysis, Insights and Forecast, 2019-2031
- 12. Rest of North America North America Wireline Services Industry Analysis, Insights and Forecast, 2019-2031
- 13. Competitive Analysis
- 13.1. Market Share Analysis 2024
- 13.2. Company Profiles
- 13.2.1 Expro Group
- 13.2.1.1. Overview
- 13.2.1.2. Products
- 13.2.1.3. SWOT Analysis
- 13.2.1.4. Recent Developments
- 13.2.1.5. Financials (Based on Availability)
- 13.2.2 Superior Energy Services Inc
- 13.2.2.1. Overview
- 13.2.2.2. Products
- 13.2.2.3. SWOT Analysis
- 13.2.2.4. Recent Developments
- 13.2.2.5. Financials (Based on Availability)
- 13.2.3 Weatherford International Plc
- 13.2.3.1. Overview
- 13.2.3.2. Products
- 13.2.3.3. SWOT Analysis
- 13.2.3.4. Recent Developments
- 13.2.3.5. Financials (Based on Availability)
- 13.2.4 Pioneer Energy Services Corp
- 13.2.4.1. Overview
- 13.2.4.2. Products
- 13.2.4.3. SWOT Analysis
- 13.2.4.4. Recent Developments
- 13.2.4.5. Financials (Based on Availability)
- 13.2.5 Recon Petrotechnologies Ltd
- 13.2.5.1. Overview
- 13.2.5.2. Products
- 13.2.5.3. SWOT Analysis
- 13.2.5.4. Recent Developments
- 13.2.5.5. Financials (Based on Availability)
- 13.2.6 SGS SA
- 13.2.6.1. Overview
- 13.2.6.2. Products
- 13.2.6.3. SWOT Analysis
- 13.2.6.4. Recent Developments
- 13.2.6.5. Financials (Based on Availability)
- 13.2.7 Nextier Oilfield Solutions Inc
- 13.2.7.1. Overview
- 13.2.7.2. Products
- 13.2.7.3. SWOT Analysis
- 13.2.7.4. Recent Developments
- 13.2.7.5. Financials (Based on Availability)
- 13.2.8 Baker Hughes Company
- 13.2.8.1. Overview
- 13.2.8.2. Products
- 13.2.8.3. SWOT Analysis
- 13.2.8.4. Recent Developments
- 13.2.8.5. Financials (Based on Availability)
- 13.2.9 Halliburton Company
- 13.2.9.1. Overview
- 13.2.9.2. Products
- 13.2.9.3. SWOT Analysis
- 13.2.9.4. Recent Developments
- 13.2.9.5. Financials (Based on Availability)
- 13.2.10 Schlumberger Limited
- 13.2.10.1. Overview
- 13.2.10.2. Products
- 13.2.10.3. SWOT Analysis
- 13.2.10.4. Recent Developments
- 13.2.10.5. Financials (Based on Availability)
- 13.2.1 Expro Group
List of Figures
- Figure 1: North America Wireline Services Industry Revenue Breakdown (Million, %) by Product 2024 & 2032
- Figure 2: North America Wireline Services Industry Share (%) by Company 2024
List of Tables
- Table 1: North America Wireline Services Industry Revenue Million Forecast, by Region 2019 & 2032
- Table 2: North America Wireline Services Industry Revenue Million Forecast, by Type 2019 & 2032
- Table 3: North America Wireline Services Industry Revenue Million Forecast, by Hole Type 2019 & 2032
- Table 4: North America Wireline Services Industry Revenue Million Forecast, by Deployment 2019 & 2032
- Table 5: North America Wireline Services Industry Revenue Million Forecast, by Geography 2019 & 2032
- Table 6: North America Wireline Services Industry Revenue Million Forecast, by Region 2019 & 2032
- Table 7: North America Wireline Services Industry Revenue Million Forecast, by Country 2019 & 2032
- Table 8: United States North America Wireline Services Industry Revenue (Million) Forecast, by Application 2019 & 2032
- Table 9: Canada North America Wireline Services Industry Revenue (Million) Forecast, by Application 2019 & 2032
- Table 10: Mexico North America Wireline Services Industry Revenue (Million) Forecast, by Application 2019 & 2032
- Table 11: Rest of North America North America Wireline Services Industry Revenue (Million) Forecast, by Application 2019 & 2032
- Table 12: North America Wireline Services Industry Revenue Million Forecast, by Type 2019 & 2032
- Table 13: North America Wireline Services Industry Revenue Million Forecast, by Hole Type 2019 & 2032
- Table 14: North America Wireline Services Industry Revenue Million Forecast, by Deployment 2019 & 2032
- Table 15: North America Wireline Services Industry Revenue Million Forecast, by Geography 2019 & 2032
- Table 16: North America Wireline Services Industry Revenue Million Forecast, by Country 2019 & 2032
- Table 17: North America Wireline Services Industry Revenue Million Forecast, by Type 2019 & 2032
- Table 18: North America Wireline Services Industry Revenue Million Forecast, by Hole Type 2019 & 2032
- Table 19: North America Wireline Services Industry Revenue Million Forecast, by Deployment 2019 & 2032
- Table 20: North America Wireline Services Industry Revenue Million Forecast, by Geography 2019 & 2032
- Table 21: North America Wireline Services Industry Revenue Million Forecast, by Country 2019 & 2032
- Table 22: North America Wireline Services Industry Revenue Million Forecast, by Type 2019 & 2032
- Table 23: North America Wireline Services Industry Revenue Million Forecast, by Hole Type 2019 & 2032
- Table 24: North America Wireline Services Industry Revenue Million Forecast, by Deployment 2019 & 2032
- Table 25: North America Wireline Services Industry Revenue Million Forecast, by Geography 2019 & 2032
- Table 26: North America Wireline Services Industry Revenue Million Forecast, by Country 2019 & 2032
Frequently Asked Questions
1. What is the projected Compound Annual Growth Rate (CAGR) of the North America Wireline Services Industry?
The projected CAGR is approximately > 3.00%.
2. Which companies are prominent players in the North America Wireline Services Industry?
Key companies in the market include Expro Group, Superior Energy Services Inc, Weatherford International Plc, Pioneer Energy Services Corp, Recon Petrotechnologies Ltd, SGS SA, Nextier Oilfield Solutions Inc, Baker Hughes Company, Halliburton Company, Schlumberger Limited.
3. What are the main segments of the North America Wireline Services Industry?
The market segments include Type, Hole Type, Deployment, Geography.
4. Can you provide details about the market size?
The market size is estimated to be USD XX Million as of 2022.
5. What are some drivers contributing to market growth?
4.; Increasing Automotive Sales in Saudi Arabia4.; Rising Demand from Heavy Automotives.
6. What are the notable trends driving market growth?
Onshore Segment to Dominate the Market.
7. Are there any restraints impacting market growth?
4.; Rising Emphasis on Electric Vehicles.
8. Can you provide examples of recent developments in the market?
Q3 2022: Schlumberger was awarded multiple scopes for an enhanced oil recovery pilot project by Denbury Onshore, LLC. The award covers downhole logging, coring and core laboratory analysis, downhole completions equipment, electric submersible REDA pumps configured to handle a high concentration of CO2 in the produced fluids, and permanent distributed temperature and acoustic sensing using Optiq Schlumberger fiber-optic solutions.
9. What pricing options are available for accessing the report?
Pricing options include single-user, multi-user, and enterprise licenses priced at USD 4750, USD 5250, and USD 8750 respectively.
10. Is the market size provided in terms of value or volume?
The market size is provided in terms of value, measured in Million.
11. Are there any specific market keywords associated with the report?
Yes, the market keyword associated with the report is "North America Wireline Services Industry," which aids in identifying and referencing the specific market segment covered.
12. How do I determine which pricing option suits my needs best?
The pricing options vary based on user requirements and access needs. Individual users may opt for single-user licenses, while businesses requiring broader access may choose multi-user or enterprise licenses for cost-effective access to the report.
13. Are there any additional resources or data provided in the North America Wireline Services Industry report?
While the report offers comprehensive insights, it's advisable to review the specific contents or supplementary materials provided to ascertain if additional resources or data are available.
14. How can I stay updated on further developments or reports in the North America Wireline Services Industry?
To stay informed about further developments, trends, and reports in the North America Wireline Services Industry, consider subscribing to industry newsletters, following relevant companies and organizations, or regularly checking reputable industry news sources and publications.
Methodology
Step 1 - Identification of Relevant Samples Size from Population Database


Step 2 - Approaches for Defining Global Market Size (Value, Volume* & Price*)

Note*: In applicable scenarios
Step 3 - Data Sources
Primary Research
- Web Analytics
- Survey Reports
- Research Institute
- Latest Research Reports
- Opinion Leaders
Secondary Research
- Annual Reports
- White Paper
- Latest Press Release
- Industry Association
- Paid Database
- Investor Presentations

Step 4 - Data Triangulation
Involves using different sources of information in order to increase the validity of a study
These sources are likely to be stakeholders in a program - participants, other researchers, program staff, other community members, and so on.
Then we put all data in single framework & apply various statistical tools to find out the dynamic on the market.
During the analysis stage, feedback from the stakeholder groups would be compared to determine areas of agreement as well as areas of divergence
