

Key Insights
The lithium-air battery market is experiencing significant growth, driven by the increasing demand for high-energy density batteries in electric vehicles (EVs), portable electronics, and grid-scale energy storage systems. The market's Compound Annual Growth Rate (CAGR) exceeding 5.50% signifies substantial expansion projected through 2033. Key drivers include the rising concerns about climate change and the push for sustainable energy solutions, leading to increased investments in renewable energy technologies and electric vehicles. Technological advancements focusing on improving battery lifespan, safety, and charging times are further fueling market growth. Market segmentation reveals strong demand across various product types, including button cells, cylindrical cells, pouch cells, and prismatic cells, each catering to specific applications. The automotive sector is a major end-user, with the rapid adoption of electric and hybrid vehicles significantly impacting market demand. Consumer electronics represent another substantial segment, with the constant demand for longer-lasting and more powerful batteries in smartphones, laptops, and other portable devices. The energy storage sector is emerging as a key growth area, with lithium-air batteries potentially revolutionizing grid-scale energy storage solutions due to their high energy density. While challenges remain in terms of cycle life and cost-effectiveness compared to established battery chemistries, continuous research and development efforts are addressing these limitations, paving the way for wider adoption. Geographic analysis indicates strong growth across North America, Europe, and the Asia-Pacific region, reflecting the high concentration of EV manufacturing and consumer electronics industries in these areas.
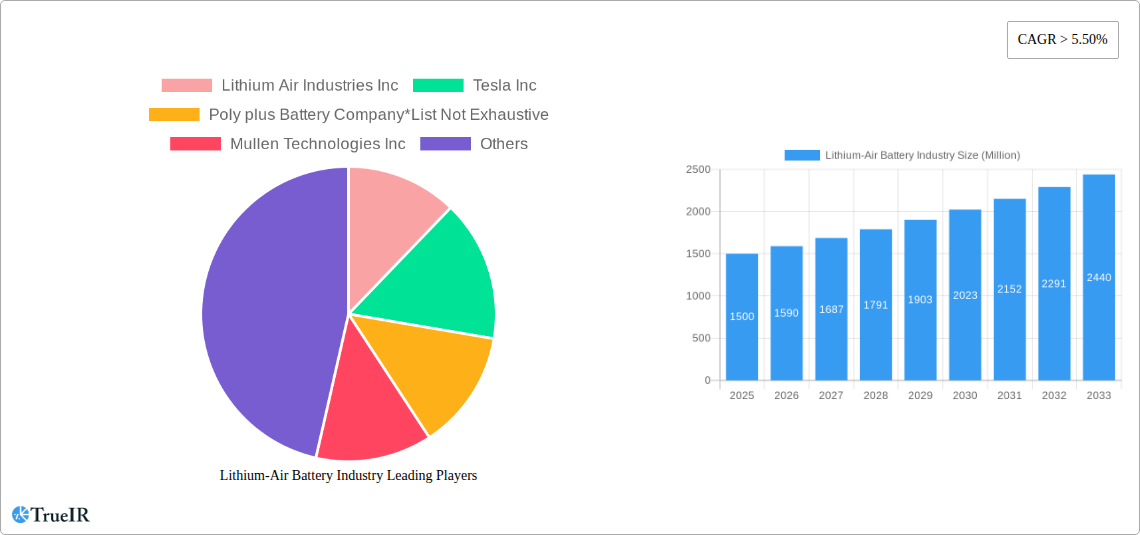
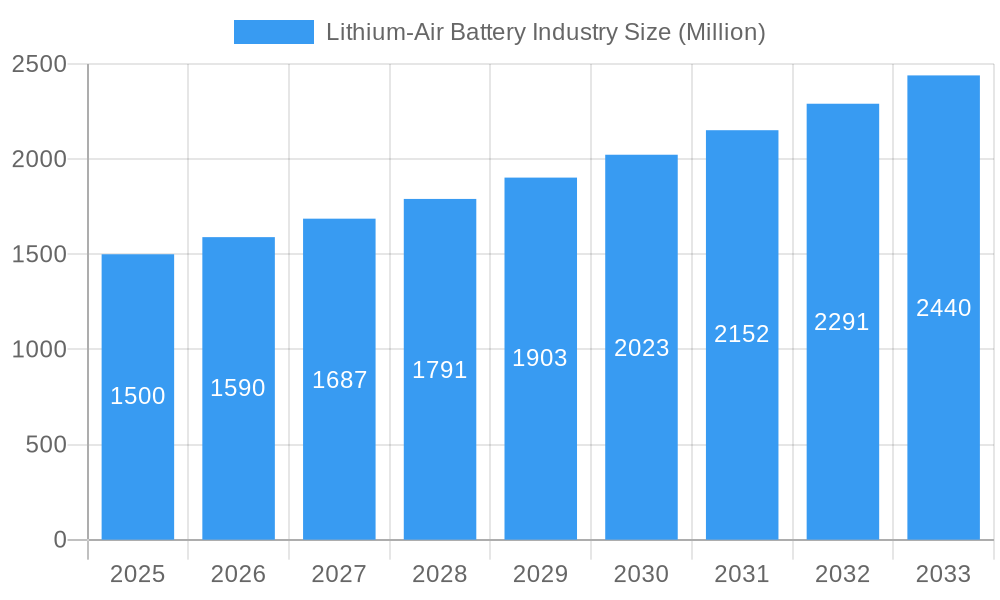
Lithium-Air Battery Industry Market Size (In Billion)
Despite the promising outlook, certain restraints such as the relatively immature technology compared to lithium-ion batteries and challenges related to battery stability and safety must be considered. Ongoing research focuses on improving the oxygen electrode's efficiency and stability to overcome these challenges. Furthermore, the high initial investment costs associated with lithium-air battery production may limit early-stage adoption. However, economies of scale and technological advancements are anticipated to mitigate these costs over time. The competitive landscape is marked by a mix of established players and emerging companies actively involved in R&D and commercialization efforts. The market's future trajectory depends heavily on the successful resolution of technological hurdles, regulatory support for renewable energy initiatives, and sustained investment in research and development. The market's evolution is poised to be heavily influenced by breakthroughs in materials science and manufacturing processes, ultimately shaping the long-term growth trajectory of this promising technology.
Lithium-Air Battery Industry Company Market Share
Lithium-Air Battery Industry Report: 2019-2033 Forecast
This comprehensive report provides a detailed analysis of the Lithium-Air Battery industry, encompassing market structure, competitive dynamics, technological advancements, and future growth prospects. With a study period spanning 2019-2033, a base year of 2025, and a forecast period of 2025-2033, this report offers invaluable insights for investors, industry professionals, and researchers. The market is expected to reach xx Million by 2033, exhibiting a CAGR of xx% during the forecast period.
Lithium-Air Battery Industry Market Structure & Competitive Landscape
The Lithium-Air Battery industry is characterized by a moderately concentrated market structure. While a few major players like Tesla Inc, Lithium Air Industries Inc, Mullen Technologies Inc, and Poly Plus Battery Company dominate, a significant number of smaller companies contribute to the overall market volume. The industry's competitive landscape is intensely dynamic, driven by rapid technological advancements and the constant pursuit of improved energy density, lifespan, and safety. Mergers and acquisitions (M&A) activity has been relatively low in recent years, with an estimated xx Million in M&A volume during 2019-2024, indicating a trend toward organic growth. Regulatory pressures, particularly concerning environmental impact and safety standards, are shaping the competitive landscape, favoring companies with robust compliance strategies. The industry also faces pressure from substitute technologies, such as solid-state batteries, which are constantly being improved. The end-user segmentation is broad, encompassing Automotive, Consumer Electronics, Energy Storage, and other applications, creating opportunities for specialization and niche market penetration.
Lithium-Air Battery Industry Market Trends & Opportunities
The global Lithium-Air Battery market is experiencing significant growth, driven by increasing demand for higher energy density batteries across various sectors. Technological advancements, such as improvements in cathode materials and electrolyte designs, are continuously improving battery performance. The market is witnessing a shift toward more sustainable and eco-friendly manufacturing processes, aligned with global environmental regulations. Consumer preferences are leaning towards longer-lasting, safer, and more cost-effective batteries, stimulating innovation and competition in the industry. The market penetration rate for Lithium-Air Batteries is currently low, but with ongoing technological advancements and cost reductions, a substantial increase in market penetration is expected during the forecast period. The CAGR for the forecast period (2025-2033) is projected at xx%, reflecting robust growth and market expansion. Competitive dynamics are characterized by intense R&D investments, strategic partnerships, and efforts to secure raw material supply chains. The market presents significant opportunities for companies capable of leveraging technological breakthroughs and addressing consumer demand for improved performance and sustainability.
Dominant Markets & Segments in Lithium-Air Battery Industry
Currently, the automotive sector represents the dominant end-user segment, driving substantial demand for high-performance Lithium-Air batteries. The Asia-Pacific region, particularly China, is expected to be the leading geographic market, fueled by strong government support for electric vehicle adoption and substantial investments in renewable energy infrastructure. Within product types, prismatic cells are projected to capture the largest market share due to their high energy density and suitability for various applications.
- Key Growth Drivers in the Automotive Segment:
- Increasing adoption of electric vehicles (EVs) globally.
- Stringent emission regulations driving the shift towards EVs.
- Government incentives and subsidies for EV purchases.
- Key Growth Drivers in the Asia-Pacific Region:
- Expanding EV infrastructure and charging networks.
- Government policies promoting renewable energy adoption.
- Growing investment in battery manufacturing facilities.
The consumer electronics market is also experiencing significant growth, with demand for Lithium-Air batteries in portable devices and wearable technology. The energy storage segment is poised for significant expansion, driven by the increasing need for efficient energy storage solutions for renewable energy systems and grid applications. Other applications, including medical devices and aerospace, present niche opportunities for specialized Lithium-Air battery solutions.
Lithium-Air Battery Industry Product Analysis
Technological advancements in Lithium-Air battery technology are focusing on improving energy density, cycle life, and safety. New cathode materials and electrolyte formulations are being developed to enhance performance and address challenges related to battery degradation. The market fit for Lithium-Air batteries is expanding rapidly, driven by the increasing demand for high-energy density batteries in electric vehicles, grid-scale energy storage, and portable electronic devices. Competitive advantages are largely determined by technological innovation, cost-effectiveness, and the ability to meet stringent safety and environmental regulations.
Key Drivers, Barriers & Challenges in Lithium-Air Battery Industry
Key Drivers: Technological advancements in materials science, increasing demand for electric vehicles, government incentives for renewable energy, and the growing need for grid-scale energy storage are all driving significant growth within the Lithium-Air Battery industry.
Key Challenges: Supply chain disruptions, particularly concerning the availability of raw materials like lithium, pose a significant challenge. High production costs compared to other battery technologies hinder market penetration. Stringent safety regulations and concerns about the environmental impact of battery production and disposal also present obstacles. The development of improved and safer electrolytes is crucial for widespread commercial adoption.
Growth Drivers in the Lithium-Air Battery Industry Market
The key growth drivers are technological innovations focusing on energy density, lifespan and safety. Government regulations and subsidies pushing for electric vehicles are instrumental in fostering growth, as is the increasing demand for energy storage solutions in the renewable energy sector. Furthermore, continuous improvements in the production process leading to lower costs are crucial for wider market adoption.
Challenges Impacting Lithium-Air Battery Industry Growth
Challenges include the limited availability of raw materials which leads to high production costs and increased price volatility, supply chain bottlenecks, and technological hurdles that hinder scalability. Strict environmental regulations related to disposal and recycling add complexity, and existing competition from established battery technologies requires significant differentiation to secure market share.
Key Players Shaping the Lithium-Air Battery Industry Market
- Tesla Inc
- Lithium Air Industries Inc
- Poly Plus Battery Company
- Mullen Technologies Inc
Significant Lithium-Air Battery Industry Milestones
- December 2021: E-waste recycling firm Attero announced plans to invest INR 300 crore to increase lithium-ion battery recycling capacity to 11,000 tons annually. This highlights growing awareness of sustainable battery lifecycle management.
- January 2022: Researchers from MIT, Harvard, and Cornell Universities announced progress in understanding the breakdown of Li-air batteries, paving the way for improved battery designs and increased lifespan.
Future Outlook for Lithium-Air Battery Industry Market
The Lithium-Air Battery industry is poised for substantial growth, driven by ongoing technological advancements, increasing demand from various sectors, and supportive government policies. Strategic partnerships, collaborations on R&D, and aggressive investments in production capacity will determine the success of individual companies. The market potential is vast, particularly in electric vehicles and grid-scale energy storage, promising significant growth opportunities for players who can overcome the challenges associated with raw material sourcing, production costs, and safety concerns.
Lithium-Air Battery Industry Segmentation
-
1. End User
- 1.1. Automotive
- 1.2. Consumer Electronics
- 1.3. Energy Storage
- 1.4. Other Applications
Lithium-Air Battery Industry Segmentation By Geography
- 1. North America
- 2. Asia Pacific
- 3. Europe
- 4. South America
- 5. Middle East
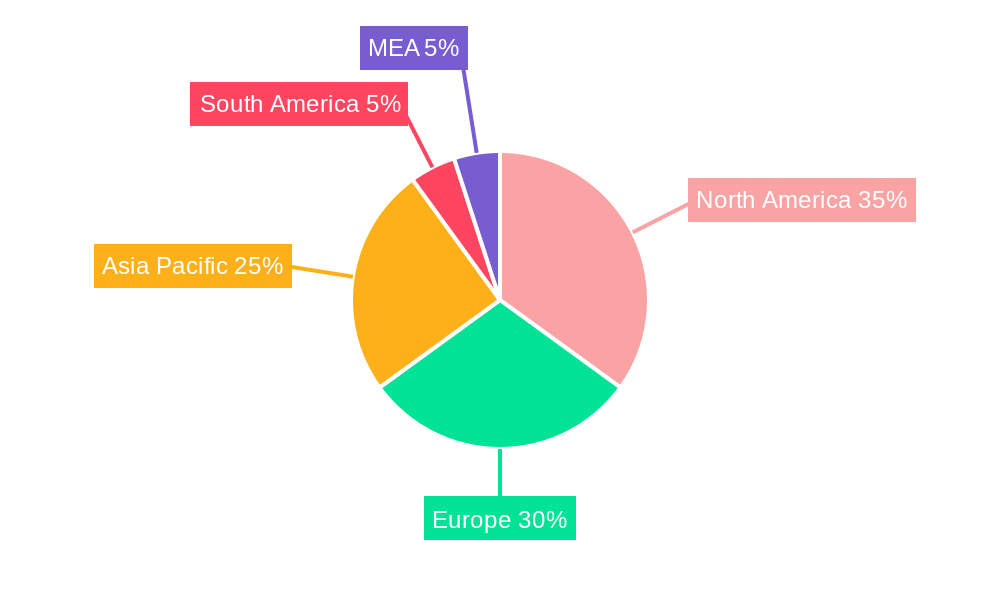
Lithium-Air Battery Industry Regional Market Share
Geographic Coverage of Lithium-Air Battery Industry
Lithium-Air Battery Industry REPORT HIGHLIGHTS
| Aspects | Details |
|---|---|
| Study Period | 2020-2034 |
| Base Year | 2025 |
| Estimated Year | 2026 |
| Forecast Period | 2026-2034 |
| Historical Period | 2020-2025 |
| Growth Rate | CAGR of 9.3% from 2020-2034 |
| Segmentation |
|
Table of Contents
- 1. Introduction
- 1.1. Research Scope
- 1.2. Market Segmentation
- 1.3. Research Objective
- 1.4. Definitions and Assumptions
- 2. Executive Summary
- 2.1. Market Snapshot
- 3. Market Dynamics
- 3.1. Market Drivers
- 3.2. Market Restrains
- 3.3. Market Trends
- 3.4. Market Opportunities
- 4. Market Factor Analysis
- 4.1. Porters Five Forces
- 4.1.1. Bargaining Power of Suppliers
- 4.1.2. Bargaining Power of Buyers
- 4.1.3. Threat of New Entrants
- 4.1.4. Threat of Substitutes
- 4.1.5. Competitive Rivalry
- 4.2. PESTEL analysis
- 4.3. BCG Analysis
- 4.3.1. Stars (High Growth, High Market Share)
- 4.3.2. Cash Cows (Low Growth, High Market Share)
- 4.3.3. Question Mark (High Growth, Low Market Share)
- 4.3.4. Dogs (Low Growth, Low Market Share)
- 4.4. Ansoff Matrix Analysis
- 4.5. Supply Chain Analysis
- 4.6. Regulatory Landscape
- 4.7. Current Market Potential and Opportunity Assessment (TAM–SAM–SOM Framework)
- 4.8. TIR Analyst Note
- 4.1. Porters Five Forces
- 5. Market Analysis, Insights and Forecast 2021-2033
- 5.1. Market Analysis, Insights and Forecast - by End User
- 5.1.1. Automotive
- 5.1.2. Consumer Electronics
- 5.1.3. Energy Storage
- 5.1.4. Other Applications
- 5.2. Market Analysis, Insights and Forecast - by Region
- 5.2.1. North America
- 5.2.2. Asia Pacific
- 5.2.3. Europe
- 5.2.4. South America
- 5.2.5. Middle East
- 5.1. Market Analysis, Insights and Forecast - by End User
- 6. Global Lithium-Air Battery Industry Analysis, Insights and Forecast, 2021-2033
- 6.1. Market Analysis, Insights and Forecast - by End User
- 6.1.1. Automotive
- 6.1.2. Consumer Electronics
- 6.1.3. Energy Storage
- 6.1.4. Other Applications
- 6.1. Market Analysis, Insights and Forecast - by End User
- 7. North America Lithium-Air Battery Industry Analysis, Insights and Forecast, 2020-2032
- 7.1. Market Analysis, Insights and Forecast - by End User
- 7.1.1. Automotive
- 7.1.2. Consumer Electronics
- 7.1.3. Energy Storage
- 7.1.4. Other Applications
- 7.1. Market Analysis, Insights and Forecast - by End User
- 8. Asia Pacific Lithium-Air Battery Industry Analysis, Insights and Forecast, 2020-2032
- 8.1. Market Analysis, Insights and Forecast - by End User
- 8.1.1. Automotive
- 8.1.2. Consumer Electronics
- 8.1.3. Energy Storage
- 8.1.4. Other Applications
- 8.1. Market Analysis, Insights and Forecast - by End User
- 9. Europe Lithium-Air Battery Industry Analysis, Insights and Forecast, 2020-2032
- 9.1. Market Analysis, Insights and Forecast - by End User
- 9.1.1. Automotive
- 9.1.2. Consumer Electronics
- 9.1.3. Energy Storage
- 9.1.4. Other Applications
- 9.1. Market Analysis, Insights and Forecast - by End User
- 10. South America Lithium-Air Battery Industry Analysis, Insights and Forecast, 2020-2032
- 10.1. Market Analysis, Insights and Forecast - by End User
- 10.1.1. Automotive
- 10.1.2. Consumer Electronics
- 10.1.3. Energy Storage
- 10.1.4. Other Applications
- 10.1. Market Analysis, Insights and Forecast - by End User
- 11. Middle East Lithium-Air Battery Industry Analysis, Insights and Forecast, 2020-2032
- 11.1. Market Analysis, Insights and Forecast - by End User
- 11.1.1. Automotive
- 11.1.2. Consumer Electronics
- 11.1.3. Energy Storage
- 11.1.4. Other Applications
- 11.1. Market Analysis, Insights and Forecast - by End User
- 12. Competitive Analysis
- 12.1. Company Profiles
- 12.1.1 Lithium Air Industries Inc
- 12.1.1.1. Company Overview
- 12.1.1.2. Products
- 12.1.1.3. Company Financials
- 12.1.1.4. SWOT Analysis
- 12.1.2 Tesla Inc
- 12.1.2.1. Company Overview
- 12.1.2.2. Products
- 12.1.2.3. Company Financials
- 12.1.2.4. SWOT Analysis
- 12.1.3 Poly plus Battery Company*List Not Exhaustive
- 12.1.3.1. Company Overview
- 12.1.3.2. Products
- 12.1.3.3. Company Financials
- 12.1.3.4. SWOT Analysis
- 12.1.4 Mullen Technologies Inc
- 12.1.4.1. Company Overview
- 12.1.4.2. Products
- 12.1.4.3. Company Financials
- 12.1.4.4. SWOT Analysis
- 12.1.1 Lithium Air Industries Inc
- 12.2. Market Entropy
- 12.2.1 Company's Key Areas Served
- 12.2.2 Recent Developments
- 12.3. Company Market Share Analysis 2025
- 12.3.1 Top 5 Companies Market Share Analysis
- 12.3.2 Top 3 Companies Market Share Analysis
- 12.4. List of Potential Customers
- 13. Research Methodology
List of Figures
- Figure 1: Global Lithium-Air Battery Industry Revenue Breakdown (million, %) by Region 2025 & 2033
- Figure 2: Global Lithium-Air Battery Industry Volume Breakdown (K Units, %) by Region 2025 & 2033
- Figure 3: North America Lithium-Air Battery Industry Revenue (million), by End User 2025 & 2033
- Figure 4: North America Lithium-Air Battery Industry Volume (K Units), by End User 2025 & 2033
- Figure 5: North America Lithium-Air Battery Industry Revenue Share (%), by End User 2025 & 2033
- Figure 6: North America Lithium-Air Battery Industry Volume Share (%), by End User 2025 & 2033
- Figure 7: North America Lithium-Air Battery Industry Revenue (million), by Country 2025 & 2033
- Figure 8: North America Lithium-Air Battery Industry Volume (K Units), by Country 2025 & 2033
- Figure 9: North America Lithium-Air Battery Industry Revenue Share (%), by Country 2025 & 2033
- Figure 10: North America Lithium-Air Battery Industry Volume Share (%), by Country 2025 & 2033
- Figure 11: Asia Pacific Lithium-Air Battery Industry Revenue (million), by End User 2025 & 2033
- Figure 12: Asia Pacific Lithium-Air Battery Industry Volume (K Units), by End User 2025 & 2033
- Figure 13: Asia Pacific Lithium-Air Battery Industry Revenue Share (%), by End User 2025 & 2033
- Figure 14: Asia Pacific Lithium-Air Battery Industry Volume Share (%), by End User 2025 & 2033
- Figure 15: Asia Pacific Lithium-Air Battery Industry Revenue (million), by Country 2025 & 2033
- Figure 16: Asia Pacific Lithium-Air Battery Industry Volume (K Units), by Country 2025 & 2033
- Figure 17: Asia Pacific Lithium-Air Battery Industry Revenue Share (%), by Country 2025 & 2033
- Figure 18: Asia Pacific Lithium-Air Battery Industry Volume Share (%), by Country 2025 & 2033
- Figure 19: Europe Lithium-Air Battery Industry Revenue (million), by End User 2025 & 2033
- Figure 20: Europe Lithium-Air Battery Industry Volume (K Units), by End User 2025 & 2033
- Figure 21: Europe Lithium-Air Battery Industry Revenue Share (%), by End User 2025 & 2033
- Figure 22: Europe Lithium-Air Battery Industry Volume Share (%), by End User 2025 & 2033
- Figure 23: Europe Lithium-Air Battery Industry Revenue (million), by Country 2025 & 2033
- Figure 24: Europe Lithium-Air Battery Industry Volume (K Units), by Country 2025 & 2033
- Figure 25: Europe Lithium-Air Battery Industry Revenue Share (%), by Country 2025 & 2033
- Figure 26: Europe Lithium-Air Battery Industry Volume Share (%), by Country 2025 & 2033
- Figure 27: South America Lithium-Air Battery Industry Revenue (million), by End User 2025 & 2033
- Figure 28: South America Lithium-Air Battery Industry Volume (K Units), by End User 2025 & 2033
- Figure 29: South America Lithium-Air Battery Industry Revenue Share (%), by End User 2025 & 2033
- Figure 30: South America Lithium-Air Battery Industry Volume Share (%), by End User 2025 & 2033
- Figure 31: South America Lithium-Air Battery Industry Revenue (million), by Country 2025 & 2033
- Figure 32: South America Lithium-Air Battery Industry Volume (K Units), by Country 2025 & 2033
- Figure 33: South America Lithium-Air Battery Industry Revenue Share (%), by Country 2025 & 2033
- Figure 34: South America Lithium-Air Battery Industry Volume Share (%), by Country 2025 & 2033
- Figure 35: Middle East Lithium-Air Battery Industry Revenue (million), by End User 2025 & 2033
- Figure 36: Middle East Lithium-Air Battery Industry Volume (K Units), by End User 2025 & 2033
- Figure 37: Middle East Lithium-Air Battery Industry Revenue Share (%), by End User 2025 & 2033
- Figure 38: Middle East Lithium-Air Battery Industry Volume Share (%), by End User 2025 & 2033
- Figure 39: Middle East Lithium-Air Battery Industry Revenue (million), by Country 2025 & 2033
- Figure 40: Middle East Lithium-Air Battery Industry Volume (K Units), by Country 2025 & 2033
- Figure 41: Middle East Lithium-Air Battery Industry Revenue Share (%), by Country 2025 & 2033
- Figure 42: Middle East Lithium-Air Battery Industry Volume Share (%), by Country 2025 & 2033
List of Tables
- Table 1: Global Lithium-Air Battery Industry Revenue million Forecast, by End User 2020 & 2033
- Table 2: Global Lithium-Air Battery Industry Volume K Units Forecast, by End User 2020 & 2033
- Table 3: Global Lithium-Air Battery Industry Revenue million Forecast, by Region 2020 & 2033
- Table 4: Global Lithium-Air Battery Industry Volume K Units Forecast, by Region 2020 & 2033
- Table 5: Global Lithium-Air Battery Industry Revenue million Forecast, by End User 2020 & 2033
- Table 6: Global Lithium-Air Battery Industry Volume K Units Forecast, by End User 2020 & 2033
- Table 7: Global Lithium-Air Battery Industry Revenue million Forecast, by Country 2020 & 2033
- Table 8: Global Lithium-Air Battery Industry Volume K Units Forecast, by Country 2020 & 2033
- Table 9: Global Lithium-Air Battery Industry Revenue million Forecast, by End User 2020 & 2033
- Table 10: Global Lithium-Air Battery Industry Volume K Units Forecast, by End User 2020 & 2033
- Table 11: Global Lithium-Air Battery Industry Revenue million Forecast, by Country 2020 & 2033
- Table 12: Global Lithium-Air Battery Industry Volume K Units Forecast, by Country 2020 & 2033
- Table 13: Global Lithium-Air Battery Industry Revenue million Forecast, by End User 2020 & 2033
- Table 14: Global Lithium-Air Battery Industry Volume K Units Forecast, by End User 2020 & 2033
- Table 15: Global Lithium-Air Battery Industry Revenue million Forecast, by Country 2020 & 2033
- Table 16: Global Lithium-Air Battery Industry Volume K Units Forecast, by Country 2020 & 2033
- Table 17: Global Lithium-Air Battery Industry Revenue million Forecast, by End User 2020 & 2033
- Table 18: Global Lithium-Air Battery Industry Volume K Units Forecast, by End User 2020 & 2033
- Table 19: Global Lithium-Air Battery Industry Revenue million Forecast, by Country 2020 & 2033
- Table 20: Global Lithium-Air Battery Industry Volume K Units Forecast, by Country 2020 & 2033
- Table 21: Global Lithium-Air Battery Industry Revenue million Forecast, by End User 2020 & 2033
- Table 22: Global Lithium-Air Battery Industry Volume K Units Forecast, by End User 2020 & 2033
- Table 23: Global Lithium-Air Battery Industry Revenue million Forecast, by Country 2020 & 2033
- Table 24: Global Lithium-Air Battery Industry Volume K Units Forecast, by Country 2020 & 2033
Frequently Asked Questions
1. What is the projected Compound Annual Growth Rate (CAGR) of the Lithium-Air Battery Industry?
The projected CAGR is approximately 9.3%.
2. Which companies are prominent players in the Lithium-Air Battery Industry?
Key companies in the market include Lithium Air Industries Inc, Tesla Inc, Poly plus Battery Company*List Not Exhaustive, Mullen Technologies Inc.
3. What are the main segments of the Lithium-Air Battery Industry?
The market segments include End User.
4. Can you provide details about the market size?
The market size is estimated to be USD 9.6 million as of 2022.
5. What are some drivers contributing to market growth?
4.; The High Amount of Waste Generation in the Country4.; The growing Focus on Non-Fossil Fuel Sources.
6. What are the notable trends driving market growth?
Automotive Segment Holds the Significant Share in the Market.
7. Are there any restraints impacting market growth?
4.; The Recycling Rate of Waste in Germany.
8. Can you provide examples of recent developments in the market?
In January 2022, researchers from MIT, Harvard University, and Cornell University announced that they found a way to isolate and study one enigmatic molecule that may be responsible for the breakdown of key components in Li-air batteries, i.e., lithium superoxide.
9. What pricing options are available for accessing the report?
Pricing options include single-user, multi-user, and enterprise licenses priced at USD 4750, USD 5250, and USD 8750 respectively.
10. Is the market size provided in terms of value or volume?
The market size is provided in terms of value, measured in million and volume, measured in K Units.
11. Are there any specific market keywords associated with the report?
Yes, the market keyword associated with the report is "Lithium-Air Battery Industry," which aids in identifying and referencing the specific market segment covered.
12. How do I determine which pricing option suits my needs best?
The pricing options vary based on user requirements and access needs. Individual users may opt for single-user licenses, while businesses requiring broader access may choose multi-user or enterprise licenses for cost-effective access to the report.
13. Are there any additional resources or data provided in the Lithium-Air Battery Industry report?
While the report offers comprehensive insights, it's advisable to review the specific contents or supplementary materials provided to ascertain if additional resources or data are available.
14. How can I stay updated on further developments or reports in the Lithium-Air Battery Industry?
To stay informed about further developments, trends, and reports in the Lithium-Air Battery Industry, consider subscribing to industry newsletters, following relevant companies and organizations, or regularly checking reputable industry news sources and publications.
Methodology
Step 1 - Identification of Relevant Samples Size from Population Database


Step 2 - Approaches for Defining Global Market Size (Value, Volume* & Price*)

Note*: In applicable scenarios
Step 3 - Data Sources
Primary Research
- Web Analytics
- Survey Reports
- Research Institute
- Latest Research Reports
- Opinion Leaders
Secondary Research
- Annual Reports
- White Paper
- Latest Press Release
- Industry Association
- Paid Database
- Investor Presentations

Step 4 - Data Triangulation
Involves using different sources of information in order to increase the validity of a study
These sources are likely to be stakeholders in a program - participants, other researchers, program staff, other community members, and so on.
Then we put all data in single framework & apply various statistical tools to find out the dynamic on the market.
During the analysis stage, feedback from the stakeholder groups would be compared to determine areas of agreement as well as areas of divergence