

Key Insights
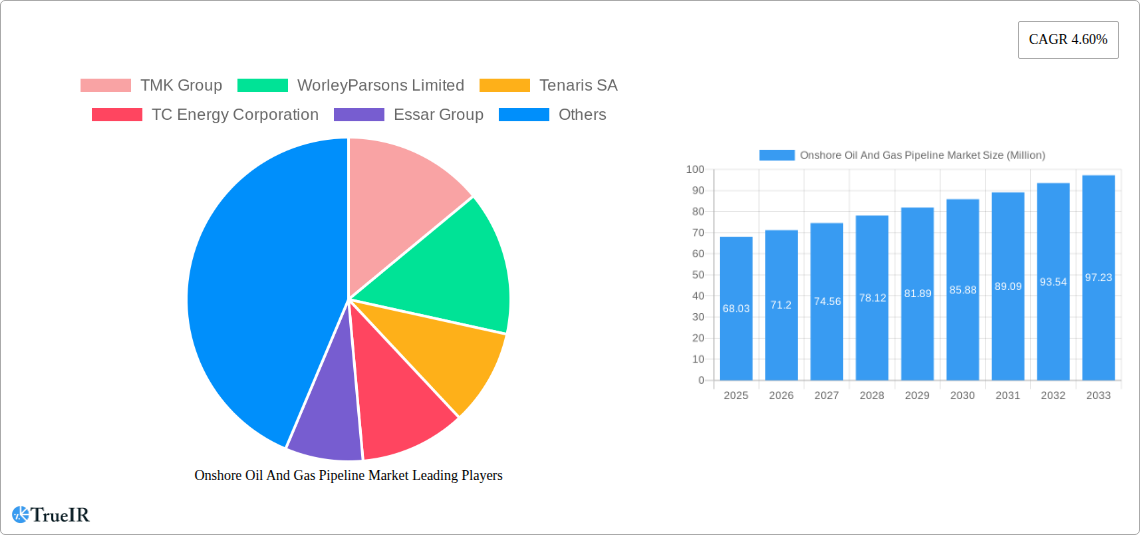
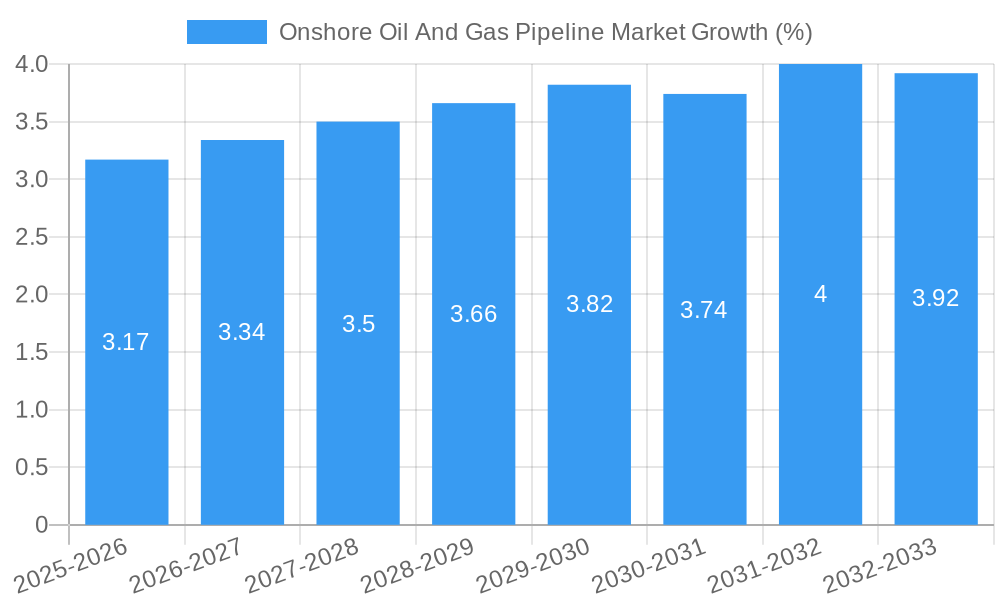
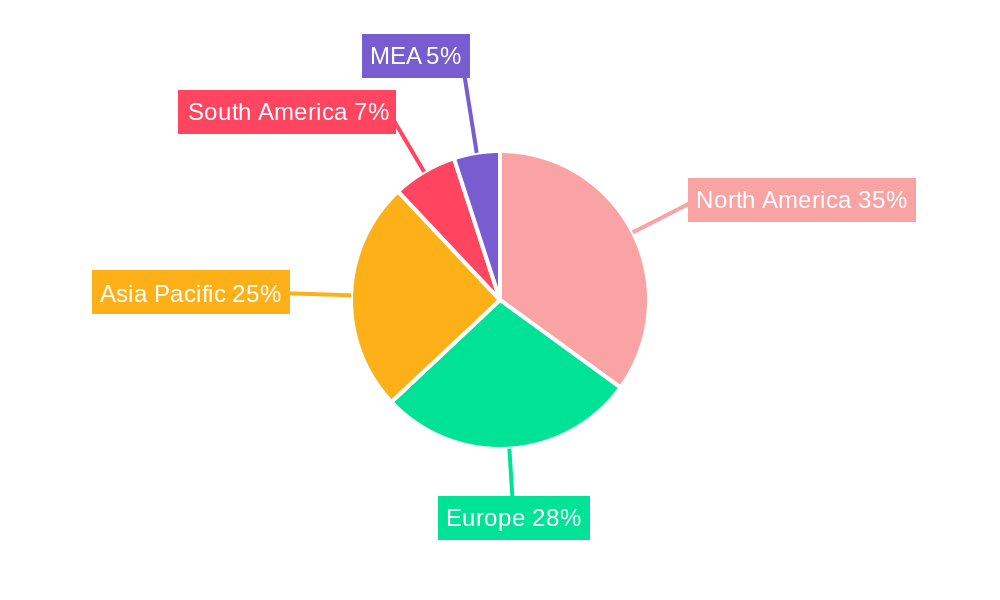
The onshore oil and gas pipeline market, valued at $68.03 million in 2025, is projected to experience robust growth, driven by increasing global energy demand and the need for efficient hydrocarbon transportation. A compound annual growth rate (CAGR) of 4.60% from 2025 to 2033 signifies a substantial market expansion. Key drivers include rising investments in oil and gas exploration and production activities, particularly in emerging economies with substantial reserves. Furthermore, government initiatives to modernize aging pipeline infrastructure and improve energy security are contributing to market growth. The market is segmented by pipeline type (oil and gas), with both experiencing steady growth. The competitive landscape is characterized by major players such as TMK Group, WorleyParsons Limited, and Tenaris SA, engaged in pipeline construction, maintenance, and technology development. Geographic expansion is significant, with North America, Europe, and the Asia-Pacific region representing major markets, each possessing unique regulatory frameworks and infrastructure development plans influencing market dynamics within their respective regions. Challenges include stringent environmental regulations, fluctuating oil and gas prices, and geopolitical uncertainties that can impact investment decisions and project timelines.
The market's future trajectory is influenced by several trends, including the increasing adoption of advanced pipeline technologies like smart pipelines for enhanced monitoring and leak detection. The growth of liquefied natural gas (LNG) infrastructure is also positively impacting the market, creating demand for onshore pipelines to connect LNG processing facilities with distribution networks. However, the market faces restraints such as the high initial capital expenditure required for pipeline construction and maintenance, as well as concerns over pipeline safety and potential environmental risks. To mitigate these challenges, companies are focusing on innovative technologies, strategic partnerships, and cost optimization strategies. The ongoing transition towards cleaner energy sources presents a long-term challenge, though the sustained demand for natural gas as a transition fuel continues to provide a favorable market outlook for at least the next decade. Regional variations in growth rates are expected, influenced by factors such as economic development, regulatory environment, and existing infrastructure.
Onshore Oil and Gas Pipeline Market Report: A Comprehensive Analysis (2019-2033)
This dynamic report provides an in-depth analysis of the global onshore oil and gas pipeline market, offering invaluable insights for stakeholders seeking to navigate this crucial energy sector. Leveraging extensive research and data analysis covering the period 2019-2033 (Base Year: 2025, Forecast Period: 2025-2033), this report illuminates market trends, competitive dynamics, and future growth potential. The study encompasses detailed segmentation by pipeline type (oil and gas) and geographical analysis, empowering businesses to make informed strategic decisions. The market size is projected to reach xx Million by 2033, exhibiting a CAGR of xx% during the forecast period.
Onshore Oil and Gas Pipeline Market Market Structure & Competitive Landscape
The onshore oil and gas pipeline market exhibits a moderately concentrated structure, with a few major players holding significant market share. The Herfindahl-Hirschman Index (HHI) is estimated at xx, indicating a moderately competitive landscape. Key drivers of innovation include advancements in materials science (e.g., high-strength steel, composite materials), improved pipeline inspection technologies, and the development of more efficient construction methods. Regulatory impacts, particularly concerning environmental protection and safety standards, significantly influence market dynamics. Product substitutes, such as rail and trucking for shorter distances, pose a competitive challenge, especially for smaller pipeline projects. The market is segmented by end-user, including energy companies, refineries, and industrial consumers. M&A activity within the sector has been relatively active in recent years, with xx Million in deals recorded between 2019 and 2024, driving consolidation and impacting market share distribution. This trend is expected to continue, further shaping the competitive landscape.
- Market Concentration: HHI estimated at xx
- Innovation Drivers: Advanced materials, inspection technologies, construction methods.
- Regulatory Impacts: Environmental regulations, safety standards.
- Product Substitutes: Rail transport, trucking.
- End-User Segmentation: Energy companies, refineries, industrial consumers.
- M&A Trends: xx Million in deals (2019-2024), driving consolidation.
Onshore Oil and Gas Pipeline Market Market Trends & Opportunities
The onshore oil and gas pipeline market is experiencing robust growth driven by increasing global energy demand, particularly in emerging economies. Technological advancements, such as the adoption of smart pipelines and digital twins, are enhancing operational efficiency and safety. Consumer preferences are shifting towards cleaner energy sources, yet the demand for oil and gas pipelines remains strong, particularly for transporting natural gas which plays a key role in the global energy transition. This creates opportunities for companies offering sustainable solutions and technologies. The competitive landscape is dynamic, with both established players and new entrants vying for market share. The market size is projected to grow from xx Million in 2025 to xx Million by 2033, fueled by various factors including increased energy infrastructure development across regions. Market penetration rates vary significantly across different geographic regions and pipeline types. The CAGR for the forecast period is estimated at xx%. Emerging technologies like automated pipeline welding and leak detection systems offer compelling opportunities for innovation and market expansion.
Dominant Markets & Segments in Onshore Oil and Gas Pipeline Market
The North American region currently dominates the onshore oil and gas pipeline market, driven by robust energy production and extensive existing infrastructure. However, significant growth is anticipated in Asia-Pacific and the Middle East, owing to substantial investments in energy infrastructure projects.
Key Growth Drivers:
- North America: Extensive existing infrastructure, robust energy production.
- Asia-Pacific: Rapid economic growth, rising energy demand.
- Middle East: Significant oil and gas reserves, large-scale infrastructure projects.
Market Dominance Analysis: The oil pipeline segment currently holds a larger market share compared to the gas pipeline segment due to the historically higher volume of crude oil transportation. However, with the increasing focus on natural gas as a transition fuel, the gas pipeline segment is expected to experience faster growth in the coming years. Government policies promoting energy security and infrastructure development are pivotal factors in regional market dominance.
Onshore Oil and Gas Pipeline Market Product Analysis
Technological advancements are significantly impacting the onshore oil and gas pipeline market. Innovations include the use of advanced materials for enhanced durability and corrosion resistance, improved pipeline coating technologies for leak prevention, and sophisticated monitoring systems for real-time pipeline integrity assessment. These innovations lead to safer, more efficient, and cost-effective pipeline operations, contributing to improved market fit and competitive advantage. The focus is shifting towards smart pipelines that utilize data analytics and predictive maintenance to optimize performance and minimize downtime.
Key Drivers, Barriers & Challenges in Onshore Oil and Gas Pipeline Market
Key Drivers:
- Increasing global energy demand
- Infrastructure development in emerging economies
- Technological advancements in pipeline construction and maintenance.
- Government policies promoting energy security.
Challenges and Restraints:
- Stringent environmental regulations leading to increased project costs and delays.
- Supply chain disruptions impacting material availability and project timelines.
- High capital expenditure requirements for large-scale pipeline projects.
- Intense competition among pipeline operators. The impact of these challenges is estimated to reduce the market growth rate by approximately xx% annually.
Growth Drivers in the Onshore Oil and Gas Pipeline Market Market
The onshore oil and gas pipeline market is driven by several factors. Rising global energy consumption and the increasing need for efficient energy transportation are key drivers. Government initiatives promoting infrastructure development in many regions provide further impetus. Moreover, ongoing technological advancements improve pipeline safety, efficiency, and longevity, driving market expansion.
Challenges Impacting Onshore Oil and Gas Pipeline Market Growth
Growth in the onshore oil and gas pipeline market is challenged by several factors. Stringent environmental regulations lead to prolonged permitting processes and increased project costs. Supply chain disruptions can impact project timelines and escalate expenses. The high capital expenditure required for pipeline projects and intense competition for market share present additional hurdles.
Key Players Shaping the Onshore Oil and Gas Pipeline Market Market
- TMK Group
- WorleyParsons Limited
- Tenaris SA
- TC Energy Corporation
- Essar Group
- Jindal SAW Ltd
- Mastec Inc
- Europipe GmbH
- Baoshan Iron & Steel Co Ltd
- CPW America Co
Significant Onshore Oil and Gas Pipeline Market Industry Milestones
- 2020, Q4: Introduction of a new corrosion-resistant pipeline coating technology by [Company Name].
- 2021, Q2: Merger between two major pipeline operators, resulting in a significant increase in market share.
- 2022, Q3: Launch of a new smart pipeline monitoring system by [Company Name], enhancing operational efficiency.
- 2023, Q1: Successful completion of a major cross-country pipeline project, expanding transportation capacity.
(Note: Specific company names and details need to be added based on actual industry events.)
Future Outlook for Onshore Oil and Gas Pipeline Market Market
The future of the onshore oil and gas pipeline market remains positive. Continued growth in global energy demand, coupled with ongoing investments in infrastructure development and technological advancements, will drive market expansion. Strategic partnerships, technological innovation, and regulatory compliance will be crucial for sustained growth and market leadership. Significant opportunities exist for companies that can deliver sustainable and cost-effective solutions, responding to the evolving needs of the energy sector.
Onshore Oil And Gas Pipeline Market Segmentation
-
1. Type
- 1.1. Oil Pipeline
- 1.2. Gas Pipeline
Onshore Oil And Gas Pipeline Market Segmentation By Geography
-
1. North America
- 1.1. United States
- 1.2. Canada
- 1.3. Rest of North America
-
2. Europe
- 2.1. Norway
- 2.2. United Kingdom
- 2.3. France
- 2.4. Spain
- 2.5. NORDIC
- 2.6. Russia
- 2.7. Rest of Europe
-
3. Asia Pacific
- 3.1. China
- 3.2. India
- 3.3. Indonesia
- 3.4. Malaysia
- 3.5. Vietnam
- 3.6. Thailand
- 3.7. Rest of Asia Pacific
-
4. South America
- 4.1. Brazil
- 4.2. Argentina
- 4.3. Colombia
- 4.4. Rest of South Africa
-
5. Middle East and Africa
- 5.1. United Arab Emirates
- 5.2. Saudi Arabia
- 5.3. South Africa
- 5.4. Egypt
- 5.5. Nigeria
- 5.6. Qatar
- 5.7. Rest of Middle East and Africa
Onshore Oil And Gas Pipeline Market REPORT HIGHLIGHTS
| Aspects | Details |
|---|---|
| Study Period | 2019-2033 |
| Base Year | 2024 |
| Estimated Year | 2025 |
| Forecast Period | 2025-2033 |
| Historical Period | 2019-2024 |
| Growth Rate | CAGR of 4.60% from 2019-2033 |
| Segmentation |
|
Table of Contents
- 1. Introduction
- 1.1. Research Scope
- 1.2. Market Segmentation
- 1.3. Research Methodology
- 1.4. Definitions and Assumptions
- 2. Executive Summary
- 2.1. Introduction
- 3. Market Dynamics
- 3.1. Introduction
- 3.2. Market Drivers
- 3.2.1. 4.; Availability of abundant natural gas reserves and the lower cost compared to other fossil fuel types4.; Growing investments to increase production to fulfill global demand
- 3.3. Market Restrains
- 3.3.1. 4.; The global shift toward renewable sources for electricity generation
- 3.4. Market Trends
- 3.4.1. Natural Gas Pipeline Type to Dominate the Market
- 4. Market Factor Analysis
- 4.1. Porters Five Forces
- 4.2. Supply/Value Chain
- 4.3. PESTEL analysis
- 4.4. Market Entropy
- 4.5. Patent/Trademark Analysis
- 5. Global Onshore Oil And Gas Pipeline Market Analysis, Insights and Forecast, 2019-2031
- 5.1. Market Analysis, Insights and Forecast - by Type
- 5.1.1. Oil Pipeline
- 5.1.2. Gas Pipeline
- 5.2. Market Analysis, Insights and Forecast - by Region
- 5.2.1. North America
- 5.2.2. Europe
- 5.2.3. Asia Pacific
- 5.2.4. South America
- 5.2.5. Middle East and Africa
- 5.1. Market Analysis, Insights and Forecast - by Type
- 6. North America Onshore Oil And Gas Pipeline Market Analysis, Insights and Forecast, 2019-2031
- 6.1. Market Analysis, Insights and Forecast - by Type
- 6.1.1. Oil Pipeline
- 6.1.2. Gas Pipeline
- 6.1. Market Analysis, Insights and Forecast - by Type
- 7. Europe Onshore Oil And Gas Pipeline Market Analysis, Insights and Forecast, 2019-2031
- 7.1. Market Analysis, Insights and Forecast - by Type
- 7.1.1. Oil Pipeline
- 7.1.2. Gas Pipeline
- 7.1. Market Analysis, Insights and Forecast - by Type
- 8. Asia Pacific Onshore Oil And Gas Pipeline Market Analysis, Insights and Forecast, 2019-2031
- 8.1. Market Analysis, Insights and Forecast - by Type
- 8.1.1. Oil Pipeline
- 8.1.2. Gas Pipeline
- 8.1. Market Analysis, Insights and Forecast - by Type
- 9. South America Onshore Oil And Gas Pipeline Market Analysis, Insights and Forecast, 2019-2031
- 9.1. Market Analysis, Insights and Forecast - by Type
- 9.1.1. Oil Pipeline
- 9.1.2. Gas Pipeline
- 9.1. Market Analysis, Insights and Forecast - by Type
- 10. Middle East and Africa Onshore Oil And Gas Pipeline Market Analysis, Insights and Forecast, 2019-2031
- 10.1. Market Analysis, Insights and Forecast - by Type
- 10.1.1. Oil Pipeline
- 10.1.2. Gas Pipeline
- 10.1. Market Analysis, Insights and Forecast - by Type
- 11. North America Onshore Oil And Gas Pipeline Market Analysis, Insights and Forecast, 2019-2031
- 11.1. Market Analysis, Insights and Forecast - By Country/Sub-region
- 11.1.1 United States
- 11.1.2 Canada
- 11.1.3 Mexico
- 12. Europe Onshore Oil And Gas Pipeline Market Analysis, Insights and Forecast, 2019-2031
- 12.1. Market Analysis, Insights and Forecast - By Country/Sub-region
- 12.1.1 Germany
- 12.1.2 United Kingdom
- 12.1.3 France
- 12.1.4 Spain
- 12.1.5 Italy
- 12.1.6 Spain
- 12.1.7 Belgium
- 12.1.8 Netherland
- 12.1.9 Nordics
- 12.1.10 Rest of Europe
- 13. Asia Pacific Onshore Oil And Gas Pipeline Market Analysis, Insights and Forecast, 2019-2031
- 13.1. Market Analysis, Insights and Forecast - By Country/Sub-region
- 13.1.1 China
- 13.1.2 Japan
- 13.1.3 India
- 13.1.4 South Korea
- 13.1.5 Southeast Asia
- 13.1.6 Australia
- 13.1.7 Indonesia
- 13.1.8 Phillipes
- 13.1.9 Singapore
- 13.1.10 Thailandc
- 13.1.11 Rest of Asia Pacific
- 14. South America Onshore Oil And Gas Pipeline Market Analysis, Insights and Forecast, 2019-2031
- 14.1. Market Analysis, Insights and Forecast - By Country/Sub-region
- 14.1.1 Brazil
- 14.1.2 Argentina
- 14.1.3 Peru
- 14.1.4 Chile
- 14.1.5 Colombia
- 14.1.6 Ecuador
- 14.1.7 Venezuela
- 14.1.8 Rest of South America
- 15. North America Onshore Oil And Gas Pipeline Market Analysis, Insights and Forecast, 2019-2031
- 15.1. Market Analysis, Insights and Forecast - By Country/Sub-region
- 15.1.1 United States
- 15.1.2 Canada
- 15.1.3 Mexico
- 16. MEA Onshore Oil And Gas Pipeline Market Analysis, Insights and Forecast, 2019-2031
- 16.1. Market Analysis, Insights and Forecast - By Country/Sub-region
- 16.1.1 United Arab Emirates
- 16.1.2 Saudi Arabia
- 16.1.3 South Africa
- 16.1.4 Rest of Middle East and Africa
- 17. Competitive Analysis
- 17.1. Global Market Share Analysis 2024
- 17.2. Company Profiles
- 17.2.1 TMK Group
- 17.2.1.1. Overview
- 17.2.1.2. Products
- 17.2.1.3. SWOT Analysis
- 17.2.1.4. Recent Developments
- 17.2.1.5. Financials (Based on Availability)
- 17.2.2 WorleyParsons Limited
- 17.2.2.1. Overview
- 17.2.2.2. Products
- 17.2.2.3. SWOT Analysis
- 17.2.2.4. Recent Developments
- 17.2.2.5. Financials (Based on Availability)
- 17.2.3 Tenaris SA
- 17.2.3.1. Overview
- 17.2.3.2. Products
- 17.2.3.3. SWOT Analysis
- 17.2.3.4. Recent Developments
- 17.2.3.5. Financials (Based on Availability)
- 17.2.4 TC Energy Corporation
- 17.2.4.1. Overview
- 17.2.4.2. Products
- 17.2.4.3. SWOT Analysis
- 17.2.4.4. Recent Developments
- 17.2.4.5. Financials (Based on Availability)
- 17.2.5 Essar Group
- 17.2.5.1. Overview
- 17.2.5.2. Products
- 17.2.5.3. SWOT Analysis
- 17.2.5.4. Recent Developments
- 17.2.5.5. Financials (Based on Availability)
- 17.2.6 Jindal SAW Ltd
- 17.2.6.1. Overview
- 17.2.6.2. Products
- 17.2.6.3. SWOT Analysis
- 17.2.6.4. Recent Developments
- 17.2.6.5. Financials (Based on Availability)
- 17.2.7 Mastec Inc *List Not Exhaustive 6 4 Market Ranking Analysi
- 17.2.7.1. Overview
- 17.2.7.2. Products
- 17.2.7.3. SWOT Analysis
- 17.2.7.4. Recent Developments
- 17.2.7.5. Financials (Based on Availability)
- 17.2.8 Europipe GmbH
- 17.2.8.1. Overview
- 17.2.8.2. Products
- 17.2.8.3. SWOT Analysis
- 17.2.8.4. Recent Developments
- 17.2.8.5. Financials (Based on Availability)
- 17.2.9 Baoshan Iron & Steel Co Ltd
- 17.2.9.1. Overview
- 17.2.9.2. Products
- 17.2.9.3. SWOT Analysis
- 17.2.9.4. Recent Developments
- 17.2.9.5. Financials (Based on Availability)
- 17.2.10 CPW America Co
- 17.2.10.1. Overview
- 17.2.10.2. Products
- 17.2.10.3. SWOT Analysis
- 17.2.10.4. Recent Developments
- 17.2.10.5. Financials (Based on Availability)
- 17.2.1 TMK Group
List of Figures
- Figure 1: Global Onshore Oil And Gas Pipeline Market Revenue Breakdown (Million, %) by Region 2024 & 2032
- Figure 2: North America Onshore Oil And Gas Pipeline Market Revenue (Million), by Country 2024 & 2032
- Figure 3: North America Onshore Oil And Gas Pipeline Market Revenue Share (%), by Country 2024 & 2032
- Figure 4: Europe Onshore Oil And Gas Pipeline Market Revenue (Million), by Country 2024 & 2032
- Figure 5: Europe Onshore Oil And Gas Pipeline Market Revenue Share (%), by Country 2024 & 2032
- Figure 6: Asia Pacific Onshore Oil And Gas Pipeline Market Revenue (Million), by Country 2024 & 2032
- Figure 7: Asia Pacific Onshore Oil And Gas Pipeline Market Revenue Share (%), by Country 2024 & 2032
- Figure 8: South America Onshore Oil And Gas Pipeline Market Revenue (Million), by Country 2024 & 2032
- Figure 9: South America Onshore Oil And Gas Pipeline Market Revenue Share (%), by Country 2024 & 2032
- Figure 10: North America Onshore Oil And Gas Pipeline Market Revenue (Million), by Country 2024 & 2032
- Figure 11: North America Onshore Oil And Gas Pipeline Market Revenue Share (%), by Country 2024 & 2032
- Figure 12: MEA Onshore Oil And Gas Pipeline Market Revenue (Million), by Country 2024 & 2032
- Figure 13: MEA Onshore Oil And Gas Pipeline Market Revenue Share (%), by Country 2024 & 2032
- Figure 14: North America Onshore Oil And Gas Pipeline Market Revenue (Million), by Type 2024 & 2032
- Figure 15: North America Onshore Oil And Gas Pipeline Market Revenue Share (%), by Type 2024 & 2032
- Figure 16: North America Onshore Oil And Gas Pipeline Market Revenue (Million), by Country 2024 & 2032
- Figure 17: North America Onshore Oil And Gas Pipeline Market Revenue Share (%), by Country 2024 & 2032
- Figure 18: Europe Onshore Oil And Gas Pipeline Market Revenue (Million), by Type 2024 & 2032
- Figure 19: Europe Onshore Oil And Gas Pipeline Market Revenue Share (%), by Type 2024 & 2032
- Figure 20: Europe Onshore Oil And Gas Pipeline Market Revenue (Million), by Country 2024 & 2032
- Figure 21: Europe Onshore Oil And Gas Pipeline Market Revenue Share (%), by Country 2024 & 2032
- Figure 22: Asia Pacific Onshore Oil And Gas Pipeline Market Revenue (Million), by Type 2024 & 2032
- Figure 23: Asia Pacific Onshore Oil And Gas Pipeline Market Revenue Share (%), by Type 2024 & 2032
- Figure 24: Asia Pacific Onshore Oil And Gas Pipeline Market Revenue (Million), by Country 2024 & 2032
- Figure 25: Asia Pacific Onshore Oil And Gas Pipeline Market Revenue Share (%), by Country 2024 & 2032
- Figure 26: South America Onshore Oil And Gas Pipeline Market Revenue (Million), by Type 2024 & 2032
- Figure 27: South America Onshore Oil And Gas Pipeline Market Revenue Share (%), by Type 2024 & 2032
- Figure 28: South America Onshore Oil And Gas Pipeline Market Revenue (Million), by Country 2024 & 2032
- Figure 29: South America Onshore Oil And Gas Pipeline Market Revenue Share (%), by Country 2024 & 2032
- Figure 30: Middle East and Africa Onshore Oil And Gas Pipeline Market Revenue (Million), by Type 2024 & 2032
- Figure 31: Middle East and Africa Onshore Oil And Gas Pipeline Market Revenue Share (%), by Type 2024 & 2032
- Figure 32: Middle East and Africa Onshore Oil And Gas Pipeline Market Revenue (Million), by Country 2024 & 2032
- Figure 33: Middle East and Africa Onshore Oil And Gas Pipeline Market Revenue Share (%), by Country 2024 & 2032
List of Tables
- Table 1: Global Onshore Oil And Gas Pipeline Market Revenue Million Forecast, by Region 2019 & 2032
- Table 2: Global Onshore Oil And Gas Pipeline Market Revenue Million Forecast, by Type 2019 & 2032
- Table 3: Global Onshore Oil And Gas Pipeline Market Revenue Million Forecast, by Region 2019 & 2032
- Table 4: Global Onshore Oil And Gas Pipeline Market Revenue Million Forecast, by Country 2019 & 2032
- Table 5: United States Onshore Oil And Gas Pipeline Market Revenue (Million) Forecast, by Application 2019 & 2032
- Table 6: Canada Onshore Oil And Gas Pipeline Market Revenue (Million) Forecast, by Application 2019 & 2032
- Table 7: Mexico Onshore Oil And Gas Pipeline Market Revenue (Million) Forecast, by Application 2019 & 2032
- Table 8: Global Onshore Oil And Gas Pipeline Market Revenue Million Forecast, by Country 2019 & 2032
- Table 9: Germany Onshore Oil And Gas Pipeline Market Revenue (Million) Forecast, by Application 2019 & 2032
- Table 10: United Kingdom Onshore Oil And Gas Pipeline Market Revenue (Million) Forecast, by Application 2019 & 2032
- Table 11: France Onshore Oil And Gas Pipeline Market Revenue (Million) Forecast, by Application 2019 & 2032
- Table 12: Spain Onshore Oil And Gas Pipeline Market Revenue (Million) Forecast, by Application 2019 & 2032
- Table 13: Italy Onshore Oil And Gas Pipeline Market Revenue (Million) Forecast, by Application 2019 & 2032
- Table 14: Spain Onshore Oil And Gas Pipeline Market Revenue (Million) Forecast, by Application 2019 & 2032
- Table 15: Belgium Onshore Oil And Gas Pipeline Market Revenue (Million) Forecast, by Application 2019 & 2032
- Table 16: Netherland Onshore Oil And Gas Pipeline Market Revenue (Million) Forecast, by Application 2019 & 2032
- Table 17: Nordics Onshore Oil And Gas Pipeline Market Revenue (Million) Forecast, by Application 2019 & 2032
- Table 18: Rest of Europe Onshore Oil And Gas Pipeline Market Revenue (Million) Forecast, by Application 2019 & 2032
- Table 19: Global Onshore Oil And Gas Pipeline Market Revenue Million Forecast, by Country 2019 & 2032
- Table 20: China Onshore Oil And Gas Pipeline Market Revenue (Million) Forecast, by Application 2019 & 2032
- Table 21: Japan Onshore Oil And Gas Pipeline Market Revenue (Million) Forecast, by Application 2019 & 2032
- Table 22: India Onshore Oil And Gas Pipeline Market Revenue (Million) Forecast, by Application 2019 & 2032
- Table 23: South Korea Onshore Oil And Gas Pipeline Market Revenue (Million) Forecast, by Application 2019 & 2032
- Table 24: Southeast Asia Onshore Oil And Gas Pipeline Market Revenue (Million) Forecast, by Application 2019 & 2032
- Table 25: Australia Onshore Oil And Gas Pipeline Market Revenue (Million) Forecast, by Application 2019 & 2032
- Table 26: Indonesia Onshore Oil And Gas Pipeline Market Revenue (Million) Forecast, by Application 2019 & 2032
- Table 27: Phillipes Onshore Oil And Gas Pipeline Market Revenue (Million) Forecast, by Application 2019 & 2032
- Table 28: Singapore Onshore Oil And Gas Pipeline Market Revenue (Million) Forecast, by Application 2019 & 2032
- Table 29: Thailandc Onshore Oil And Gas Pipeline Market Revenue (Million) Forecast, by Application 2019 & 2032
- Table 30: Rest of Asia Pacific Onshore Oil And Gas Pipeline Market Revenue (Million) Forecast, by Application 2019 & 2032
- Table 31: Global Onshore Oil And Gas Pipeline Market Revenue Million Forecast, by Country 2019 & 2032
- Table 32: Brazil Onshore Oil And Gas Pipeline Market Revenue (Million) Forecast, by Application 2019 & 2032
- Table 33: Argentina Onshore Oil And Gas Pipeline Market Revenue (Million) Forecast, by Application 2019 & 2032
- Table 34: Peru Onshore Oil And Gas Pipeline Market Revenue (Million) Forecast, by Application 2019 & 2032
- Table 35: Chile Onshore Oil And Gas Pipeline Market Revenue (Million) Forecast, by Application 2019 & 2032
- Table 36: Colombia Onshore Oil And Gas Pipeline Market Revenue (Million) Forecast, by Application 2019 & 2032
- Table 37: Ecuador Onshore Oil And Gas Pipeline Market Revenue (Million) Forecast, by Application 2019 & 2032
- Table 38: Venezuela Onshore Oil And Gas Pipeline Market Revenue (Million) Forecast, by Application 2019 & 2032
- Table 39: Rest of South America Onshore Oil And Gas Pipeline Market Revenue (Million) Forecast, by Application 2019 & 2032
- Table 40: Global Onshore Oil And Gas Pipeline Market Revenue Million Forecast, by Country 2019 & 2032
- Table 41: United States Onshore Oil And Gas Pipeline Market Revenue (Million) Forecast, by Application 2019 & 2032
- Table 42: Canada Onshore Oil And Gas Pipeline Market Revenue (Million) Forecast, by Application 2019 & 2032
- Table 43: Mexico Onshore Oil And Gas Pipeline Market Revenue (Million) Forecast, by Application 2019 & 2032
- Table 44: Global Onshore Oil And Gas Pipeline Market Revenue Million Forecast, by Country 2019 & 2032
- Table 45: United Arab Emirates Onshore Oil And Gas Pipeline Market Revenue (Million) Forecast, by Application 2019 & 2032
- Table 46: Saudi Arabia Onshore Oil And Gas Pipeline Market Revenue (Million) Forecast, by Application 2019 & 2032
- Table 47: South Africa Onshore Oil And Gas Pipeline Market Revenue (Million) Forecast, by Application 2019 & 2032
- Table 48: Rest of Middle East and Africa Onshore Oil And Gas Pipeline Market Revenue (Million) Forecast, by Application 2019 & 2032
- Table 49: Global Onshore Oil And Gas Pipeline Market Revenue Million Forecast, by Type 2019 & 2032
- Table 50: Global Onshore Oil And Gas Pipeline Market Revenue Million Forecast, by Country 2019 & 2032
- Table 51: United States Onshore Oil And Gas Pipeline Market Revenue (Million) Forecast, by Application 2019 & 2032
- Table 52: Canada Onshore Oil And Gas Pipeline Market Revenue (Million) Forecast, by Application 2019 & 2032
- Table 53: Rest of North America Onshore Oil And Gas Pipeline Market Revenue (Million) Forecast, by Application 2019 & 2032
- Table 54: Global Onshore Oil And Gas Pipeline Market Revenue Million Forecast, by Type 2019 & 2032
- Table 55: Global Onshore Oil And Gas Pipeline Market Revenue Million Forecast, by Country 2019 & 2032
- Table 56: Norway Onshore Oil And Gas Pipeline Market Revenue (Million) Forecast, by Application 2019 & 2032
- Table 57: United Kingdom Onshore Oil And Gas Pipeline Market Revenue (Million) Forecast, by Application 2019 & 2032
- Table 58: France Onshore Oil And Gas Pipeline Market Revenue (Million) Forecast, by Application 2019 & 2032
- Table 59: Spain Onshore Oil And Gas Pipeline Market Revenue (Million) Forecast, by Application 2019 & 2032
- Table 60: NORDIC Onshore Oil And Gas Pipeline Market Revenue (Million) Forecast, by Application 2019 & 2032
- Table 61: Russia Onshore Oil And Gas Pipeline Market Revenue (Million) Forecast, by Application 2019 & 2032
- Table 62: Rest of Europe Onshore Oil And Gas Pipeline Market Revenue (Million) Forecast, by Application 2019 & 2032
- Table 63: Global Onshore Oil And Gas Pipeline Market Revenue Million Forecast, by Type 2019 & 2032
- Table 64: Global Onshore Oil And Gas Pipeline Market Revenue Million Forecast, by Country 2019 & 2032
- Table 65: China Onshore Oil And Gas Pipeline Market Revenue (Million) Forecast, by Application 2019 & 2032
- Table 66: India Onshore Oil And Gas Pipeline Market Revenue (Million) Forecast, by Application 2019 & 2032
- Table 67: Indonesia Onshore Oil And Gas Pipeline Market Revenue (Million) Forecast, by Application 2019 & 2032
- Table 68: Malaysia Onshore Oil And Gas Pipeline Market Revenue (Million) Forecast, by Application 2019 & 2032
- Table 69: Vietnam Onshore Oil And Gas Pipeline Market Revenue (Million) Forecast, by Application 2019 & 2032
- Table 70: Thailand Onshore Oil And Gas Pipeline Market Revenue (Million) Forecast, by Application 2019 & 2032
- Table 71: Rest of Asia Pacific Onshore Oil And Gas Pipeline Market Revenue (Million) Forecast, by Application 2019 & 2032
- Table 72: Global Onshore Oil And Gas Pipeline Market Revenue Million Forecast, by Type 2019 & 2032
- Table 73: Global Onshore Oil And Gas Pipeline Market Revenue Million Forecast, by Country 2019 & 2032
- Table 74: Brazil Onshore Oil And Gas Pipeline Market Revenue (Million) Forecast, by Application 2019 & 2032
- Table 75: Argentina Onshore Oil And Gas Pipeline Market Revenue (Million) Forecast, by Application 2019 & 2032
- Table 76: Colombia Onshore Oil And Gas Pipeline Market Revenue (Million) Forecast, by Application 2019 & 2032
- Table 77: Rest of South Africa Onshore Oil And Gas Pipeline Market Revenue (Million) Forecast, by Application 2019 & 2032
- Table 78: Global Onshore Oil And Gas Pipeline Market Revenue Million Forecast, by Type 2019 & 2032
- Table 79: Global Onshore Oil And Gas Pipeline Market Revenue Million Forecast, by Country 2019 & 2032
- Table 80: United Arab Emirates Onshore Oil And Gas Pipeline Market Revenue (Million) Forecast, by Application 2019 & 2032
- Table 81: Saudi Arabia Onshore Oil And Gas Pipeline Market Revenue (Million) Forecast, by Application 2019 & 2032
- Table 82: South Africa Onshore Oil And Gas Pipeline Market Revenue (Million) Forecast, by Application 2019 & 2032
- Table 83: Egypt Onshore Oil And Gas Pipeline Market Revenue (Million) Forecast, by Application 2019 & 2032
- Table 84: Nigeria Onshore Oil And Gas Pipeline Market Revenue (Million) Forecast, by Application 2019 & 2032
- Table 85: Qatar Onshore Oil And Gas Pipeline Market Revenue (Million) Forecast, by Application 2019 & 2032
- Table 86: Rest of Middle East and Africa Onshore Oil And Gas Pipeline Market Revenue (Million) Forecast, by Application 2019 & 2032
Frequently Asked Questions
1. What is the projected Compound Annual Growth Rate (CAGR) of the Onshore Oil And Gas Pipeline Market?
The projected CAGR is approximately 4.60%.
2. Which companies are prominent players in the Onshore Oil And Gas Pipeline Market?
Key companies in the market include TMK Group, WorleyParsons Limited, Tenaris SA, TC Energy Corporation, Essar Group, Jindal SAW Ltd, Mastec Inc *List Not Exhaustive 6 4 Market Ranking Analysi, Europipe GmbH, Baoshan Iron & Steel Co Ltd, CPW America Co.
3. What are the main segments of the Onshore Oil And Gas Pipeline Market?
The market segments include Type.
4. Can you provide details about the market size?
The market size is estimated to be USD 68.03 Million as of 2022.
5. What are some drivers contributing to market growth?
4.; Availability of abundant natural gas reserves and the lower cost compared to other fossil fuel types4.; Growing investments to increase production to fulfill global demand.
6. What are the notable trends driving market growth?
Natural Gas Pipeline Type to Dominate the Market.
7. Are there any restraints impacting market growth?
4.; The global shift toward renewable sources for electricity generation.
8. Can you provide examples of recent developments in the market?
N/A
9. What pricing options are available for accessing the report?
Pricing options include single-user, multi-user, and enterprise licenses priced at USD 4750, USD 5250, and USD 8750 respectively.
10. Is the market size provided in terms of value or volume?
The market size is provided in terms of value, measured in Million.
11. Are there any specific market keywords associated with the report?
Yes, the market keyword associated with the report is "Onshore Oil And Gas Pipeline Market," which aids in identifying and referencing the specific market segment covered.
12. How do I determine which pricing option suits my needs best?
The pricing options vary based on user requirements and access needs. Individual users may opt for single-user licenses, while businesses requiring broader access may choose multi-user or enterprise licenses for cost-effective access to the report.
13. Are there any additional resources or data provided in the Onshore Oil And Gas Pipeline Market report?
While the report offers comprehensive insights, it's advisable to review the specific contents or supplementary materials provided to ascertain if additional resources or data are available.
14. How can I stay updated on further developments or reports in the Onshore Oil And Gas Pipeline Market?
To stay informed about further developments, trends, and reports in the Onshore Oil And Gas Pipeline Market, consider subscribing to industry newsletters, following relevant companies and organizations, or regularly checking reputable industry news sources and publications.
Methodology
Step 1 - Identification of Relevant Samples Size from Population Database


Step 2 - Approaches for Defining Global Market Size (Value, Volume* & Price*)

Note*: In applicable scenarios
Step 3 - Data Sources
Primary Research
- Web Analytics
- Survey Reports
- Research Institute
- Latest Research Reports
- Opinion Leaders
Secondary Research
- Annual Reports
- White Paper
- Latest Press Release
- Industry Association
- Paid Database
- Investor Presentations

Step 4 - Data Triangulation
Involves using different sources of information in order to increase the validity of a study
These sources are likely to be stakeholders in a program - participants, other researchers, program staff, other community members, and so on.
Then we put all data in single framework & apply various statistical tools to find out the dynamic on the market.
During the analysis stage, feedback from the stakeholder groups would be compared to determine areas of agreement as well as areas of divergence
