

Key Insights
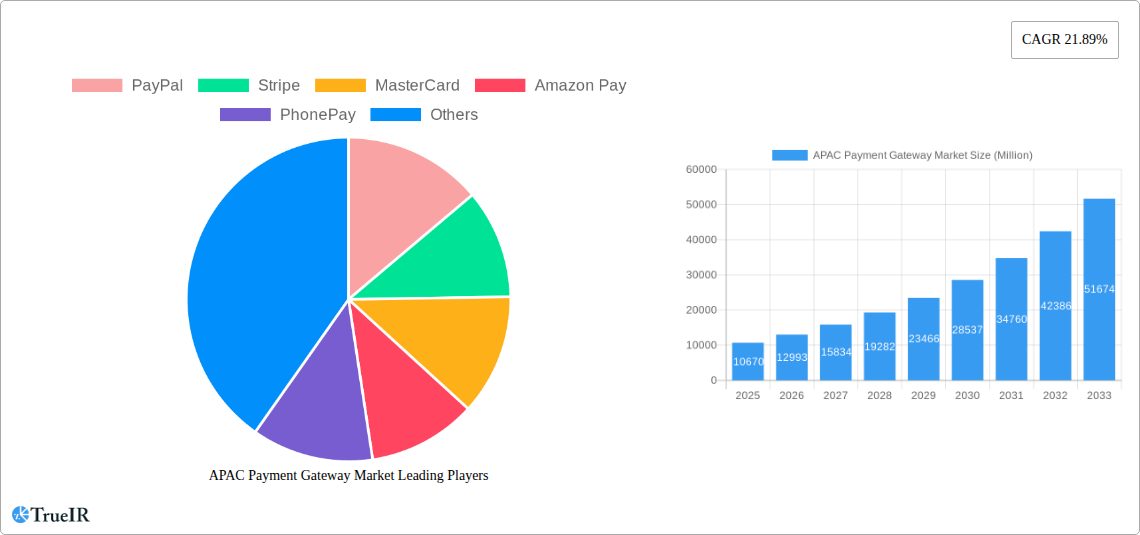
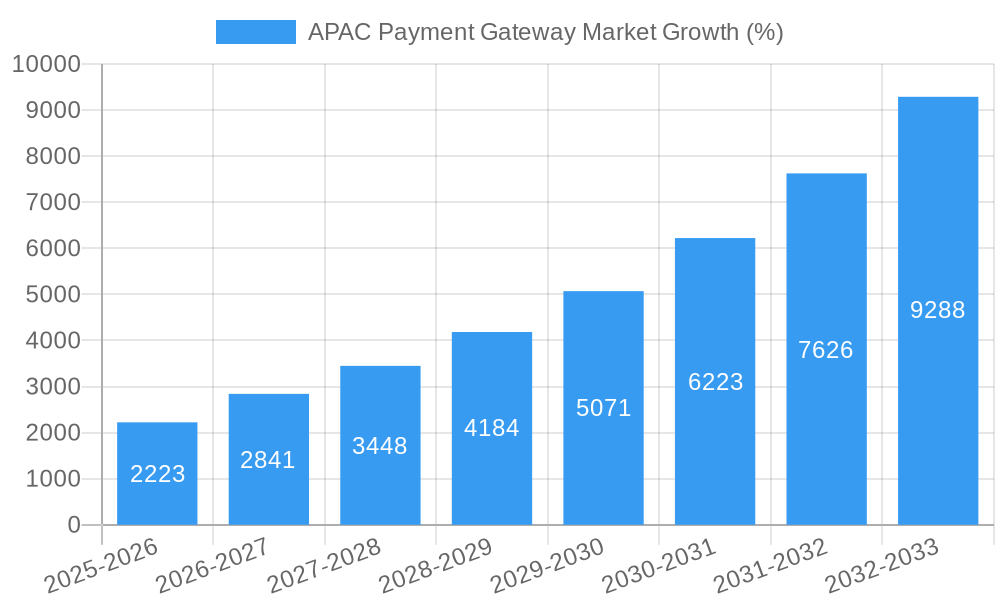
The Asia-Pacific (APAC) payment gateway market is experiencing robust growth, projected to reach \$10.67 billion in 2025 and maintain a Compound Annual Growth Rate (CAGR) of 21.89% from 2025 to 2033. This surge is driven by several key factors. The region's rapidly expanding e-commerce sector, fueled by increasing internet and smartphone penetration, is a primary catalyst. Furthermore, the rising adoption of digital payment methods, particularly among younger demographics, is significantly contributing to market expansion. Government initiatives promoting digital financial inclusion and robust investments in fintech infrastructure are further bolstering growth. The increasing preference for contactless payments, accelerated by the COVID-19 pandemic, also plays a crucial role. Competition among established players like PayPal, Stripe, MasterCard, and Amazon Pay, alongside regional giants such as PhonePe, Google Pay, and RazorPay, is driving innovation and fostering market dynamism. However, challenges remain, including concerns around data security and fraud prevention, and the need to address varying levels of digital literacy across the region. The market segmentation is likely diverse, encompassing solutions tailored to various business sizes and industry verticals, reflecting the heterogeneity of the APAC economic landscape.
The forecast period (2025-2033) anticipates continued strong growth, propelled by ongoing digital transformation across various sectors. The market will likely see further diversification of payment methods, including the integration of emerging technologies such as blockchain and artificial intelligence. Regulatory changes and the evolving cybersecurity landscape will also significantly influence market dynamics. The competitive landscape will remain intense, with existing players consolidating their market share and new entrants continuously emerging. Success will depend on factors such as the ability to offer seamless, secure, and localized payment solutions, coupled with robust customer support and effective marketing strategies. A focus on addressing the unique needs of specific sub-regions within APAC will be crucial for sustained growth.
APAC Payment Gateway Market: A Comprehensive Report (2019-2033)
This dynamic report provides an in-depth analysis of the Asia-Pacific (APAC) payment gateway market, offering invaluable insights for businesses and investors seeking to navigate this rapidly evolving landscape. The study period spans 2019-2033, with 2025 as the base and estimated year, and a forecast period covering 2025-2033. The historical period analyzed is 2019-2024. Expect detailed market sizing, segmentation, competitive analysis, and future projections, all supported by robust data and expert analysis. The market is projected to reach xx Million by 2033, exhibiting a compelling CAGR of xx%.
APAC Payment Gateway Market Market Structure & Competitive Landscape
The APAC payment gateway market is characterized by a dynamic interplay of established players and emerging fintech companies. Market concentration is moderate, with a Herfindahl-Hirschman Index (HHI) estimated at xx, indicating the presence of both significant market leaders and a competitive fringe. Innovation is a key driver, fueled by advancements in mobile payments, AI-powered fraud detection, and open banking initiatives. Regulatory changes, varying across different APAC nations, significantly influence market dynamics, creating both opportunities and challenges for businesses. Product substitution is primarily driven by the emergence of newer, more efficient payment technologies, while mergers and acquisitions (M&A) activity is robust, with an estimated xx Million in M&A volume during 2019-2024. End-user segmentation is diverse, encompassing e-commerce businesses, financial institutions, and individual consumers with varying needs and payment preferences.
- Market Concentration: Moderate (HHI: xx)
- Innovation Drivers: Mobile payments, AI, Open Banking
- Regulatory Impacts: Significant variations across APAC nations
- Product Substitutes: Emergence of new payment technologies
- End-User Segmentation: E-commerce, Financial Institutions, Consumers
- M&A Trends: Significant activity (xx Million in 2019-2024)
APAC Payment Gateway Market Market Trends & Opportunities
The APAC payment gateway market is experiencing robust growth, driven by the region's burgeoning digital economy, increasing smartphone penetration, and a shift towards cashless transactions. Market size expanded from xx Million in 2019 to xx Million in 2024, and is projected to reach xx Million by 2033. Technological advancements, such as the rise of mobile wallets and Buy Now Pay Later (BNPL) services, are reshaping consumer preferences and driving significant market penetration. The competitive landscape is intensifying, with both established players and disruptive fintech startups vying for market share. This competition fosters innovation and drives down costs, ultimately benefiting consumers. The market is witnessing an increasing adoption of cloud-based payment gateways, offering scalability and flexibility to businesses of all sizes. The increasing integration of blockchain technology and cryptocurrency payments is also an important trend to watch.
Dominant Markets & Segments in APAC Payment Gateway Market
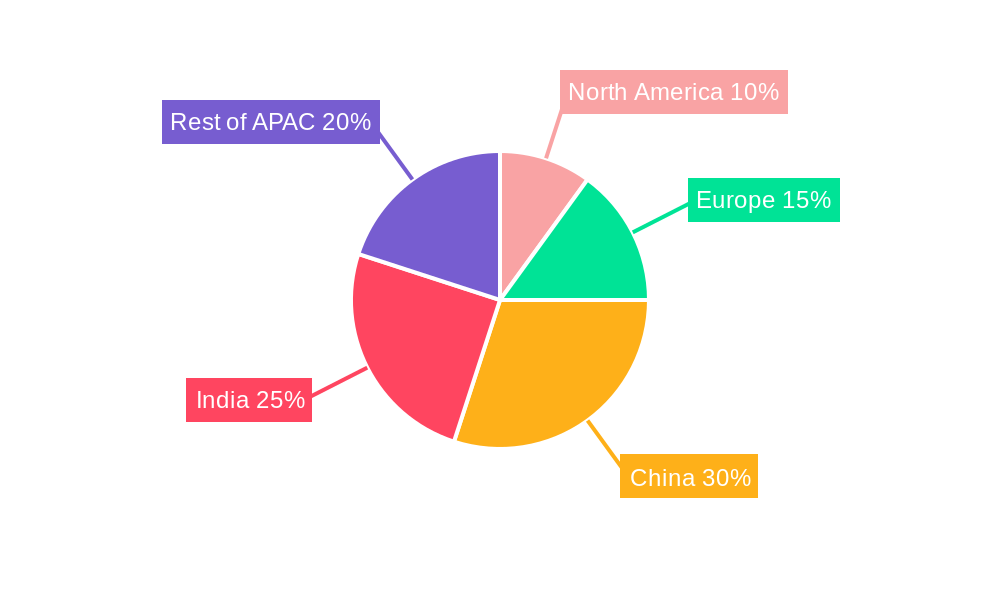
China and India remain the dominant markets within the APAC region, fueled by their massive populations and rapidly expanding digital economies. Other key markets include Japan, South Korea, Australia, and Singapore. The e-commerce segment constitutes the largest share of the market, driven by the phenomenal growth of online retail across the region. Other significant segments include in-app payments, peer-to-peer (P2P) transfers, and subscription billing.
- China: Massive population, strong government support for digital payments
- India: Rapid digital adoption, large underserved population
- Other key markets: Japan, South Korea, Australia, Singapore
- Dominant Segments: E-commerce, In-app payments, P2P transfers, Subscription billing
APAC Payment Gateway Market Product Analysis
Product innovation in the APAC payment gateway market is characterized by a focus on enhanced security, improved user experience, and seamless integration with various platforms. Key advancements include AI-powered fraud detection systems, biometrics-based authentication, and omnichannel payment solutions supporting various payment methods. These innovations cater to the evolving needs of merchants and consumers, enhancing trust and efficiency. The increasing demand for customizable and scalable payment solutions is also driving product differentiation.
Key Drivers, Barriers & Challenges in APAC Payment Gateway Market
Key Drivers:
- Increasing smartphone penetration and internet access.
- Rising e-commerce adoption and online transactions.
- Government initiatives promoting digital payments.
- Advancements in payment technologies (e.g., mobile wallets, BNPL).
Challenges:
- Regulatory hurdles and varying compliance requirements across different countries.
- Security concerns and the risk of fraud.
- Competition from established players and new entrants.
- Infrastructure limitations in some regions.
Growth Drivers in the APAC Payment Gateway Market Market
The APAC payment gateway market is propelled by several key factors: the expanding e-commerce sector, rising smartphone penetration, supportive government policies promoting digital transactions in several key markets, and the continuous innovation in payment technologies. These factors combine to create a fertile ground for growth, attracting significant investment and fostering competition.
Challenges Impacting APAC Payment Gateway Market Growth
Significant challenges include varying regulatory landscapes across the APAC region, security threats like fraud and data breaches, and fierce competition among numerous players. These factors can impact market expansion and profitability for individual companies.
Key Players Shaping the APAP Payment Gateway Market Market
- PayPal
- Stripe
- MasterCard
- Amazon Pay
- PhonePay
- GooglePay
- RazorPay
- AsiaPay
- 2Checkout com Inc
- Eway
Significant APAC Payment Gateway Market Industry Milestones
- May 2024: Mastercard launched domestic payment processing services in China through its joint venture, Mastercard NetsUnion Information Technology.
- April 2024: Soft Space partnered with JCB to introduce a payment gateway in Malaysia, addressing the rising demand for secure digital transactions.
Future Outlook for APAC Payment Gateway Market Market
The APAC payment gateway market is poised for continued robust growth, driven by the region's expanding digital economy and ongoing technological advancements. Strategic opportunities lie in focusing on innovative payment solutions tailored to specific market needs, expanding into underserved regions, and strengthening security measures to maintain consumer trust. The market presents significant potential for both established players and new entrants, offering a dynamic and rewarding landscape for those who can adapt and innovate.
APAC Payment Gateway Market Segmentation
-
1. Type
- 1.1. Hosted
- 1.2. Non-hosted
-
2. Enterprise
- 2.1. Small and Medium Enterprise (SME)
- 2.2. Large Enterprise
-
3. End User
- 3.1. Travel
- 3.2. Retail
- 3.3. BFSI
- 3.4. Media and Entertainment
- 3.5. Other End Users
APAC Payment Gateway Market Segmentation By Geography
-
1. North America
- 1.1. United States
- 1.2. Canada
- 1.3. Mexico
-
2. South America
- 2.1. Brazil
- 2.2. Argentina
- 2.3. Rest of South America
-
3. Europe
- 3.1. United Kingdom
- 3.2. Germany
- 3.3. France
- 3.4. Italy
- 3.5. Spain
- 3.6. Russia
- 3.7. Benelux
- 3.8. Nordics
- 3.9. Rest of Europe
-
4. Middle East & Africa
- 4.1. Turkey
- 4.2. Israel
- 4.3. GCC
- 4.4. North Africa
- 4.5. South Africa
- 4.6. Rest of Middle East & Africa
-
5. Asia Pacific
- 5.1. China
- 5.2. India
- 5.3. Japan
- 5.4. South Korea
- 5.5. ASEAN
- 5.6. Oceania
- 5.7. Rest of Asia Pacific
APAC Payment Gateway Market REPORT HIGHLIGHTS
| Aspects | Details |
|---|---|
| Study Period | 2019-2033 |
| Base Year | 2024 |
| Estimated Year | 2025 |
| Forecast Period | 2025-2033 |
| Historical Period | 2019-2024 |
| Growth Rate | CAGR of 21.89% from 2019-2033 |
| Segmentation |
|
Table of Contents
- 1. Introduction
- 1.1. Research Scope
- 1.2. Market Segmentation
- 1.3. Research Methodology
- 1.4. Definitions and Assumptions
- 2. Executive Summary
- 2.1. Introduction
- 3. Market Dynamics
- 3.1. Introduction
- 3.2. Market Drivers
- 3.2.1. Increased E-commerce Sales and High Internet Penetration Rate; Increased Demand for Mobile-based Payments; Growing Adoption of Payment Gateways in Retail
- 3.3. Market Restrains
- 3.3.1. Increased E-commerce Sales and High Internet Penetration Rate; Increased Demand for Mobile-based Payments; Growing Adoption of Payment Gateways in Retail
- 3.4. Market Trends
- 3.4.1. Growing Use of Payment Gateway in Tavel Industry.
- 4. Market Factor Analysis
- 4.1. Porters Five Forces
- 4.2. Supply/Value Chain
- 4.3. PESTEL analysis
- 4.4. Market Entropy
- 4.5. Patent/Trademark Analysis
- 5. Global APAC Payment Gateway Market Analysis, Insights and Forecast, 2019-2031
- 5.1. Market Analysis, Insights and Forecast - by Type
- 5.1.1. Hosted
- 5.1.2. Non-hosted
- 5.2. Market Analysis, Insights and Forecast - by Enterprise
- 5.2.1. Small and Medium Enterprise (SME)
- 5.2.2. Large Enterprise
- 5.3. Market Analysis, Insights and Forecast - by End User
- 5.3.1. Travel
- 5.3.2. Retail
- 5.3.3. BFSI
- 5.3.4. Media and Entertainment
- 5.3.5. Other End Users
- 5.4. Market Analysis, Insights and Forecast - by Region
- 5.4.1. North America
- 5.4.2. South America
- 5.4.3. Europe
- 5.4.4. Middle East & Africa
- 5.4.5. Asia Pacific
- 5.1. Market Analysis, Insights and Forecast - by Type
- 6. North America APAC Payment Gateway Market Analysis, Insights and Forecast, 2019-2031
- 6.1. Market Analysis, Insights and Forecast - by Type
- 6.1.1. Hosted
- 6.1.2. Non-hosted
- 6.2. Market Analysis, Insights and Forecast - by Enterprise
- 6.2.1. Small and Medium Enterprise (SME)
- 6.2.2. Large Enterprise
- 6.3. Market Analysis, Insights and Forecast - by End User
- 6.3.1. Travel
- 6.3.2. Retail
- 6.3.3. BFSI
- 6.3.4. Media and Entertainment
- 6.3.5. Other End Users
- 6.1. Market Analysis, Insights and Forecast - by Type
- 7. South America APAC Payment Gateway Market Analysis, Insights and Forecast, 2019-2031
- 7.1. Market Analysis, Insights and Forecast - by Type
- 7.1.1. Hosted
- 7.1.2. Non-hosted
- 7.2. Market Analysis, Insights and Forecast - by Enterprise
- 7.2.1. Small and Medium Enterprise (SME)
- 7.2.2. Large Enterprise
- 7.3. Market Analysis, Insights and Forecast - by End User
- 7.3.1. Travel
- 7.3.2. Retail
- 7.3.3. BFSI
- 7.3.4. Media and Entertainment
- 7.3.5. Other End Users
- 7.1. Market Analysis, Insights and Forecast - by Type
- 8. Europe APAC Payment Gateway Market Analysis, Insights and Forecast, 2019-2031
- 8.1. Market Analysis, Insights and Forecast - by Type
- 8.1.1. Hosted
- 8.1.2. Non-hosted
- 8.2. Market Analysis, Insights and Forecast - by Enterprise
- 8.2.1. Small and Medium Enterprise (SME)
- 8.2.2. Large Enterprise
- 8.3. Market Analysis, Insights and Forecast - by End User
- 8.3.1. Travel
- 8.3.2. Retail
- 8.3.3. BFSI
- 8.3.4. Media and Entertainment
- 8.3.5. Other End Users
- 8.1. Market Analysis, Insights and Forecast - by Type
- 9. Middle East & Africa APAC Payment Gateway Market Analysis, Insights and Forecast, 2019-2031
- 9.1. Market Analysis, Insights and Forecast - by Type
- 9.1.1. Hosted
- 9.1.2. Non-hosted
- 9.2. Market Analysis, Insights and Forecast - by Enterprise
- 9.2.1. Small and Medium Enterprise (SME)
- 9.2.2. Large Enterprise
- 9.3. Market Analysis, Insights and Forecast - by End User
- 9.3.1. Travel
- 9.3.2. Retail
- 9.3.3. BFSI
- 9.3.4. Media and Entertainment
- 9.3.5. Other End Users
- 9.1. Market Analysis, Insights and Forecast - by Type
- 10. Asia Pacific APAC Payment Gateway Market Analysis, Insights and Forecast, 2019-2031
- 10.1. Market Analysis, Insights and Forecast - by Type
- 10.1.1. Hosted
- 10.1.2. Non-hosted
- 10.2. Market Analysis, Insights and Forecast - by Enterprise
- 10.2.1. Small and Medium Enterprise (SME)
- 10.2.2. Large Enterprise
- 10.3. Market Analysis, Insights and Forecast - by End User
- 10.3.1. Travel
- 10.3.2. Retail
- 10.3.3. BFSI
- 10.3.4. Media and Entertainment
- 10.3.5. Other End Users
- 10.1. Market Analysis, Insights and Forecast - by Type
- 11. Competitive Analysis
- 11.1. Global Market Share Analysis 2024
- 11.2. Company Profiles
- 11.2.1 PayPal
- 11.2.1.1. Overview
- 11.2.1.2. Products
- 11.2.1.3. SWOT Analysis
- 11.2.1.4. Recent Developments
- 11.2.1.5. Financials (Based on Availability)
- 11.2.2 Stripe
- 11.2.2.1. Overview
- 11.2.2.2. Products
- 11.2.2.3. SWOT Analysis
- 11.2.2.4. Recent Developments
- 11.2.2.5. Financials (Based on Availability)
- 11.2.3 MasterCard
- 11.2.3.1. Overview
- 11.2.3.2. Products
- 11.2.3.3. SWOT Analysis
- 11.2.3.4. Recent Developments
- 11.2.3.5. Financials (Based on Availability)
- 11.2.4 Amazon Pay
- 11.2.4.1. Overview
- 11.2.4.2. Products
- 11.2.4.3. SWOT Analysis
- 11.2.4.4. Recent Developments
- 11.2.4.5. Financials (Based on Availability)
- 11.2.5 PhonePay
- 11.2.5.1. Overview
- 11.2.5.2. Products
- 11.2.5.3. SWOT Analysis
- 11.2.5.4. Recent Developments
- 11.2.5.5. Financials (Based on Availability)
- 11.2.6 GooglePay
- 11.2.6.1. Overview
- 11.2.6.2. Products
- 11.2.6.3. SWOT Analysis
- 11.2.6.4. Recent Developments
- 11.2.6.5. Financials (Based on Availability)
- 11.2.7 RazorPay
- 11.2.7.1. Overview
- 11.2.7.2. Products
- 11.2.7.3. SWOT Analysis
- 11.2.7.4. Recent Developments
- 11.2.7.5. Financials (Based on Availability)
- 11.2.8 AsiaPay
- 11.2.8.1. Overview
- 11.2.8.2. Products
- 11.2.8.3. SWOT Analysis
- 11.2.8.4. Recent Developments
- 11.2.8.5. Financials (Based on Availability)
- 11.2.9 2Checkout com Inc
- 11.2.9.1. Overview
- 11.2.9.2. Products
- 11.2.9.3. SWOT Analysis
- 11.2.9.4. Recent Developments
- 11.2.9.5. Financials (Based on Availability)
- 11.2.10 Eway*List Not Exhaustive
- 11.2.10.1. Overview
- 11.2.10.2. Products
- 11.2.10.3. SWOT Analysis
- 11.2.10.4. Recent Developments
- 11.2.10.5. Financials (Based on Availability)
- 11.2.1 PayPal
List of Figures
- Figure 1: Global APAC Payment Gateway Market Revenue Breakdown (Million, %) by Region 2024 & 2032
- Figure 2: Global APAC Payment Gateway Market Volume Breakdown (Billion, %) by Region 2024 & 2032
- Figure 3: North America APAC Payment Gateway Market Revenue (Million), by Type 2024 & 2032
- Figure 4: North America APAC Payment Gateway Market Volume (Billion), by Type 2024 & 2032
- Figure 5: North America APAC Payment Gateway Market Revenue Share (%), by Type 2024 & 2032
- Figure 6: North America APAC Payment Gateway Market Volume Share (%), by Type 2024 & 2032
- Figure 7: North America APAC Payment Gateway Market Revenue (Million), by Enterprise 2024 & 2032
- Figure 8: North America APAC Payment Gateway Market Volume (Billion), by Enterprise 2024 & 2032
- Figure 9: North America APAC Payment Gateway Market Revenue Share (%), by Enterprise 2024 & 2032
- Figure 10: North America APAC Payment Gateway Market Volume Share (%), by Enterprise 2024 & 2032
- Figure 11: North America APAC Payment Gateway Market Revenue (Million), by End User 2024 & 2032
- Figure 12: North America APAC Payment Gateway Market Volume (Billion), by End User 2024 & 2032
- Figure 13: North America APAC Payment Gateway Market Revenue Share (%), by End User 2024 & 2032
- Figure 14: North America APAC Payment Gateway Market Volume Share (%), by End User 2024 & 2032
- Figure 15: North America APAC Payment Gateway Market Revenue (Million), by Country 2024 & 2032
- Figure 16: North America APAC Payment Gateway Market Volume (Billion), by Country 2024 & 2032
- Figure 17: North America APAC Payment Gateway Market Revenue Share (%), by Country 2024 & 2032
- Figure 18: North America APAC Payment Gateway Market Volume Share (%), by Country 2024 & 2032
- Figure 19: South America APAC Payment Gateway Market Revenue (Million), by Type 2024 & 2032
- Figure 20: South America APAC Payment Gateway Market Volume (Billion), by Type 2024 & 2032
- Figure 21: South America APAC Payment Gateway Market Revenue Share (%), by Type 2024 & 2032
- Figure 22: South America APAC Payment Gateway Market Volume Share (%), by Type 2024 & 2032
- Figure 23: South America APAC Payment Gateway Market Revenue (Million), by Enterprise 2024 & 2032
- Figure 24: South America APAC Payment Gateway Market Volume (Billion), by Enterprise 2024 & 2032
- Figure 25: South America APAC Payment Gateway Market Revenue Share (%), by Enterprise 2024 & 2032
- Figure 26: South America APAC Payment Gateway Market Volume Share (%), by Enterprise 2024 & 2032
- Figure 27: South America APAC Payment Gateway Market Revenue (Million), by End User 2024 & 2032
- Figure 28: South America APAC Payment Gateway Market Volume (Billion), by End User 2024 & 2032
- Figure 29: South America APAC Payment Gateway Market Revenue Share (%), by End User 2024 & 2032
- Figure 30: South America APAC Payment Gateway Market Volume Share (%), by End User 2024 & 2032
- Figure 31: South America APAC Payment Gateway Market Revenue (Million), by Country 2024 & 2032
- Figure 32: South America APAC Payment Gateway Market Volume (Billion), by Country 2024 & 2032
- Figure 33: South America APAC Payment Gateway Market Revenue Share (%), by Country 2024 & 2032
- Figure 34: South America APAC Payment Gateway Market Volume Share (%), by Country 2024 & 2032
- Figure 35: Europe APAC Payment Gateway Market Revenue (Million), by Type 2024 & 2032
- Figure 36: Europe APAC Payment Gateway Market Volume (Billion), by Type 2024 & 2032
- Figure 37: Europe APAC Payment Gateway Market Revenue Share (%), by Type 2024 & 2032
- Figure 38: Europe APAC Payment Gateway Market Volume Share (%), by Type 2024 & 2032
- Figure 39: Europe APAC Payment Gateway Market Revenue (Million), by Enterprise 2024 & 2032
- Figure 40: Europe APAC Payment Gateway Market Volume (Billion), by Enterprise 2024 & 2032
- Figure 41: Europe APAC Payment Gateway Market Revenue Share (%), by Enterprise 2024 & 2032
- Figure 42: Europe APAC Payment Gateway Market Volume Share (%), by Enterprise 2024 & 2032
- Figure 43: Europe APAC Payment Gateway Market Revenue (Million), by End User 2024 & 2032
- Figure 44: Europe APAC Payment Gateway Market Volume (Billion), by End User 2024 & 2032
- Figure 45: Europe APAC Payment Gateway Market Revenue Share (%), by End User 2024 & 2032
- Figure 46: Europe APAC Payment Gateway Market Volume Share (%), by End User 2024 & 2032
- Figure 47: Europe APAC Payment Gateway Market Revenue (Million), by Country 2024 & 2032
- Figure 48: Europe APAC Payment Gateway Market Volume (Billion), by Country 2024 & 2032
- Figure 49: Europe APAC Payment Gateway Market Revenue Share (%), by Country 2024 & 2032
- Figure 50: Europe APAC Payment Gateway Market Volume Share (%), by Country 2024 & 2032
- Figure 51: Middle East & Africa APAC Payment Gateway Market Revenue (Million), by Type 2024 & 2032
- Figure 52: Middle East & Africa APAC Payment Gateway Market Volume (Billion), by Type 2024 & 2032
- Figure 53: Middle East & Africa APAC Payment Gateway Market Revenue Share (%), by Type 2024 & 2032
- Figure 54: Middle East & Africa APAC Payment Gateway Market Volume Share (%), by Type 2024 & 2032
- Figure 55: Middle East & Africa APAC Payment Gateway Market Revenue (Million), by Enterprise 2024 & 2032
- Figure 56: Middle East & Africa APAC Payment Gateway Market Volume (Billion), by Enterprise 2024 & 2032
- Figure 57: Middle East & Africa APAC Payment Gateway Market Revenue Share (%), by Enterprise 2024 & 2032
- Figure 58: Middle East & Africa APAC Payment Gateway Market Volume Share (%), by Enterprise 2024 & 2032
- Figure 59: Middle East & Africa APAC Payment Gateway Market Revenue (Million), by End User 2024 & 2032
- Figure 60: Middle East & Africa APAC Payment Gateway Market Volume (Billion), by End User 2024 & 2032
- Figure 61: Middle East & Africa APAC Payment Gateway Market Revenue Share (%), by End User 2024 & 2032
- Figure 62: Middle East & Africa APAC Payment Gateway Market Volume Share (%), by End User 2024 & 2032
- Figure 63: Middle East & Africa APAC Payment Gateway Market Revenue (Million), by Country 2024 & 2032
- Figure 64: Middle East & Africa APAC Payment Gateway Market Volume (Billion), by Country 2024 & 2032
- Figure 65: Middle East & Africa APAC Payment Gateway Market Revenue Share (%), by Country 2024 & 2032
- Figure 66: Middle East & Africa APAC Payment Gateway Market Volume Share (%), by Country 2024 & 2032
- Figure 67: Asia Pacific APAC Payment Gateway Market Revenue (Million), by Type 2024 & 2032
- Figure 68: Asia Pacific APAC Payment Gateway Market Volume (Billion), by Type 2024 & 2032
- Figure 69: Asia Pacific APAC Payment Gateway Market Revenue Share (%), by Type 2024 & 2032
- Figure 70: Asia Pacific APAC Payment Gateway Market Volume Share (%), by Type 2024 & 2032
- Figure 71: Asia Pacific APAC Payment Gateway Market Revenue (Million), by Enterprise 2024 & 2032
- Figure 72: Asia Pacific APAC Payment Gateway Market Volume (Billion), by Enterprise 2024 & 2032
- Figure 73: Asia Pacific APAC Payment Gateway Market Revenue Share (%), by Enterprise 2024 & 2032
- Figure 74: Asia Pacific APAC Payment Gateway Market Volume Share (%), by Enterprise 2024 & 2032
- Figure 75: Asia Pacific APAC Payment Gateway Market Revenue (Million), by End User 2024 & 2032
- Figure 76: Asia Pacific APAC Payment Gateway Market Volume (Billion), by End User 2024 & 2032
- Figure 77: Asia Pacific APAC Payment Gateway Market Revenue Share (%), by End User 2024 & 2032
- Figure 78: Asia Pacific APAC Payment Gateway Market Volume Share (%), by End User 2024 & 2032
- Figure 79: Asia Pacific APAC Payment Gateway Market Revenue (Million), by Country 2024 & 2032
- Figure 80: Asia Pacific APAC Payment Gateway Market Volume (Billion), by Country 2024 & 2032
- Figure 81: Asia Pacific APAC Payment Gateway Market Revenue Share (%), by Country 2024 & 2032
- Figure 82: Asia Pacific APAC Payment Gateway Market Volume Share (%), by Country 2024 & 2032
List of Tables
- Table 1: Global APAC Payment Gateway Market Revenue Million Forecast, by Region 2019 & 2032
- Table 2: Global APAC Payment Gateway Market Volume Billion Forecast, by Region 2019 & 2032
- Table 3: Global APAC Payment Gateway Market Revenue Million Forecast, by Type 2019 & 2032
- Table 4: Global APAC Payment Gateway Market Volume Billion Forecast, by Type 2019 & 2032
- Table 5: Global APAC Payment Gateway Market Revenue Million Forecast, by Enterprise 2019 & 2032
- Table 6: Global APAC Payment Gateway Market Volume Billion Forecast, by Enterprise 2019 & 2032
- Table 7: Global APAC Payment Gateway Market Revenue Million Forecast, by End User 2019 & 2032
- Table 8: Global APAC Payment Gateway Market Volume Billion Forecast, by End User 2019 & 2032
- Table 9: Global APAC Payment Gateway Market Revenue Million Forecast, by Region 2019 & 2032
- Table 10: Global APAC Payment Gateway Market Volume Billion Forecast, by Region 2019 & 2032
- Table 11: Global APAC Payment Gateway Market Revenue Million Forecast, by Type 2019 & 2032
- Table 12: Global APAC Payment Gateway Market Volume Billion Forecast, by Type 2019 & 2032
- Table 13: Global APAC Payment Gateway Market Revenue Million Forecast, by Enterprise 2019 & 2032
- Table 14: Global APAC Payment Gateway Market Volume Billion Forecast, by Enterprise 2019 & 2032
- Table 15: Global APAC Payment Gateway Market Revenue Million Forecast, by End User 2019 & 2032
- Table 16: Global APAC Payment Gateway Market Volume Billion Forecast, by End User 2019 & 2032
- Table 17: Global APAC Payment Gateway Market Revenue Million Forecast, by Country 2019 & 2032
- Table 18: Global APAC Payment Gateway Market Volume Billion Forecast, by Country 2019 & 2032
- Table 19: United States APAC Payment Gateway Market Revenue (Million) Forecast, by Application 2019 & 2032
- Table 20: United States APAC Payment Gateway Market Volume (Billion) Forecast, by Application 2019 & 2032
- Table 21: Canada APAC Payment Gateway Market Revenue (Million) Forecast, by Application 2019 & 2032
- Table 22: Canada APAC Payment Gateway Market Volume (Billion) Forecast, by Application 2019 & 2032
- Table 23: Mexico APAC Payment Gateway Market Revenue (Million) Forecast, by Application 2019 & 2032
- Table 24: Mexico APAC Payment Gateway Market Volume (Billion) Forecast, by Application 2019 & 2032
- Table 25: Global APAC Payment Gateway Market Revenue Million Forecast, by Type 2019 & 2032
- Table 26: Global APAC Payment Gateway Market Volume Billion Forecast, by Type 2019 & 2032
- Table 27: Global APAC Payment Gateway Market Revenue Million Forecast, by Enterprise 2019 & 2032
- Table 28: Global APAC Payment Gateway Market Volume Billion Forecast, by Enterprise 2019 & 2032
- Table 29: Global APAC Payment Gateway Market Revenue Million Forecast, by End User 2019 & 2032
- Table 30: Global APAC Payment Gateway Market Volume Billion Forecast, by End User 2019 & 2032
- Table 31: Global APAC Payment Gateway Market Revenue Million Forecast, by Country 2019 & 2032
- Table 32: Global APAC Payment Gateway Market Volume Billion Forecast, by Country 2019 & 2032
- Table 33: Brazil APAC Payment Gateway Market Revenue (Million) Forecast, by Application 2019 & 2032
- Table 34: Brazil APAC Payment Gateway Market Volume (Billion) Forecast, by Application 2019 & 2032
- Table 35: Argentina APAC Payment Gateway Market Revenue (Million) Forecast, by Application 2019 & 2032
- Table 36: Argentina APAC Payment Gateway Market Volume (Billion) Forecast, by Application 2019 & 2032
- Table 37: Rest of South America APAC Payment Gateway Market Revenue (Million) Forecast, by Application 2019 & 2032
- Table 38: Rest of South America APAC Payment Gateway Market Volume (Billion) Forecast, by Application 2019 & 2032
- Table 39: Global APAC Payment Gateway Market Revenue Million Forecast, by Type 2019 & 2032
- Table 40: Global APAC Payment Gateway Market Volume Billion Forecast, by Type 2019 & 2032
- Table 41: Global APAC Payment Gateway Market Revenue Million Forecast, by Enterprise 2019 & 2032
- Table 42: Global APAC Payment Gateway Market Volume Billion Forecast, by Enterprise 2019 & 2032
- Table 43: Global APAC Payment Gateway Market Revenue Million Forecast, by End User 2019 & 2032
- Table 44: Global APAC Payment Gateway Market Volume Billion Forecast, by End User 2019 & 2032
- Table 45: Global APAC Payment Gateway Market Revenue Million Forecast, by Country 2019 & 2032
- Table 46: Global APAC Payment Gateway Market Volume Billion Forecast, by Country 2019 & 2032
- Table 47: United Kingdom APAC Payment Gateway Market Revenue (Million) Forecast, by Application 2019 & 2032
- Table 48: United Kingdom APAC Payment Gateway Market Volume (Billion) Forecast, by Application 2019 & 2032
- Table 49: Germany APAC Payment Gateway Market Revenue (Million) Forecast, by Application 2019 & 2032
- Table 50: Germany APAC Payment Gateway Market Volume (Billion) Forecast, by Application 2019 & 2032
- Table 51: France APAC Payment Gateway Market Revenue (Million) Forecast, by Application 2019 & 2032
- Table 52: France APAC Payment Gateway Market Volume (Billion) Forecast, by Application 2019 & 2032
- Table 53: Italy APAC Payment Gateway Market Revenue (Million) Forecast, by Application 2019 & 2032
- Table 54: Italy APAC Payment Gateway Market Volume (Billion) Forecast, by Application 2019 & 2032
- Table 55: Spain APAC Payment Gateway Market Revenue (Million) Forecast, by Application 2019 & 2032
- Table 56: Spain APAC Payment Gateway Market Volume (Billion) Forecast, by Application 2019 & 2032
- Table 57: Russia APAC Payment Gateway Market Revenue (Million) Forecast, by Application 2019 & 2032
- Table 58: Russia APAC Payment Gateway Market Volume (Billion) Forecast, by Application 2019 & 2032
- Table 59: Benelux APAC Payment Gateway Market Revenue (Million) Forecast, by Application 2019 & 2032
- Table 60: Benelux APAC Payment Gateway Market Volume (Billion) Forecast, by Application 2019 & 2032
- Table 61: Nordics APAC Payment Gateway Market Revenue (Million) Forecast, by Application 2019 & 2032
- Table 62: Nordics APAC Payment Gateway Market Volume (Billion) Forecast, by Application 2019 & 2032
- Table 63: Rest of Europe APAC Payment Gateway Market Revenue (Million) Forecast, by Application 2019 & 2032
- Table 64: Rest of Europe APAC Payment Gateway Market Volume (Billion) Forecast, by Application 2019 & 2032
- Table 65: Global APAC Payment Gateway Market Revenue Million Forecast, by Type 2019 & 2032
- Table 66: Global APAC Payment Gateway Market Volume Billion Forecast, by Type 2019 & 2032
- Table 67: Global APAC Payment Gateway Market Revenue Million Forecast, by Enterprise 2019 & 2032
- Table 68: Global APAC Payment Gateway Market Volume Billion Forecast, by Enterprise 2019 & 2032
- Table 69: Global APAC Payment Gateway Market Revenue Million Forecast, by End User 2019 & 2032
- Table 70: Global APAC Payment Gateway Market Volume Billion Forecast, by End User 2019 & 2032
- Table 71: Global APAC Payment Gateway Market Revenue Million Forecast, by Country 2019 & 2032
- Table 72: Global APAC Payment Gateway Market Volume Billion Forecast, by Country 2019 & 2032
- Table 73: Turkey APAC Payment Gateway Market Revenue (Million) Forecast, by Application 2019 & 2032
- Table 74: Turkey APAC Payment Gateway Market Volume (Billion) Forecast, by Application 2019 & 2032
- Table 75: Israel APAC Payment Gateway Market Revenue (Million) Forecast, by Application 2019 & 2032
- Table 76: Israel APAC Payment Gateway Market Volume (Billion) Forecast, by Application 2019 & 2032
- Table 77: GCC APAC Payment Gateway Market Revenue (Million) Forecast, by Application 2019 & 2032
- Table 78: GCC APAC Payment Gateway Market Volume (Billion) Forecast, by Application 2019 & 2032
- Table 79: North Africa APAC Payment Gateway Market Revenue (Million) Forecast, by Application 2019 & 2032
- Table 80: North Africa APAC Payment Gateway Market Volume (Billion) Forecast, by Application 2019 & 2032
- Table 81: South Africa APAC Payment Gateway Market Revenue (Million) Forecast, by Application 2019 & 2032
- Table 82: South Africa APAC Payment Gateway Market Volume (Billion) Forecast, by Application 2019 & 2032
- Table 83: Rest of Middle East & Africa APAC Payment Gateway Market Revenue (Million) Forecast, by Application 2019 & 2032
- Table 84: Rest of Middle East & Africa APAC Payment Gateway Market Volume (Billion) Forecast, by Application 2019 & 2032
- Table 85: Global APAC Payment Gateway Market Revenue Million Forecast, by Type 2019 & 2032
- Table 86: Global APAC Payment Gateway Market Volume Billion Forecast, by Type 2019 & 2032
- Table 87: Global APAC Payment Gateway Market Revenue Million Forecast, by Enterprise 2019 & 2032
- Table 88: Global APAC Payment Gateway Market Volume Billion Forecast, by Enterprise 2019 & 2032
- Table 89: Global APAC Payment Gateway Market Revenue Million Forecast, by End User 2019 & 2032
- Table 90: Global APAC Payment Gateway Market Volume Billion Forecast, by End User 2019 & 2032
- Table 91: Global APAC Payment Gateway Market Revenue Million Forecast, by Country 2019 & 2032
- Table 92: Global APAC Payment Gateway Market Volume Billion Forecast, by Country 2019 & 2032
- Table 93: China APAC Payment Gateway Market Revenue (Million) Forecast, by Application 2019 & 2032
- Table 94: China APAC Payment Gateway Market Volume (Billion) Forecast, by Application 2019 & 2032
- Table 95: India APAC Payment Gateway Market Revenue (Million) Forecast, by Application 2019 & 2032
- Table 96: India APAC Payment Gateway Market Volume (Billion) Forecast, by Application 2019 & 2032
- Table 97: Japan APAC Payment Gateway Market Revenue (Million) Forecast, by Application 2019 & 2032
- Table 98: Japan APAC Payment Gateway Market Volume (Billion) Forecast, by Application 2019 & 2032
- Table 99: South Korea APAC Payment Gateway Market Revenue (Million) Forecast, by Application 2019 & 2032
- Table 100: South Korea APAC Payment Gateway Market Volume (Billion) Forecast, by Application 2019 & 2032
- Table 101: ASEAN APAC Payment Gateway Market Revenue (Million) Forecast, by Application 2019 & 2032
- Table 102: ASEAN APAC Payment Gateway Market Volume (Billion) Forecast, by Application 2019 & 2032
- Table 103: Oceania APAC Payment Gateway Market Revenue (Million) Forecast, by Application 2019 & 2032
- Table 104: Oceania APAC Payment Gateway Market Volume (Billion) Forecast, by Application 2019 & 2032
- Table 105: Rest of Asia Pacific APAC Payment Gateway Market Revenue (Million) Forecast, by Application 2019 & 2032
- Table 106: Rest of Asia Pacific APAC Payment Gateway Market Volume (Billion) Forecast, by Application 2019 & 2032
Frequently Asked Questions
1. What is the projected Compound Annual Growth Rate (CAGR) of the APAC Payment Gateway Market?
The projected CAGR is approximately 21.89%.
2. Which companies are prominent players in the APAC Payment Gateway Market?
Key companies in the market include PayPal, Stripe, MasterCard, Amazon Pay, PhonePay, GooglePay, RazorPay, AsiaPay, 2Checkout com Inc, Eway*List Not Exhaustive.
3. What are the main segments of the APAC Payment Gateway Market?
The market segments include Type, Enterprise, End User.
4. Can you provide details about the market size?
The market size is estimated to be USD 10.67 Million as of 2022.
5. What are some drivers contributing to market growth?
Increased E-commerce Sales and High Internet Penetration Rate; Increased Demand for Mobile-based Payments; Growing Adoption of Payment Gateways in Retail.
6. What are the notable trends driving market growth?
Growing Use of Payment Gateway in Tavel Industry..
7. Are there any restraints impacting market growth?
Increased E-commerce Sales and High Internet Penetration Rate; Increased Demand for Mobile-based Payments; Growing Adoption of Payment Gateways in Retail.
8. Can you provide examples of recent developments in the market?
May 2024: Mastercard officially rolled out its domestic payment processing services in China. Through its joint venture, Mastercard NetsUnion Information Technology, the company can now process payments made with Mastercard cards issued by Chinese banks. The payment services provider can also accept Mastercard-branded cards from China for international transactions.April 2024: Soft Space, a fintech-as-a-service provider, teamed up with JCB, a prominent international payments brand from Japan, to introduce a payment gateway in Malaysia. The new gateway addresses the surging demand for secure digital transactions by leveraging JCB's expansive global network and Soft Space's advanced technical expertise. Furthermore, Soft Space's API specification empowers acquirers and payment facilitators, enabling retail merchants to tap into JCB's vast network serving over 156 million card members—without needing a direct connection.
9. What pricing options are available for accessing the report?
Pricing options include single-user, multi-user, and enterprise licenses priced at USD 3800, USD 4500, and USD 5800 respectively.
10. Is the market size provided in terms of value or volume?
The market size is provided in terms of value, measured in Million and volume, measured in Billion.
11. Are there any specific market keywords associated with the report?
Yes, the market keyword associated with the report is "APAC Payment Gateway Market," which aids in identifying and referencing the specific market segment covered.
12. How do I determine which pricing option suits my needs best?
The pricing options vary based on user requirements and access needs. Individual users may opt for single-user licenses, while businesses requiring broader access may choose multi-user or enterprise licenses for cost-effective access to the report.
13. Are there any additional resources or data provided in the APAC Payment Gateway Market report?
While the report offers comprehensive insights, it's advisable to review the specific contents or supplementary materials provided to ascertain if additional resources or data are available.
14. How can I stay updated on further developments or reports in the APAC Payment Gateway Market?
To stay informed about further developments, trends, and reports in the APAC Payment Gateway Market, consider subscribing to industry newsletters, following relevant companies and organizations, or regularly checking reputable industry news sources and publications.
Methodology
Step 1 - Identification of Relevant Samples Size from Population Database


Step 2 - Approaches for Defining Global Market Size (Value, Volume* & Price*)

Note*: In applicable scenarios
Step 3 - Data Sources
Primary Research
- Web Analytics
- Survey Reports
- Research Institute
- Latest Research Reports
- Opinion Leaders
Secondary Research
- Annual Reports
- White Paper
- Latest Press Release
- Industry Association
- Paid Database
- Investor Presentations

Step 4 - Data Triangulation
Involves using different sources of information in order to increase the validity of a study
These sources are likely to be stakeholders in a program - participants, other researchers, program staff, other community members, and so on.
Then we put all data in single framework & apply various statistical tools to find out the dynamic on the market.
During the analysis stage, feedback from the stakeholder groups would be compared to determine areas of agreement as well as areas of divergence
