

Key Insights
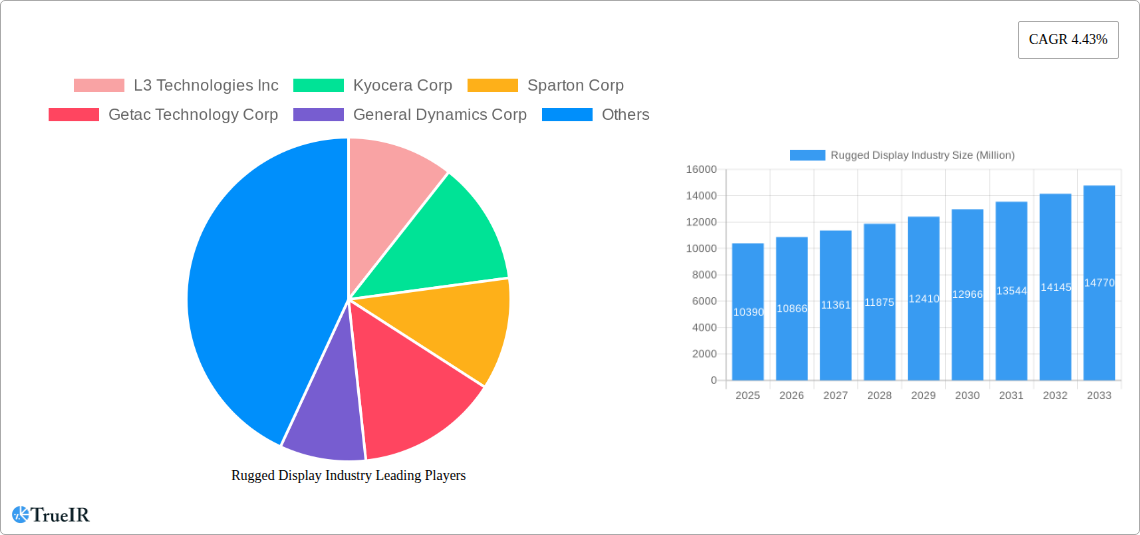
The rugged display market, valued at $10.39 billion in 2025, is projected to experience robust growth, driven by increasing demand across diverse sectors. A compound annual growth rate (CAGR) of 4.43% from 2025 to 2033 indicates a significant expansion, reaching an estimated $15 billion by 2033. Key drivers include the rising adoption of ruggedized devices in demanding environments like oil and gas exploration, military operations, and industrial automation. The growth is further fueled by advancements in display technology, offering higher resolution, improved brightness, and enhanced durability. Growing investments in infrastructure projects, particularly in developing economies, also contribute to this market expansion. Segment-wise, the fully rugged segment is expected to dominate due to its superior protection against harsh conditions. Within product types, the demand for smartphone and handheld computers is high, followed by tablet PCs and laptops. Android operating systems currently hold a significant market share, but the competition from Windows and other operating systems is expected to intensify. The North American market currently holds a leading position, driven by strong adoption across various end-user industries, but the Asia-Pacific region is poised for rapid growth due to increasing industrialization and infrastructure development. Competition is fierce, with major players like L3 Technologies, Kyocera, and Getac vying for market dominance through innovation and strategic partnerships.
The market's growth trajectory is influenced by several factors. Technological advancements, such as the integration of advanced features like improved touch sensitivity, wider viewing angles, and enhanced sunlight readability, are enhancing the appeal of rugged displays. However, high initial investment costs and the complexity of integrating rugged displays into existing systems present challenges. Government regulations regarding safety and durability standards also play a role, influencing manufacturers' design and production processes. Future growth hinges on continuous technological innovation, the development of cost-effective solutions, and the successful penetration of emerging markets. The focus on energy efficiency and lightweight designs will also be critical for market expansion in the coming years.
Rugged Display Industry Market Report: 2019-2033
This comprehensive report provides a detailed analysis of the Rugged Display Industry, offering invaluable insights for stakeholders seeking to understand market dynamics, competitive landscapes, and future growth prospects. The study period spans from 2019 to 2033, with a base year of 2025 and a forecast period of 2025-2033. The report incorporates a historical analysis from 2019-2024 and leverages a robust methodology to predict future market trends. The total market size is estimated at $XX Million in 2025. The report is designed for executives, investors, and industry professionals seeking data-driven strategies in this rapidly evolving sector.
Rugged Display Industry Market Structure & Competitive Landscape
The rugged display market is characterized by a moderately concentrated structure, with several key players holding significant market share. The Herfindahl-Hirschman Index (HHI) is estimated at xx, indicating a moderately competitive landscape. Innovation is a key driver, with companies continuously developing more robust, energy-efficient, and feature-rich displays. Regulatory compliance, particularly regarding safety and environmental standards (e.g., RoHS), impacts product design and manufacturing. Product substitutes, such as traditional displays with protective casings, exist but often lack the durability and functionality of purpose-built rugged displays.
End-User Segmentation: The market is diversified across various end-user segments, with the government and defense sectors showing significant demand, driven by high security requirements and harsh operational environments. Industrial applications, including manufacturing and logistics, also contribute substantially to the market's growth. Other key segments include Oil and Gas, Automotive and Transportation, Healthcare, and other end-users.
Mergers & Acquisitions (M&A): The industry has witnessed a moderate level of M&A activity in the past five years, with approximately xx deals totaling $xx Million. These activities primarily focus on expanding product portfolios, acquiring specialized technologies, and enhancing market reach. Consolidation is expected to continue, driven by the need for economies of scale and access to new technologies.
Rugged Display Industry Market Trends & Opportunities
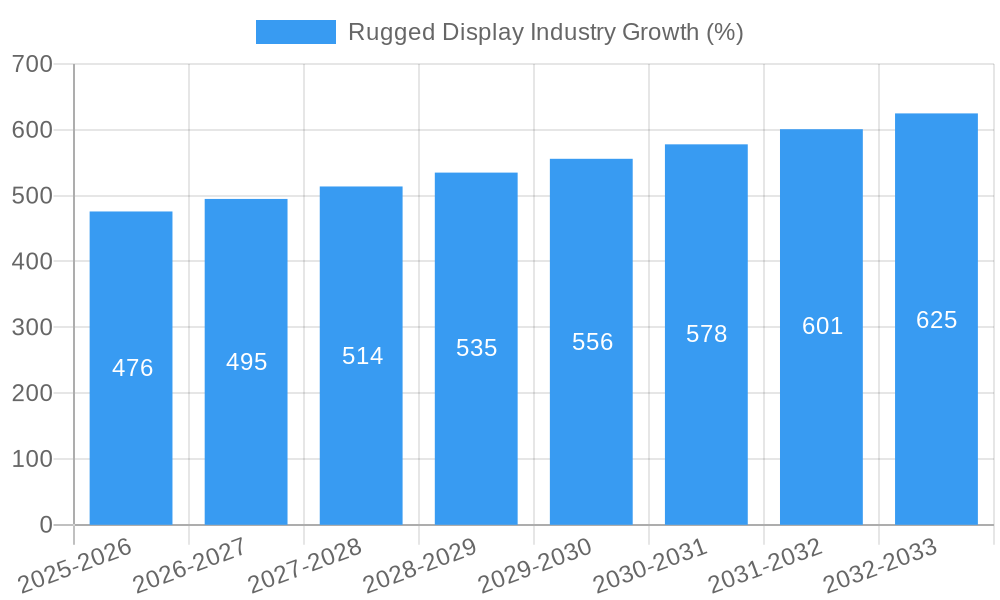
The rugged display market is projected to experience significant growth during the forecast period, driven by several factors including increasing demand from various end-user sectors and ongoing technological advancements. The Compound Annual Growth Rate (CAGR) is estimated at xx% between 2025 and 2033. Market penetration, particularly in emerging economies and niche applications (like wearables in industrial settings), is expected to increase substantially.
Technological advancements such as the adoption of mini-LED and micro-LED backlighting technologies, flexible displays, and improved touch screen functionalities are transforming the market landscape. Consumers are increasingly demanding higher resolution, better brightness, and wider viewing angles, especially in outdoor and extreme environments. Competitive dynamics involve ongoing innovation in product features, durability, and cost-effectiveness, necessitating continuous improvement from existing players. The increasing adoption of advanced displays in autonomous vehicles and robotics is driving a large share of market growth.
Dominant Markets & Segments in Rugged Display Industry
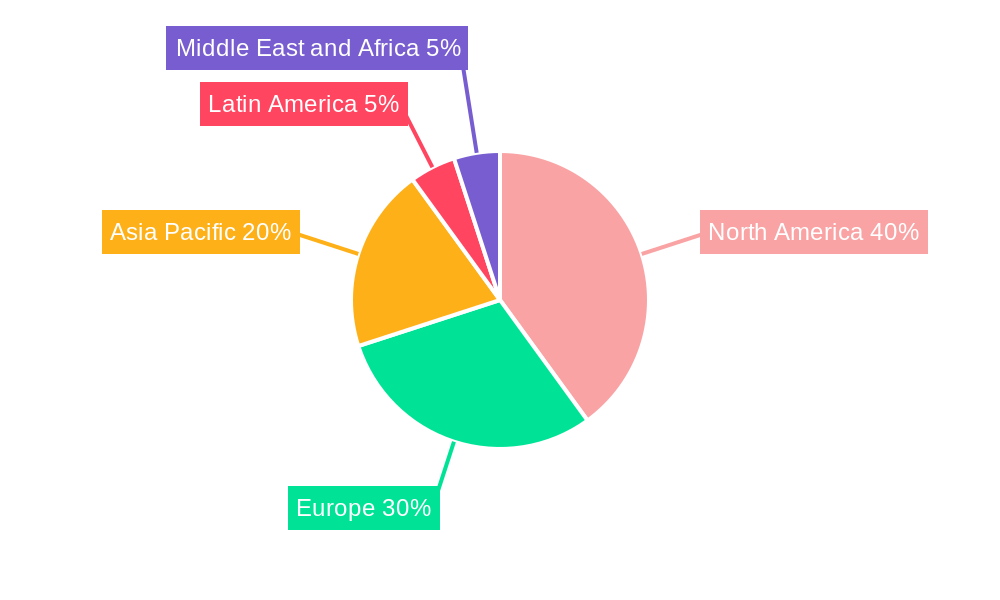
The North American market currently holds the largest share of the global rugged display market, followed by Europe and Asia-Pacific. Within these regions, the government & defense, and industrial sectors represent the most significant end-user segments, accounting for a combined xx% of total market revenue. The fully-rugged segment dominates within the 'Level of Ruggedness' category, reflecting the demand for extreme durability in various applications. Windows and Android are the most prevalent operating systems, though the demand for customized and specialized operating systems is also increasing.
Key Growth Drivers:
- Government & Defense Spending: Increased defense budgets and modernization programs are boosting demand for ruggedized displays in military vehicles, aircraft, and handheld devices.
- Industrial Automation: The rise of automation and smart factories is driving demand for rugged displays in industrial control systems and monitoring applications.
- Infrastructure Development: Large-scale infrastructure projects (e.g., transportation, energy) create substantial demand for durable, reliable displays used in construction, monitoring, and control systems.
- Technological Advancements: Continuous innovation in display technologies and form factors expands the applications of rugged displays.
Rugged Display Industry Product Analysis
The rugged display market offers a wide range of products, from handheld computers and smartphones to large-format panel PCs and vehicle-mounted displays. Technological advancements in areas like brightness, resolution, and power efficiency are driving product differentiation. The integration of advanced features such as augmented reality (AR) and improved connectivity is enhancing the functionality and appeal of these displays, particularly in specialized applications like mission-critical environments. The key competitive advantage lies in providing robust solutions tailored to specific end-user needs with a balance of performance, durability, and cost-effectiveness.
Key Drivers, Barriers & Challenges in Rugged Display Industry
Key Drivers: The market is propelled by increased demand across diverse sectors like defense, industrial automation, and transportation. Technological advancements including improved display technologies and miniaturization drive innovation. Favorable government policies supporting technology adoption contribute to growth.
Key Challenges: Supply chain disruptions, particularly concerning raw materials and components, impact production and pricing. Strict regulatory standards related to environmental concerns and safety requirements increase manufacturing costs. Intense competition and price pressure from less expensive non-rugged solutions pose a considerable challenge to market growth. These challenges are estimated to collectively restrain market growth by approximately xx% by 2033.
Growth Drivers in the Rugged Display Industry Market
Several factors are driving growth in the rugged display industry. Increased investments in defense modernization programs are boosting demand for high-performance displays. Advancements in technologies like mini-LED and micro-LED displays are providing superior image quality and lower power consumption. The expanding adoption of rugged displays in industrial automation and transportation sectors is also significant.
Challenges Impacting Rugged Display Industry Growth
Regulatory hurdles related to environmental compliance and safety standards increase manufacturing complexities and costs. Global supply chain vulnerabilities can lead to production delays and material shortages. The competitive pressure from alternative display solutions and the cost sensitivity of some end-user segments are significant challenges.
Key Players Shaping the Rugged Display Industry Market
- L3 Technologies Inc
- Kyocera Corp
- Sparton Corp
- Getac Technology Corp
- General Dynamics Corp
- Dell Inc
- Xplore Technologies Corp
- Beijer Electronics AB
- Zebra Technologies Corp
- Esterline Technologies Corp
- Curtiss-Wright Corp
- Panasonic Corporation
Significant Rugged Display Industry Industry Milestones
- 2020: Introduction of the first commercially available micro-LED rugged display by [Company Name].
- 2021: Acquisition of [Company A] by [Company B], expanding their product portfolio in ruggedized displays.
- 2022: Launch of a new generation of rugged tablets with enhanced processing power and battery life.
- 2023: Significant advancements in flexible display technology for increased durability.
- 2024: Introduction of new industry standards regarding environmental and safety regulations for rugged displays.
Future Outlook for Rugged Display Industry Market
The rugged display market is poised for continued growth, driven by technological innovation and increasing demand across diverse sectors. Strategic opportunities lie in developing specialized displays for niche applications and exploring new materials to enhance durability and performance. The market is expected to witness significant expansion in the forecast period, propelled by continuous advancements in display technologies and the growing adoption of rugged devices in various industries. The market size is predicted to reach $XX Million by 2033.
Rugged Display Industry Segmentation
-
1. Product Type
- 1.1. Smartphone and Handheld Computer
- 1.2. Tablet PC
- 1.3. Laptop and Notebook
- 1.4. Avionics Display
- 1.5. Vehicle-mounted Computer
- 1.6. Panel PC and Mission-critical Display
-
2. Level of Ruggedness
- 2.1. Semi-rugged
- 2.2. Fully-rugged
- 2.3. Ultra-rugged
-
3. Operating System
- 3.1. Android
- 3.2. Windows
- 3.3. Other Operating Systems
-
4. End User
- 4.1. Oil and Gas
- 4.2. Government, Defense, and Aerospace
- 4.3. Industrial
- 4.4. Automotive and Transportation
- 4.5. Healthcare
- 4.6. Other End Users
Rugged Display Industry Segmentation By Geography
- 1. North America
- 2. Europe
- 3. Asia Pacific
- 4. Latin America
- 5. Middle East and Africa
Rugged Display Industry REPORT HIGHLIGHTS
| Aspects | Details |
|---|---|
| Study Period | 2019-2033 |
| Base Year | 2024 |
| Estimated Year | 2025 |
| Forecast Period | 2025-2033 |
| Historical Period | 2019-2024 |
| Growth Rate | CAGR of 4.43% from 2019-2033 |
| Segmentation |
|
Table of Contents
- 1. Introduction
- 1.1. Research Scope
- 1.2. Market Segmentation
- 1.3. Research Methodology
- 1.4. Definitions and Assumptions
- 2. Executive Summary
- 2.1. Introduction
- 3. Market Dynamics
- 3.1. Introduction
- 3.2. Market Drivers
- 3.2.1. ; Reduced Total Cost of Ownership (TCO); Rising Demand for HMI and IoT in Various Industries
- 3.3. Market Restrains
- 3.3.1. ; Adoption of Consumer-grade Devices for Industrial Applications
- 3.4. Market Trends
- 3.4.1. Rugged Tablets are Expected to Hold Major Share
- 4. Market Factor Analysis
- 4.1. Porters Five Forces
- 4.2. Supply/Value Chain
- 4.3. PESTEL analysis
- 4.4. Market Entropy
- 4.5. Patent/Trademark Analysis
- 5. Global Rugged Display Industry Analysis, Insights and Forecast, 2019-2031
- 5.1. Market Analysis, Insights and Forecast - by Product Type
- 5.1.1. Smartphone and Handheld Computer
- 5.1.2. Tablet PC
- 5.1.3. Laptop and Notebook
- 5.1.4. Avionics Display
- 5.1.5. Vehicle-mounted Computer
- 5.1.6. Panel PC and Mission-critical Display
- 5.2. Market Analysis, Insights and Forecast - by Level of Ruggedness
- 5.2.1. Semi-rugged
- 5.2.2. Fully-rugged
- 5.2.3. Ultra-rugged
- 5.3. Market Analysis, Insights and Forecast - by Operating System
- 5.3.1. Android
- 5.3.2. Windows
- 5.3.3. Other Operating Systems
- 5.4. Market Analysis, Insights and Forecast - by End User
- 5.4.1. Oil and Gas
- 5.4.2. Government, Defense, and Aerospace
- 5.4.3. Industrial
- 5.4.4. Automotive and Transportation
- 5.4.5. Healthcare
- 5.4.6. Other End Users
- 5.5. Market Analysis, Insights and Forecast - by Region
- 5.5.1. North America
- 5.5.2. Europe
- 5.5.3. Asia Pacific
- 5.5.4. Latin America
- 5.5.5. Middle East and Africa
- 5.1. Market Analysis, Insights and Forecast - by Product Type
- 6. North America Rugged Display Industry Analysis, Insights and Forecast, 2019-2031
- 6.1. Market Analysis, Insights and Forecast - by Product Type
- 6.1.1. Smartphone and Handheld Computer
- 6.1.2. Tablet PC
- 6.1.3. Laptop and Notebook
- 6.1.4. Avionics Display
- 6.1.5. Vehicle-mounted Computer
- 6.1.6. Panel PC and Mission-critical Display
- 6.2. Market Analysis, Insights and Forecast - by Level of Ruggedness
- 6.2.1. Semi-rugged
- 6.2.2. Fully-rugged
- 6.2.3. Ultra-rugged
- 6.3. Market Analysis, Insights and Forecast - by Operating System
- 6.3.1. Android
- 6.3.2. Windows
- 6.3.3. Other Operating Systems
- 6.4. Market Analysis, Insights and Forecast - by End User
- 6.4.1. Oil and Gas
- 6.4.2. Government, Defense, and Aerospace
- 6.4.3. Industrial
- 6.4.4. Automotive and Transportation
- 6.4.5. Healthcare
- 6.4.6. Other End Users
- 6.1. Market Analysis, Insights and Forecast - by Product Type
- 7. Europe Rugged Display Industry Analysis, Insights and Forecast, 2019-2031
- 7.1. Market Analysis, Insights and Forecast - by Product Type
- 7.1.1. Smartphone and Handheld Computer
- 7.1.2. Tablet PC
- 7.1.3. Laptop and Notebook
- 7.1.4. Avionics Display
- 7.1.5. Vehicle-mounted Computer
- 7.1.6. Panel PC and Mission-critical Display
- 7.2. Market Analysis, Insights and Forecast - by Level of Ruggedness
- 7.2.1. Semi-rugged
- 7.2.2. Fully-rugged
- 7.2.3. Ultra-rugged
- 7.3. Market Analysis, Insights and Forecast - by Operating System
- 7.3.1. Android
- 7.3.2. Windows
- 7.3.3. Other Operating Systems
- 7.4. Market Analysis, Insights and Forecast - by End User
- 7.4.1. Oil and Gas
- 7.4.2. Government, Defense, and Aerospace
- 7.4.3. Industrial
- 7.4.4. Automotive and Transportation
- 7.4.5. Healthcare
- 7.4.6. Other End Users
- 7.1. Market Analysis, Insights and Forecast - by Product Type
- 8. Asia Pacific Rugged Display Industry Analysis, Insights and Forecast, 2019-2031
- 8.1. Market Analysis, Insights and Forecast - by Product Type
- 8.1.1. Smartphone and Handheld Computer
- 8.1.2. Tablet PC
- 8.1.3. Laptop and Notebook
- 8.1.4. Avionics Display
- 8.1.5. Vehicle-mounted Computer
- 8.1.6. Panel PC and Mission-critical Display
- 8.2. Market Analysis, Insights and Forecast - by Level of Ruggedness
- 8.2.1. Semi-rugged
- 8.2.2. Fully-rugged
- 8.2.3. Ultra-rugged
- 8.3. Market Analysis, Insights and Forecast - by Operating System
- 8.3.1. Android
- 8.3.2. Windows
- 8.3.3. Other Operating Systems
- 8.4. Market Analysis, Insights and Forecast - by End User
- 8.4.1. Oil and Gas
- 8.4.2. Government, Defense, and Aerospace
- 8.4.3. Industrial
- 8.4.4. Automotive and Transportation
- 8.4.5. Healthcare
- 8.4.6. Other End Users
- 8.1. Market Analysis, Insights and Forecast - by Product Type
- 9. Latin America Rugged Display Industry Analysis, Insights and Forecast, 2019-2031
- 9.1. Market Analysis, Insights and Forecast - by Product Type
- 9.1.1. Smartphone and Handheld Computer
- 9.1.2. Tablet PC
- 9.1.3. Laptop and Notebook
- 9.1.4. Avionics Display
- 9.1.5. Vehicle-mounted Computer
- 9.1.6. Panel PC and Mission-critical Display
- 9.2. Market Analysis, Insights and Forecast - by Level of Ruggedness
- 9.2.1. Semi-rugged
- 9.2.2. Fully-rugged
- 9.2.3. Ultra-rugged
- 9.3. Market Analysis, Insights and Forecast - by Operating System
- 9.3.1. Android
- 9.3.2. Windows
- 9.3.3. Other Operating Systems
- 9.4. Market Analysis, Insights and Forecast - by End User
- 9.4.1. Oil and Gas
- 9.4.2. Government, Defense, and Aerospace
- 9.4.3. Industrial
- 9.4.4. Automotive and Transportation
- 9.4.5. Healthcare
- 9.4.6. Other End Users
- 9.1. Market Analysis, Insights and Forecast - by Product Type
- 10. Middle East and Africa Rugged Display Industry Analysis, Insights and Forecast, 2019-2031
- 10.1. Market Analysis, Insights and Forecast - by Product Type
- 10.1.1. Smartphone and Handheld Computer
- 10.1.2. Tablet PC
- 10.1.3. Laptop and Notebook
- 10.1.4. Avionics Display
- 10.1.5. Vehicle-mounted Computer
- 10.1.6. Panel PC and Mission-critical Display
- 10.2. Market Analysis, Insights and Forecast - by Level of Ruggedness
- 10.2.1. Semi-rugged
- 10.2.2. Fully-rugged
- 10.2.3. Ultra-rugged
- 10.3. Market Analysis, Insights and Forecast - by Operating System
- 10.3.1. Android
- 10.3.2. Windows
- 10.3.3. Other Operating Systems
- 10.4. Market Analysis, Insights and Forecast - by End User
- 10.4.1. Oil and Gas
- 10.4.2. Government, Defense, and Aerospace
- 10.4.3. Industrial
- 10.4.4. Automotive and Transportation
- 10.4.5. Healthcare
- 10.4.6. Other End Users
- 10.1. Market Analysis, Insights and Forecast - by Product Type
- 11. North America Rugged Display Industry Analysis, Insights and Forecast, 2019-2031
- 11.1. Market Analysis, Insights and Forecast - By Country/Sub-region
- 11.1.1.
- 12. Europe Rugged Display Industry Analysis, Insights and Forecast, 2019-2031
- 12.1. Market Analysis, Insights and Forecast - By Country/Sub-region
- 12.1.1.
- 13. Asia Pacific Rugged Display Industry Analysis, Insights and Forecast, 2019-2031
- 13.1. Market Analysis, Insights and Forecast - By Country/Sub-region
- 13.1.1.
- 14. Latin America Rugged Display Industry Analysis, Insights and Forecast, 2019-2031
- 14.1. Market Analysis, Insights and Forecast - By Country/Sub-region
- 14.1.1.
- 15. Middle East and Africa Rugged Display Industry Analysis, Insights and Forecast, 2019-2031
- 15.1. Market Analysis, Insights and Forecast - By Country/Sub-region
- 15.1.1.
- 16. Competitive Analysis
- 16.1. Global Market Share Analysis 2024
- 16.2. Company Profiles
- 16.2.1 L3 Technologies Inc
- 16.2.1.1. Overview
- 16.2.1.2. Products
- 16.2.1.3. SWOT Analysis
- 16.2.1.4. Recent Developments
- 16.2.1.5. Financials (Based on Availability)
- 16.2.2 Kyocera Corp
- 16.2.2.1. Overview
- 16.2.2.2. Products
- 16.2.2.3. SWOT Analysis
- 16.2.2.4. Recent Developments
- 16.2.2.5. Financials (Based on Availability)
- 16.2.3 Sparton Corp
- 16.2.3.1. Overview
- 16.2.3.2. Products
- 16.2.3.3. SWOT Analysis
- 16.2.3.4. Recent Developments
- 16.2.3.5. Financials (Based on Availability)
- 16.2.4 Getac Technology Corp
- 16.2.4.1. Overview
- 16.2.4.2. Products
- 16.2.4.3. SWOT Analysis
- 16.2.4.4. Recent Developments
- 16.2.4.5. Financials (Based on Availability)
- 16.2.5 General Dynamics Corp
- 16.2.5.1. Overview
- 16.2.5.2. Products
- 16.2.5.3. SWOT Analysis
- 16.2.5.4. Recent Developments
- 16.2.5.5. Financials (Based on Availability)
- 16.2.6 Dell Inc
- 16.2.6.1. Overview
- 16.2.6.2. Products
- 16.2.6.3. SWOT Analysis
- 16.2.6.4. Recent Developments
- 16.2.6.5. Financials (Based on Availability)
- 16.2.7 Xplore Technologies Corp
- 16.2.7.1. Overview
- 16.2.7.2. Products
- 16.2.7.3. SWOT Analysis
- 16.2.7.4. Recent Developments
- 16.2.7.5. Financials (Based on Availability)
- 16.2.8 Beijer Electronics AB
- 16.2.8.1. Overview
- 16.2.8.2. Products
- 16.2.8.3. SWOT Analysis
- 16.2.8.4. Recent Developments
- 16.2.8.5. Financials (Based on Availability)
- 16.2.9 Zebra Technologies Corp
- 16.2.9.1. Overview
- 16.2.9.2. Products
- 16.2.9.3. SWOT Analysis
- 16.2.9.4. Recent Developments
- 16.2.9.5. Financials (Based on Availability)
- 16.2.10 Esterline Technologies Corp
- 16.2.10.1. Overview
- 16.2.10.2. Products
- 16.2.10.3. SWOT Analysis
- 16.2.10.4. Recent Developments
- 16.2.10.5. Financials (Based on Availability)
- 16.2.11 Curtiss-Wright Corp
- 16.2.11.1. Overview
- 16.2.11.2. Products
- 16.2.11.3. SWOT Analysis
- 16.2.11.4. Recent Developments
- 16.2.11.5. Financials (Based on Availability)
- 16.2.12 Panasonic Corporation
- 16.2.12.1. Overview
- 16.2.12.2. Products
- 16.2.12.3. SWOT Analysis
- 16.2.12.4. Recent Developments
- 16.2.12.5. Financials (Based on Availability)
- 16.2.1 L3 Technologies Inc
List of Figures
- Figure 1: Global Rugged Display Industry Revenue Breakdown (Million, %) by Region 2024 & 2032
- Figure 2: North America Rugged Display Industry Revenue (Million), by Country 2024 & 2032
- Figure 3: North America Rugged Display Industry Revenue Share (%), by Country 2024 & 2032
- Figure 4: Europe Rugged Display Industry Revenue (Million), by Country 2024 & 2032
- Figure 5: Europe Rugged Display Industry Revenue Share (%), by Country 2024 & 2032
- Figure 6: Asia Pacific Rugged Display Industry Revenue (Million), by Country 2024 & 2032
- Figure 7: Asia Pacific Rugged Display Industry Revenue Share (%), by Country 2024 & 2032
- Figure 8: Latin America Rugged Display Industry Revenue (Million), by Country 2024 & 2032
- Figure 9: Latin America Rugged Display Industry Revenue Share (%), by Country 2024 & 2032
- Figure 10: Middle East and Africa Rugged Display Industry Revenue (Million), by Country 2024 & 2032
- Figure 11: Middle East and Africa Rugged Display Industry Revenue Share (%), by Country 2024 & 2032
- Figure 12: North America Rugged Display Industry Revenue (Million), by Product Type 2024 & 2032
- Figure 13: North America Rugged Display Industry Revenue Share (%), by Product Type 2024 & 2032
- Figure 14: North America Rugged Display Industry Revenue (Million), by Level of Ruggedness 2024 & 2032
- Figure 15: North America Rugged Display Industry Revenue Share (%), by Level of Ruggedness 2024 & 2032
- Figure 16: North America Rugged Display Industry Revenue (Million), by Operating System 2024 & 2032
- Figure 17: North America Rugged Display Industry Revenue Share (%), by Operating System 2024 & 2032
- Figure 18: North America Rugged Display Industry Revenue (Million), by End User 2024 & 2032
- Figure 19: North America Rugged Display Industry Revenue Share (%), by End User 2024 & 2032
- Figure 20: North America Rugged Display Industry Revenue (Million), by Country 2024 & 2032
- Figure 21: North America Rugged Display Industry Revenue Share (%), by Country 2024 & 2032
- Figure 22: Europe Rugged Display Industry Revenue (Million), by Product Type 2024 & 2032
- Figure 23: Europe Rugged Display Industry Revenue Share (%), by Product Type 2024 & 2032
- Figure 24: Europe Rugged Display Industry Revenue (Million), by Level of Ruggedness 2024 & 2032
- Figure 25: Europe Rugged Display Industry Revenue Share (%), by Level of Ruggedness 2024 & 2032
- Figure 26: Europe Rugged Display Industry Revenue (Million), by Operating System 2024 & 2032
- Figure 27: Europe Rugged Display Industry Revenue Share (%), by Operating System 2024 & 2032
- Figure 28: Europe Rugged Display Industry Revenue (Million), by End User 2024 & 2032
- Figure 29: Europe Rugged Display Industry Revenue Share (%), by End User 2024 & 2032
- Figure 30: Europe Rugged Display Industry Revenue (Million), by Country 2024 & 2032
- Figure 31: Europe Rugged Display Industry Revenue Share (%), by Country 2024 & 2032
- Figure 32: Asia Pacific Rugged Display Industry Revenue (Million), by Product Type 2024 & 2032
- Figure 33: Asia Pacific Rugged Display Industry Revenue Share (%), by Product Type 2024 & 2032
- Figure 34: Asia Pacific Rugged Display Industry Revenue (Million), by Level of Ruggedness 2024 & 2032
- Figure 35: Asia Pacific Rugged Display Industry Revenue Share (%), by Level of Ruggedness 2024 & 2032
- Figure 36: Asia Pacific Rugged Display Industry Revenue (Million), by Operating System 2024 & 2032
- Figure 37: Asia Pacific Rugged Display Industry Revenue Share (%), by Operating System 2024 & 2032
- Figure 38: Asia Pacific Rugged Display Industry Revenue (Million), by End User 2024 & 2032
- Figure 39: Asia Pacific Rugged Display Industry Revenue Share (%), by End User 2024 & 2032
- Figure 40: Asia Pacific Rugged Display Industry Revenue (Million), by Country 2024 & 2032
- Figure 41: Asia Pacific Rugged Display Industry Revenue Share (%), by Country 2024 & 2032
- Figure 42: Latin America Rugged Display Industry Revenue (Million), by Product Type 2024 & 2032
- Figure 43: Latin America Rugged Display Industry Revenue Share (%), by Product Type 2024 & 2032
- Figure 44: Latin America Rugged Display Industry Revenue (Million), by Level of Ruggedness 2024 & 2032
- Figure 45: Latin America Rugged Display Industry Revenue Share (%), by Level of Ruggedness 2024 & 2032
- Figure 46: Latin America Rugged Display Industry Revenue (Million), by Operating System 2024 & 2032
- Figure 47: Latin America Rugged Display Industry Revenue Share (%), by Operating System 2024 & 2032
- Figure 48: Latin America Rugged Display Industry Revenue (Million), by End User 2024 & 2032
- Figure 49: Latin America Rugged Display Industry Revenue Share (%), by End User 2024 & 2032
- Figure 50: Latin America Rugged Display Industry Revenue (Million), by Country 2024 & 2032
- Figure 51: Latin America Rugged Display Industry Revenue Share (%), by Country 2024 & 2032
- Figure 52: Middle East and Africa Rugged Display Industry Revenue (Million), by Product Type 2024 & 2032
- Figure 53: Middle East and Africa Rugged Display Industry Revenue Share (%), by Product Type 2024 & 2032
- Figure 54: Middle East and Africa Rugged Display Industry Revenue (Million), by Level of Ruggedness 2024 & 2032
- Figure 55: Middle East and Africa Rugged Display Industry Revenue Share (%), by Level of Ruggedness 2024 & 2032
- Figure 56: Middle East and Africa Rugged Display Industry Revenue (Million), by Operating System 2024 & 2032
- Figure 57: Middle East and Africa Rugged Display Industry Revenue Share (%), by Operating System 2024 & 2032
- Figure 58: Middle East and Africa Rugged Display Industry Revenue (Million), by End User 2024 & 2032
- Figure 59: Middle East and Africa Rugged Display Industry Revenue Share (%), by End User 2024 & 2032
- Figure 60: Middle East and Africa Rugged Display Industry Revenue (Million), by Country 2024 & 2032
- Figure 61: Middle East and Africa Rugged Display Industry Revenue Share (%), by Country 2024 & 2032
List of Tables
- Table 1: Global Rugged Display Industry Revenue Million Forecast, by Region 2019 & 2032
- Table 2: Global Rugged Display Industry Revenue Million Forecast, by Product Type 2019 & 2032
- Table 3: Global Rugged Display Industry Revenue Million Forecast, by Level of Ruggedness 2019 & 2032
- Table 4: Global Rugged Display Industry Revenue Million Forecast, by Operating System 2019 & 2032
- Table 5: Global Rugged Display Industry Revenue Million Forecast, by End User 2019 & 2032
- Table 6: Global Rugged Display Industry Revenue Million Forecast, by Region 2019 & 2032
- Table 7: Global Rugged Display Industry Revenue Million Forecast, by Country 2019 & 2032
- Table 8: Rugged Display Industry Revenue (Million) Forecast, by Application 2019 & 2032
- Table 9: Global Rugged Display Industry Revenue Million Forecast, by Country 2019 & 2032
- Table 10: Rugged Display Industry Revenue (Million) Forecast, by Application 2019 & 2032
- Table 11: Global Rugged Display Industry Revenue Million Forecast, by Country 2019 & 2032
- Table 12: Rugged Display Industry Revenue (Million) Forecast, by Application 2019 & 2032
- Table 13: Global Rugged Display Industry Revenue Million Forecast, by Country 2019 & 2032
- Table 14: Rugged Display Industry Revenue (Million) Forecast, by Application 2019 & 2032
- Table 15: Global Rugged Display Industry Revenue Million Forecast, by Country 2019 & 2032
- Table 16: Rugged Display Industry Revenue (Million) Forecast, by Application 2019 & 2032
- Table 17: Global Rugged Display Industry Revenue Million Forecast, by Product Type 2019 & 2032
- Table 18: Global Rugged Display Industry Revenue Million Forecast, by Level of Ruggedness 2019 & 2032
- Table 19: Global Rugged Display Industry Revenue Million Forecast, by Operating System 2019 & 2032
- Table 20: Global Rugged Display Industry Revenue Million Forecast, by End User 2019 & 2032
- Table 21: Global Rugged Display Industry Revenue Million Forecast, by Country 2019 & 2032
- Table 22: Global Rugged Display Industry Revenue Million Forecast, by Product Type 2019 & 2032
- Table 23: Global Rugged Display Industry Revenue Million Forecast, by Level of Ruggedness 2019 & 2032
- Table 24: Global Rugged Display Industry Revenue Million Forecast, by Operating System 2019 & 2032
- Table 25: Global Rugged Display Industry Revenue Million Forecast, by End User 2019 & 2032
- Table 26: Global Rugged Display Industry Revenue Million Forecast, by Country 2019 & 2032
- Table 27: Global Rugged Display Industry Revenue Million Forecast, by Product Type 2019 & 2032
- Table 28: Global Rugged Display Industry Revenue Million Forecast, by Level of Ruggedness 2019 & 2032
- Table 29: Global Rugged Display Industry Revenue Million Forecast, by Operating System 2019 & 2032
- Table 30: Global Rugged Display Industry Revenue Million Forecast, by End User 2019 & 2032
- Table 31: Global Rugged Display Industry Revenue Million Forecast, by Country 2019 & 2032
- Table 32: Global Rugged Display Industry Revenue Million Forecast, by Product Type 2019 & 2032
- Table 33: Global Rugged Display Industry Revenue Million Forecast, by Level of Ruggedness 2019 & 2032
- Table 34: Global Rugged Display Industry Revenue Million Forecast, by Operating System 2019 & 2032
- Table 35: Global Rugged Display Industry Revenue Million Forecast, by End User 2019 & 2032
- Table 36: Global Rugged Display Industry Revenue Million Forecast, by Country 2019 & 2032
- Table 37: Global Rugged Display Industry Revenue Million Forecast, by Product Type 2019 & 2032
- Table 38: Global Rugged Display Industry Revenue Million Forecast, by Level of Ruggedness 2019 & 2032
- Table 39: Global Rugged Display Industry Revenue Million Forecast, by Operating System 2019 & 2032
- Table 40: Global Rugged Display Industry Revenue Million Forecast, by End User 2019 & 2032
- Table 41: Global Rugged Display Industry Revenue Million Forecast, by Country 2019 & 2032
Frequently Asked Questions
1. What is the projected Compound Annual Growth Rate (CAGR) of the Rugged Display Industry?
The projected CAGR is approximately 4.43%.
2. Which companies are prominent players in the Rugged Display Industry?
Key companies in the market include L3 Technologies Inc, Kyocera Corp, Sparton Corp, Getac Technology Corp, General Dynamics Corp, Dell Inc, Xplore Technologies Corp, Beijer Electronics AB, Zebra Technologies Corp, Esterline Technologies Corp, Curtiss-Wright Corp, Panasonic Corporation.
3. What are the main segments of the Rugged Display Industry?
The market segments include Product Type, Level of Ruggedness, Operating System, End User.
4. Can you provide details about the market size?
The market size is estimated to be USD 10.39 Million as of 2022.
5. What are some drivers contributing to market growth?
; Reduced Total Cost of Ownership (TCO); Rising Demand for HMI and IoT in Various Industries.
6. What are the notable trends driving market growth?
Rugged Tablets are Expected to Hold Major Share.
7. Are there any restraints impacting market growth?
; Adoption of Consumer-grade Devices for Industrial Applications.
8. Can you provide examples of recent developments in the market?
N/A
9. What pricing options are available for accessing the report?
Pricing options include single-user, multi-user, and enterprise licenses priced at USD 4750, USD 5250, and USD 8750 respectively.
10. Is the market size provided in terms of value or volume?
The market size is provided in terms of value, measured in Million.
11. Are there any specific market keywords associated with the report?
Yes, the market keyword associated with the report is "Rugged Display Industry," which aids in identifying and referencing the specific market segment covered.
12. How do I determine which pricing option suits my needs best?
The pricing options vary based on user requirements and access needs. Individual users may opt for single-user licenses, while businesses requiring broader access may choose multi-user or enterprise licenses for cost-effective access to the report.
13. Are there any additional resources or data provided in the Rugged Display Industry report?
While the report offers comprehensive insights, it's advisable to review the specific contents or supplementary materials provided to ascertain if additional resources or data are available.
14. How can I stay updated on further developments or reports in the Rugged Display Industry?
To stay informed about further developments, trends, and reports in the Rugged Display Industry, consider subscribing to industry newsletters, following relevant companies and organizations, or regularly checking reputable industry news sources and publications.
Methodology
Step 1 - Identification of Relevant Samples Size from Population Database


Step 2 - Approaches for Defining Global Market Size (Value, Volume* & Price*)

Note*: In applicable scenarios
Step 3 - Data Sources
Primary Research
- Web Analytics
- Survey Reports
- Research Institute
- Latest Research Reports
- Opinion Leaders
Secondary Research
- Annual Reports
- White Paper
- Latest Press Release
- Industry Association
- Paid Database
- Investor Presentations

Step 4 - Data Triangulation
Involves using different sources of information in order to increase the validity of a study
These sources are likely to be stakeholders in a program - participants, other researchers, program staff, other community members, and so on.
Then we put all data in single framework & apply various statistical tools to find out the dynamic on the market.
During the analysis stage, feedback from the stakeholder groups would be compared to determine areas of agreement as well as areas of divergence
