

Key Insights
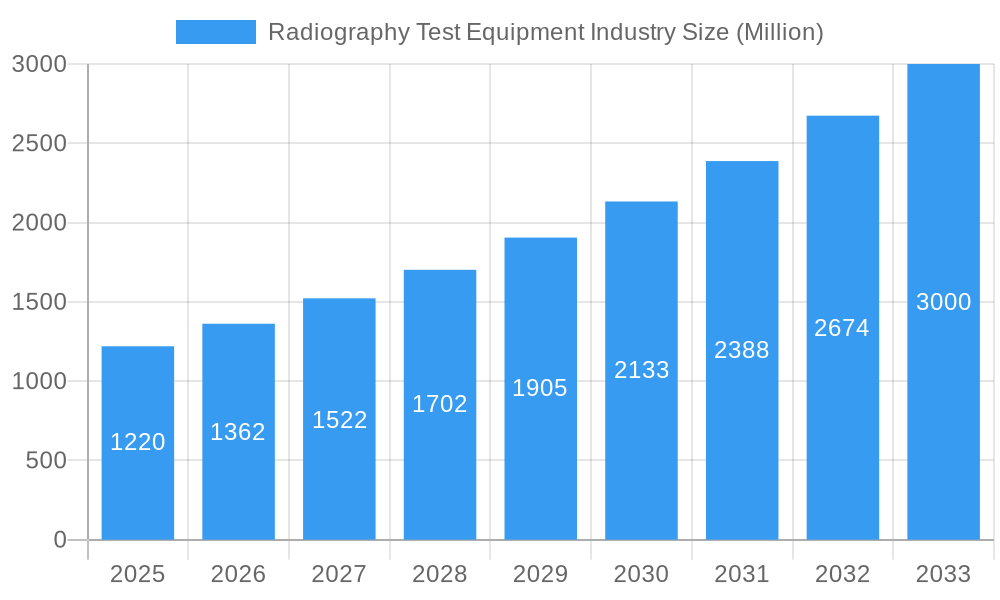
The global radiography test equipment market, valued at $1.22 billion in 2025, is projected to experience robust growth, driven by increasing demand across diverse end-user verticals. The market's Compound Annual Growth Rate (CAGR) of 11.75% from 2025 to 2033 signifies substantial expansion opportunities. Key drivers include the rising adoption of advanced imaging techniques like computed tomography (CT) and direct radiography (DR) in various industries such as aerospace and defense for non-destructive testing (NDT) and quality control. The automotive sector's growing emphasis on lightweight materials and advanced manufacturing processes further fuels demand for precise and efficient radiography equipment. Furthermore, stringent safety regulations and quality standards across numerous industries necessitate reliable radiographic inspection, contributing to market growth. The market is segmented by technology (Film Radiography, Computed Radiography, Direct Radiography, Computed Tomography) and end-user vertical (Aerospace & Defense, Energy & Power, Construction, Oil & Gas, Automotive, Manufacturing, Other). Technological advancements, including improved image resolution and faster processing times, are key trends shaping the market. However, high initial investment costs for advanced equipment and the need for skilled personnel to operate and interpret the results represent potential restraints.
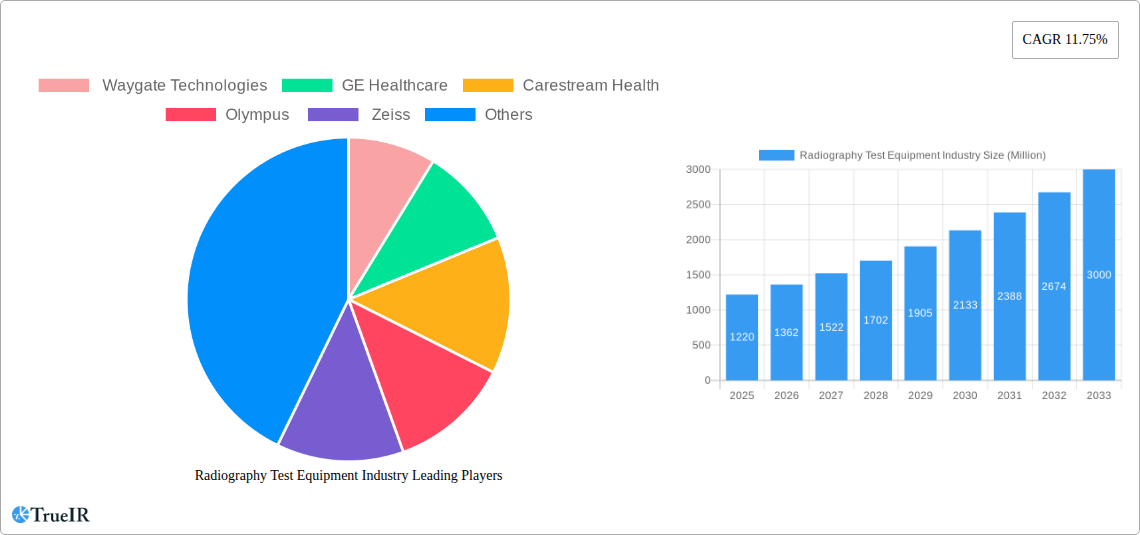
Radiography Test Equipment Industry Market Size (In Billion)
Despite these restraints, the market's long-term outlook remains positive due to continued technological innovation and the expanding application of radiography in various sectors. The Asia-Pacific region is expected to witness significant growth, driven by rapid industrialization and infrastructure development in countries like China and India. North America and Europe, while mature markets, are also expected to contribute substantially due to ongoing research and development in the field and a continued need for quality control in advanced manufacturing. The competitive landscape comprises established players like GE Healthcare, Carestream Health, and Fujifilm, alongside specialized companies like Waygate Technologies and Nikon Metrology, all vying for market share through product innovation and strategic partnerships. This dynamic interplay of technological advancements, expanding applications, and competitive landscape will define the growth trajectory of the radiography test equipment market in the coming years.
Radiography Test Equipment Industry Company Market Share
Radiography Test Equipment Industry Market Report: 2019-2033
This comprehensive report provides an in-depth analysis of the Radiography Test Equipment industry, covering market size, growth drivers, competitive landscape, and future outlook from 2019 to 2033. The report utilizes a robust methodology, incorporating historical data (2019-2024), a base year (2025), and a forecast period (2025-2033) to provide accurate and reliable market estimations. Key players like Waygate Technologies, GE Healthcare, Carestream Health, Olympus, Zeiss, Fujifilm, SLB, Nikon Metrology, Hexagon, and TeraRecon are analyzed, alongside market segments like Film Radiography, Computed Radiography, Direct Radiography, and Computed Tomography across various end-user verticals. The report is designed to provide actionable insights for industry stakeholders, investors, and strategic decision-makers.
Radiography Test Equipment Industry Market Structure & Competitive Landscape
The radiography test equipment market exhibits a moderately concentrated structure, with the top five players holding approximately xx% of the global market share in 2024. This concentration is driven by significant investments in R&D, resulting in continuous product innovations and technological advancements. The industry is also influenced by stringent regulatory frameworks concerning safety and radiation protection, shaping product design and market entry strategies. Product substitution is limited, with alternative nondestructive testing methods often having specialized applications or limitations. The market is segmented across various end-user verticals, with the aerospace & defense, energy & power, and automotive sectors being prominent.
Key aspects of market structure:
- Market Concentration: xx% market share held by top 5 players in 2024.
- Innovation Drivers: Continuous R&D investments in advanced imaging technologies and software analytics.
- Regulatory Impacts: Stringent safety standards and radiation protection regulations impact product design and market access.
- Product Substitutes: Limited substitutes, with alternative NDT methods often specialized.
- End-User Segmentation: Aerospace & defense, energy & power, automotive sectors are key segments.
- M&A Trends: A moderate level of mergers and acquisitions, with xx transactions recorded between 2019 and 2024, totaling an estimated value of $xx Million.
Radiography Test Equipment Industry Market Trends & Opportunities
The radiography test equipment market is projected to witness a Compound Annual Growth Rate (CAGR) of xx% during the forecast period (2025-2033), driven by the increasing demand for non-destructive testing (NDT) across diverse industries. Technological advancements like direct radiography (DR) and computed tomography (CT) are increasing adoption rates, owing to their improved image quality, speed, and data analysis capabilities. The preference for digital solutions over traditional film radiography is accelerating market growth, further fueled by declining costs and enhanced efficiency. The competitive landscape is characterized by both established players and emerging companies, leading to product innovation and price competition, benefiting end-users. Market penetration rates of DR and CT systems are projected to increase significantly, particularly in developing economies with growing infrastructure projects. The global market size is estimated at $xx Million in 2025, with projections to reach $xx Million by 2033.
Dominant Markets & Segments in Radiography Test Equipment Industry
The North American region is currently the dominant market for radiography test equipment, driven by robust industrial activity, strong technological adoption, and favorable regulatory frameworks. Within the technology segments, Computed Radiography (CR) and Direct Radiography (DR) are experiencing the most rapid growth due to their improved image quality and efficiency compared to Film Radiography. Computed Tomography (CT) is witnessing increasing adoption in specialized applications, particularly within the aerospace and defense industries. The Automotive segment within the end-user verticals is driving strong demand, fueled by rigorous quality control and safety standards in vehicle manufacturing.
Key Growth Drivers:
- North America: Strong industrial activity and high technological adoption rates.
- Computed Radiography (CR) and Direct Radiography (DR): Superior image quality and efficiency compared to film radiography.
- Computed Tomography (CT): Increasing use in specialized applications, particularly aerospace & defense.
- Automotive Sector: Stringent quality control and safety standards in vehicle manufacturing.
- Infrastructure Development: Large-scale infrastructure projects globally contribute to increased demand (e.g., India's INR 111 crore National Infrastructure Pipeline).
- Manufacturing Sector Expansion: Investments in manufacturing expansion (e.g., Ford's $1.05 billion investment in South Africa).
Radiography Test Equipment Industry Product Analysis
The radiography test equipment market is witnessing a shift towards digital technologies. Computed Radiography (CR) and Direct Radiography (DR) systems are gaining prominence due to their improved image quality, faster processing times, and enhanced data management capabilities compared to traditional film-based methods. Computed Tomography (CT) scanners offer advanced capabilities for complex component inspection, driving adoption in specialized sectors like aerospace and medical imaging. The competitive advantage lies in delivering high-resolution images, user-friendly interfaces, sophisticated software for data analysis, and robust after-sales service and support.
Key Drivers, Barriers & Challenges in Radiography Test Equipment Industry
Key Drivers: Technological advancements in digital imaging, increasing demand for NDT in various industries (especially automotive, aerospace & defense, and energy), stringent quality control regulations, and government initiatives supporting infrastructure development are primary growth drivers. Specific examples include the increasing adoption of DR and CT technologies and growing investments in manufacturing and infrastructure projects.
Key Challenges: High initial investment costs for advanced systems, stringent regulatory compliance requirements, potential supply chain disruptions impacting component availability, and intense competition among established players can restrain market growth. For example, global supply chain disruptions have impacted the availability of certain key components, leading to production delays and increased costs. The estimated impact of these challenges on market growth in 2025 is approximately $xx Million.
Growth Drivers in the Radiography Test Equipment Industry Market
The radiography test equipment market is propelled by technological advancements, including the development of higher-resolution imaging systems and more efficient data analysis software. Strong demand from various industrial sectors, driven by increasing quality control standards, particularly in aerospace and automotive manufacturing, contributes significantly to market growth. Government initiatives promoting infrastructure development also stimulate demand. The declining cost of digital radiography systems further enhances market penetration.
Challenges Impacting Radiography Test Equipment Industry Growth
Regulatory complexities in obtaining approvals for new equipment and navigating safety standards pose challenges. Supply chain disruptions, particularly the shortage of specific components, can impact production and lead to delays. Intense competition from established players and new entrants creates pressure on pricing and profitability, hindering overall market growth. These factors cumulatively impact market growth by an estimated $xx Million annually.
Key Players Shaping the Radiography Test Equipment Industry Market
Significant Radiography Test Equipment Industry Industry Milestones
- August 2020: The Indian government's INR 111 crore National Infrastructure Pipeline, encompassing 6,835 projects, signals increased investment in infrastructure and boosts demand for radiography equipment.
- February 2021: Ford Motor Co.'s USD 1.05 billion investment in South African manufacturing operations signifies expansion in the automotive sector, driving demand for quality control equipment, including radiography systems.
Future Outlook for Radiography Test Equipment Industry Market
The radiography test equipment market is poised for continued growth, driven by ongoing technological advancements, increasing demand from diverse industries, and supportive government policies. Strategic opportunities exist in developing advanced imaging technologies, expanding into emerging markets, and strengthening partnerships across the value chain. The market's strong fundamentals suggest significant potential for growth and innovation in the coming years.
Radiography Test Equipment Industry Segmentation
-
1. Technology
- 1.1. Film Radiography
- 1.2. Computed Radiography
- 1.3. Direct Radiography
- 1.4. Computed Tomography
-
2. End-user Vertical
- 2.1. Aerospace and Defense
- 2.2. Energy and Power
- 2.3. Construction
- 2.4. Oil and Gas
- 2.5. Automotive
- 2.6. Manufacturing
- 2.7. Other End-user Industries
Radiography Test Equipment Industry Segmentation By Geography
- 1. North America
- 2. Europe
- 3. Asia Pacific
- 4. Latin America
- 5. Middle East
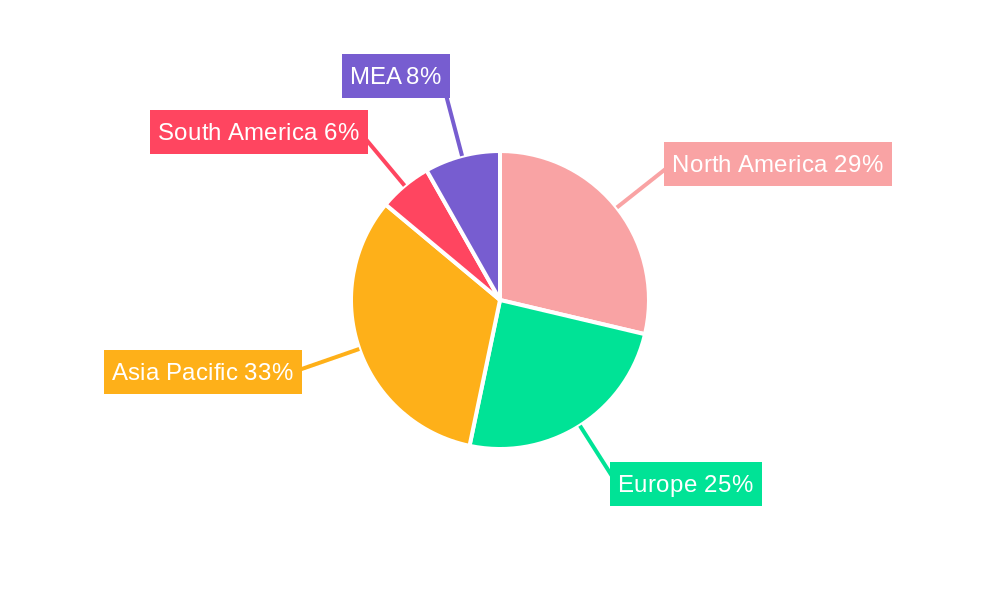
Radiography Test Equipment Industry Regional Market Share
Geographic Coverage of Radiography Test Equipment Industry
Radiography Test Equipment Industry REPORT HIGHLIGHTS
| Aspects | Details |
|---|---|
| Study Period | 2020-2034 |
| Base Year | 2025 |
| Estimated Year | 2026 |
| Forecast Period | 2026-2034 |
| Historical Period | 2020-2025 |
| Growth Rate | CAGR of 11.75% from 2020-2034 |
| Segmentation |
|
Table of Contents
- 1. Introduction
- 1.1. Research Scope
- 1.2. Market Segmentation
- 1.3. Research Objective
- 1.4. Definitions and Assumptions
- 2. Executive Summary
- 2.1. Market Snapshot
- 3. Market Dynamics
- 3.1. Market Drivers
- 3.2. Market Restrains
- 3.3. Market Trends
- 3.4. Market Opportunities
- 4. Market Factor Analysis
- 4.1. Porters Five Forces
- 4.1.1. Bargaining Power of Suppliers
- 4.1.2. Bargaining Power of Buyers
- 4.1.3. Threat of New Entrants
- 4.1.4. Threat of Substitutes
- 4.1.5. Competitive Rivalry
- 4.2. PESTEL analysis
- 4.3. BCG Analysis
- 4.3.1. Stars (High Growth, High Market Share)
- 4.3.2. Cash Cows (Low Growth, High Market Share)
- 4.3.3. Question Mark (High Growth, Low Market Share)
- 4.3.4. Dogs (Low Growth, Low Market Share)
- 4.4. Ansoff Matrix Analysis
- 4.5. Supply Chain Analysis
- 4.6. Regulatory Landscape
- 4.7. Current Market Potential and Opportunity Assessment (TAM–SAM–SOM Framework)
- 4.8. TIR Analyst Note
- 4.1. Porters Five Forces
- 5. Market Analysis, Insights and Forecast 2021-2033
- 5.1. Market Analysis, Insights and Forecast - by Technology
- 5.1.1. Film Radiography
- 5.1.2. Computed Radiography
- 5.1.3. Direct Radiography
- 5.1.4. Computed Tomography
- 5.2. Market Analysis, Insights and Forecast - by End-user Vertical
- 5.2.1. Aerospace and Defense
- 5.2.2. Energy and Power
- 5.2.3. Construction
- 5.2.4. Oil and Gas
- 5.2.5. Automotive
- 5.2.6. Manufacturing
- 5.2.7. Other End-user Industries
- 5.3. Market Analysis, Insights and Forecast - by Region
- 5.3.1. North America
- 5.3.2. Europe
- 5.3.3. Asia Pacific
- 5.3.4. Latin America
- 5.3.5. Middle East
- 5.1. Market Analysis, Insights and Forecast - by Technology
- 6. Global Radiography Test Equipment Industry Analysis, Insights and Forecast, 2021-2033
- 6.1. Market Analysis, Insights and Forecast - by Technology
- 6.1.1. Film Radiography
- 6.1.2. Computed Radiography
- 6.1.3. Direct Radiography
- 6.1.4. Computed Tomography
- 6.2. Market Analysis, Insights and Forecast - by End-user Vertical
- 6.2.1. Aerospace and Defense
- 6.2.2. Energy and Power
- 6.2.3. Construction
- 6.2.4. Oil and Gas
- 6.2.5. Automotive
- 6.2.6. Manufacturing
- 6.2.7. Other End-user Industries
- 6.1. Market Analysis, Insights and Forecast - by Technology
- 7. North America Radiography Test Equipment Industry Analysis, Insights and Forecast, 2020-2032
- 7.1. Market Analysis, Insights and Forecast - by Technology
- 7.1.1. Film Radiography
- 7.1.2. Computed Radiography
- 7.1.3. Direct Radiography
- 7.1.4. Computed Tomography
- 7.2. Market Analysis, Insights and Forecast - by End-user Vertical
- 7.2.1. Aerospace and Defense
- 7.2.2. Energy and Power
- 7.2.3. Construction
- 7.2.4. Oil and Gas
- 7.2.5. Automotive
- 7.2.6. Manufacturing
- 7.2.7. Other End-user Industries
- 7.1. Market Analysis, Insights and Forecast - by Technology
- 8. Europe Radiography Test Equipment Industry Analysis, Insights and Forecast, 2020-2032
- 8.1. Market Analysis, Insights and Forecast - by Technology
- 8.1.1. Film Radiography
- 8.1.2. Computed Radiography
- 8.1.3. Direct Radiography
- 8.1.4. Computed Tomography
- 8.2. Market Analysis, Insights and Forecast - by End-user Vertical
- 8.2.1. Aerospace and Defense
- 8.2.2. Energy and Power
- 8.2.3. Construction
- 8.2.4. Oil and Gas
- 8.2.5. Automotive
- 8.2.6. Manufacturing
- 8.2.7. Other End-user Industries
- 8.1. Market Analysis, Insights and Forecast - by Technology
- 9. Asia Pacific Radiography Test Equipment Industry Analysis, Insights and Forecast, 2020-2032
- 9.1. Market Analysis, Insights and Forecast - by Technology
- 9.1.1. Film Radiography
- 9.1.2. Computed Radiography
- 9.1.3. Direct Radiography
- 9.1.4. Computed Tomography
- 9.2. Market Analysis, Insights and Forecast - by End-user Vertical
- 9.2.1. Aerospace and Defense
- 9.2.2. Energy and Power
- 9.2.3. Construction
- 9.2.4. Oil and Gas
- 9.2.5. Automotive
- 9.2.6. Manufacturing
- 9.2.7. Other End-user Industries
- 9.1. Market Analysis, Insights and Forecast - by Technology
- 10. Latin America Radiography Test Equipment Industry Analysis, Insights and Forecast, 2020-2032
- 10.1. Market Analysis, Insights and Forecast - by Technology
- 10.1.1. Film Radiography
- 10.1.2. Computed Radiography
- 10.1.3. Direct Radiography
- 10.1.4. Computed Tomography
- 10.2. Market Analysis, Insights and Forecast - by End-user Vertical
- 10.2.1. Aerospace and Defense
- 10.2.2. Energy and Power
- 10.2.3. Construction
- 10.2.4. Oil and Gas
- 10.2.5. Automotive
- 10.2.6. Manufacturing
- 10.2.7. Other End-user Industries
- 10.1. Market Analysis, Insights and Forecast - by Technology
- 11. Middle East Radiography Test Equipment Industry Analysis, Insights and Forecast, 2020-2032
- 11.1. Market Analysis, Insights and Forecast - by Technology
- 11.1.1. Film Radiography
- 11.1.2. Computed Radiography
- 11.1.3. Direct Radiography
- 11.1.4. Computed Tomography
- 11.2. Market Analysis, Insights and Forecast - by End-user Vertical
- 11.2.1. Aerospace and Defense
- 11.2.2. Energy and Power
- 11.2.3. Construction
- 11.2.4. Oil and Gas
- 11.2.5. Automotive
- 11.2.6. Manufacturing
- 11.2.7. Other End-user Industries
- 11.1. Market Analysis, Insights and Forecast - by Technology
- 12. Competitive Analysis
- 12.1. Company Profiles
- 12.1.1 Waygate Technologies
- 12.1.1.1. Company Overview
- 12.1.1.2. Products
- 12.1.1.3. Company Financials
- 12.1.1.4. SWOT Analysis
- 12.1.2 GE Healthcare
- 12.1.2.1. Company Overview
- 12.1.2.2. Products
- 12.1.2.3. Company Financials
- 12.1.2.4. SWOT Analysis
- 12.1.3 Carestream Health
- 12.1.3.1. Company Overview
- 12.1.3.2. Products
- 12.1.3.3. Company Financials
- 12.1.3.4. SWOT Analysis
- 12.1.4 Olympus
- 12.1.4.1. Company Overview
- 12.1.4.2. Products
- 12.1.4.3. Company Financials
- 12.1.4.4. SWOT Analysis
- 12.1.5 Zeiss
- 12.1.5.1. Company Overview
- 12.1.5.2. Products
- 12.1.5.3. Company Financials
- 12.1.5.4. SWOT Analysis
- 12.1.6 Fujifilm
- 12.1.6.1. Company Overview
- 12.1.6.2. Products
- 12.1.6.3. Company Financials
- 12.1.6.4. SWOT Analysis
- 12.1.7 SLB
- 12.1.7.1. Company Overview
- 12.1.7.2. Products
- 12.1.7.3. Company Financials
- 12.1.7.4. SWOT Analysis
- 12.1.8 Nikon Metrology
- 12.1.8.1. Company Overview
- 12.1.8.2. Products
- 12.1.8.3. Company Financials
- 12.1.8.4. SWOT Analysis
- 12.1.9 Hexagon
- 12.1.9.1. Company Overview
- 12.1.9.2. Products
- 12.1.9.3. Company Financials
- 12.1.9.4. SWOT Analysis
- 12.1.10 TeraRecon
- 12.1.10.1. Company Overview
- 12.1.10.2. Products
- 12.1.10.3. Company Financials
- 12.1.10.4. SWOT Analysis
- 12.1.1 Waygate Technologies
- 12.2. Market Entropy
- 12.2.1 Company's Key Areas Served
- 12.2.2 Recent Developments
- 12.3. Company Market Share Analysis 2025
- 12.3.1 Top 5 Companies Market Share Analysis
- 12.3.2 Top 3 Companies Market Share Analysis
- 12.4. List of Potential Customers
- 13. Research Methodology
List of Figures
- Figure 1: Global Radiography Test Equipment Industry Revenue Breakdown (Million, %) by Region 2025 & 2033
- Figure 2: Global Radiography Test Equipment Industry Volume Breakdown (K Units, %) by Region 2025 & 2033
- Figure 3: North America Radiography Test Equipment Industry Revenue (Million), by Technology 2025 & 2033
- Figure 4: North America Radiography Test Equipment Industry Volume (K Units), by Technology 2025 & 2033
- Figure 5: North America Radiography Test Equipment Industry Revenue Share (%), by Technology 2025 & 2033
- Figure 6: North America Radiography Test Equipment Industry Volume Share (%), by Technology 2025 & 2033
- Figure 7: North America Radiography Test Equipment Industry Revenue (Million), by End-user Vertical 2025 & 2033
- Figure 8: North America Radiography Test Equipment Industry Volume (K Units), by End-user Vertical 2025 & 2033
- Figure 9: North America Radiography Test Equipment Industry Revenue Share (%), by End-user Vertical 2025 & 2033
- Figure 10: North America Radiography Test Equipment Industry Volume Share (%), by End-user Vertical 2025 & 2033
- Figure 11: North America Radiography Test Equipment Industry Revenue (Million), by Country 2025 & 2033
- Figure 12: North America Radiography Test Equipment Industry Volume (K Units), by Country 2025 & 2033
- Figure 13: North America Radiography Test Equipment Industry Revenue Share (%), by Country 2025 & 2033
- Figure 14: North America Radiography Test Equipment Industry Volume Share (%), by Country 2025 & 2033
- Figure 15: Europe Radiography Test Equipment Industry Revenue (Million), by Technology 2025 & 2033
- Figure 16: Europe Radiography Test Equipment Industry Volume (K Units), by Technology 2025 & 2033
- Figure 17: Europe Radiography Test Equipment Industry Revenue Share (%), by Technology 2025 & 2033
- Figure 18: Europe Radiography Test Equipment Industry Volume Share (%), by Technology 2025 & 2033
- Figure 19: Europe Radiography Test Equipment Industry Revenue (Million), by End-user Vertical 2025 & 2033
- Figure 20: Europe Radiography Test Equipment Industry Volume (K Units), by End-user Vertical 2025 & 2033
- Figure 21: Europe Radiography Test Equipment Industry Revenue Share (%), by End-user Vertical 2025 & 2033
- Figure 22: Europe Radiography Test Equipment Industry Volume Share (%), by End-user Vertical 2025 & 2033
- Figure 23: Europe Radiography Test Equipment Industry Revenue (Million), by Country 2025 & 2033
- Figure 24: Europe Radiography Test Equipment Industry Volume (K Units), by Country 2025 & 2033
- Figure 25: Europe Radiography Test Equipment Industry Revenue Share (%), by Country 2025 & 2033
- Figure 26: Europe Radiography Test Equipment Industry Volume Share (%), by Country 2025 & 2033
- Figure 27: Asia Pacific Radiography Test Equipment Industry Revenue (Million), by Technology 2025 & 2033
- Figure 28: Asia Pacific Radiography Test Equipment Industry Volume (K Units), by Technology 2025 & 2033
- Figure 29: Asia Pacific Radiography Test Equipment Industry Revenue Share (%), by Technology 2025 & 2033
- Figure 30: Asia Pacific Radiography Test Equipment Industry Volume Share (%), by Technology 2025 & 2033
- Figure 31: Asia Pacific Radiography Test Equipment Industry Revenue (Million), by End-user Vertical 2025 & 2033
- Figure 32: Asia Pacific Radiography Test Equipment Industry Volume (K Units), by End-user Vertical 2025 & 2033
- Figure 33: Asia Pacific Radiography Test Equipment Industry Revenue Share (%), by End-user Vertical 2025 & 2033
- Figure 34: Asia Pacific Radiography Test Equipment Industry Volume Share (%), by End-user Vertical 2025 & 2033
- Figure 35: Asia Pacific Radiography Test Equipment Industry Revenue (Million), by Country 2025 & 2033
- Figure 36: Asia Pacific Radiography Test Equipment Industry Volume (K Units), by Country 2025 & 2033
- Figure 37: Asia Pacific Radiography Test Equipment Industry Revenue Share (%), by Country 2025 & 2033
- Figure 38: Asia Pacific Radiography Test Equipment Industry Volume Share (%), by Country 2025 & 2033
- Figure 39: Latin America Radiography Test Equipment Industry Revenue (Million), by Technology 2025 & 2033
- Figure 40: Latin America Radiography Test Equipment Industry Volume (K Units), by Technology 2025 & 2033
- Figure 41: Latin America Radiography Test Equipment Industry Revenue Share (%), by Technology 2025 & 2033
- Figure 42: Latin America Radiography Test Equipment Industry Volume Share (%), by Technology 2025 & 2033
- Figure 43: Latin America Radiography Test Equipment Industry Revenue (Million), by End-user Vertical 2025 & 2033
- Figure 44: Latin America Radiography Test Equipment Industry Volume (K Units), by End-user Vertical 2025 & 2033
- Figure 45: Latin America Radiography Test Equipment Industry Revenue Share (%), by End-user Vertical 2025 & 2033
- Figure 46: Latin America Radiography Test Equipment Industry Volume Share (%), by End-user Vertical 2025 & 2033
- Figure 47: Latin America Radiography Test Equipment Industry Revenue (Million), by Country 2025 & 2033
- Figure 48: Latin America Radiography Test Equipment Industry Volume (K Units), by Country 2025 & 2033
- Figure 49: Latin America Radiography Test Equipment Industry Revenue Share (%), by Country 2025 & 2033
- Figure 50: Latin America Radiography Test Equipment Industry Volume Share (%), by Country 2025 & 2033
- Figure 51: Middle East Radiography Test Equipment Industry Revenue (Million), by Technology 2025 & 2033
- Figure 52: Middle East Radiography Test Equipment Industry Volume (K Units), by Technology 2025 & 2033
- Figure 53: Middle East Radiography Test Equipment Industry Revenue Share (%), by Technology 2025 & 2033
- Figure 54: Middle East Radiography Test Equipment Industry Volume Share (%), by Technology 2025 & 2033
- Figure 55: Middle East Radiography Test Equipment Industry Revenue (Million), by End-user Vertical 2025 & 2033
- Figure 56: Middle East Radiography Test Equipment Industry Volume (K Units), by End-user Vertical 2025 & 2033
- Figure 57: Middle East Radiography Test Equipment Industry Revenue Share (%), by End-user Vertical 2025 & 2033
- Figure 58: Middle East Radiography Test Equipment Industry Volume Share (%), by End-user Vertical 2025 & 2033
- Figure 59: Middle East Radiography Test Equipment Industry Revenue (Million), by Country 2025 & 2033
- Figure 60: Middle East Radiography Test Equipment Industry Volume (K Units), by Country 2025 & 2033
- Figure 61: Middle East Radiography Test Equipment Industry Revenue Share (%), by Country 2025 & 2033
- Figure 62: Middle East Radiography Test Equipment Industry Volume Share (%), by Country 2025 & 2033
List of Tables
- Table 1: Global Radiography Test Equipment Industry Revenue Million Forecast, by Technology 2020 & 2033
- Table 2: Global Radiography Test Equipment Industry Volume K Units Forecast, by Technology 2020 & 2033
- Table 3: Global Radiography Test Equipment Industry Revenue Million Forecast, by End-user Vertical 2020 & 2033
- Table 4: Global Radiography Test Equipment Industry Volume K Units Forecast, by End-user Vertical 2020 & 2033
- Table 5: Global Radiography Test Equipment Industry Revenue Million Forecast, by Region 2020 & 2033
- Table 6: Global Radiography Test Equipment Industry Volume K Units Forecast, by Region 2020 & 2033
- Table 7: Global Radiography Test Equipment Industry Revenue Million Forecast, by Technology 2020 & 2033
- Table 8: Global Radiography Test Equipment Industry Volume K Units Forecast, by Technology 2020 & 2033
- Table 9: Global Radiography Test Equipment Industry Revenue Million Forecast, by End-user Vertical 2020 & 2033
- Table 10: Global Radiography Test Equipment Industry Volume K Units Forecast, by End-user Vertical 2020 & 2033
- Table 11: Global Radiography Test Equipment Industry Revenue Million Forecast, by Country 2020 & 2033
- Table 12: Global Radiography Test Equipment Industry Volume K Units Forecast, by Country 2020 & 2033
- Table 13: Global Radiography Test Equipment Industry Revenue Million Forecast, by Technology 2020 & 2033
- Table 14: Global Radiography Test Equipment Industry Volume K Units Forecast, by Technology 2020 & 2033
- Table 15: Global Radiography Test Equipment Industry Revenue Million Forecast, by End-user Vertical 2020 & 2033
- Table 16: Global Radiography Test Equipment Industry Volume K Units Forecast, by End-user Vertical 2020 & 2033
- Table 17: Global Radiography Test Equipment Industry Revenue Million Forecast, by Country 2020 & 2033
- Table 18: Global Radiography Test Equipment Industry Volume K Units Forecast, by Country 2020 & 2033
- Table 19: Global Radiography Test Equipment Industry Revenue Million Forecast, by Technology 2020 & 2033
- Table 20: Global Radiography Test Equipment Industry Volume K Units Forecast, by Technology 2020 & 2033
- Table 21: Global Radiography Test Equipment Industry Revenue Million Forecast, by End-user Vertical 2020 & 2033
- Table 22: Global Radiography Test Equipment Industry Volume K Units Forecast, by End-user Vertical 2020 & 2033
- Table 23: Global Radiography Test Equipment Industry Revenue Million Forecast, by Country 2020 & 2033
- Table 24: Global Radiography Test Equipment Industry Volume K Units Forecast, by Country 2020 & 2033
- Table 25: Global Radiography Test Equipment Industry Revenue Million Forecast, by Technology 2020 & 2033
- Table 26: Global Radiography Test Equipment Industry Volume K Units Forecast, by Technology 2020 & 2033
- Table 27: Global Radiography Test Equipment Industry Revenue Million Forecast, by End-user Vertical 2020 & 2033
- Table 28: Global Radiography Test Equipment Industry Volume K Units Forecast, by End-user Vertical 2020 & 2033
- Table 29: Global Radiography Test Equipment Industry Revenue Million Forecast, by Country 2020 & 2033
- Table 30: Global Radiography Test Equipment Industry Volume K Units Forecast, by Country 2020 & 2033
- Table 31: Global Radiography Test Equipment Industry Revenue Million Forecast, by Technology 2020 & 2033
- Table 32: Global Radiography Test Equipment Industry Volume K Units Forecast, by Technology 2020 & 2033
- Table 33: Global Radiography Test Equipment Industry Revenue Million Forecast, by End-user Vertical 2020 & 2033
- Table 34: Global Radiography Test Equipment Industry Volume K Units Forecast, by End-user Vertical 2020 & 2033
- Table 35: Global Radiography Test Equipment Industry Revenue Million Forecast, by Country 2020 & 2033
- Table 36: Global Radiography Test Equipment Industry Volume K Units Forecast, by Country 2020 & 2033
Frequently Asked Questions
1. What is the projected Compound Annual Growth Rate (CAGR) of the Radiography Test Equipment Industry?
The projected CAGR is approximately 11.75%.
2. Which companies are prominent players in the Radiography Test Equipment Industry?
Key companies in the market include Waygate Technologies, GE Healthcare, Carestream Health, Olympus , Zeiss, Fujifilm, SLB, Nikon Metrology , Hexagon, TeraRecon.
3. What are the main segments of the Radiography Test Equipment Industry?
The market segments include Technology, End-user Vertical.
4. Can you provide details about the market size?
The market size is estimated to be USD 1.22 Million as of 2022.
5. What are some drivers contributing to market growth?
Advent of Portable Radiography Equipment.
6. What are the notable trends driving market growth?
Application in Aerospace to Account for a Significant Portion of the Market Demand.
7. Are there any restraints impacting market growth?
Rising Privacy and Security Concerns.
8. Can you provide examples of recent developments in the market?
August 2020 - The Indian government identified and listed 6,835 projects under its INR 111 crore National Infrastructure Pipeline to attract investments in infrastructure development.
9. What pricing options are available for accessing the report?
Pricing options include single-user, multi-user, and enterprise licenses priced at USD 4750, USD 5250, and USD 8750 respectively.
10. Is the market size provided in terms of value or volume?
The market size is provided in terms of value, measured in Million and volume, measured in K Units.
11. Are there any specific market keywords associated with the report?
Yes, the market keyword associated with the report is "Radiography Test Equipment Industry," which aids in identifying and referencing the specific market segment covered.
12. How do I determine which pricing option suits my needs best?
The pricing options vary based on user requirements and access needs. Individual users may opt for single-user licenses, while businesses requiring broader access may choose multi-user or enterprise licenses for cost-effective access to the report.
13. Are there any additional resources or data provided in the Radiography Test Equipment Industry report?
While the report offers comprehensive insights, it's advisable to review the specific contents or supplementary materials provided to ascertain if additional resources or data are available.
14. How can I stay updated on further developments or reports in the Radiography Test Equipment Industry?
To stay informed about further developments, trends, and reports in the Radiography Test Equipment Industry, consider subscribing to industry newsletters, following relevant companies and organizations, or regularly checking reputable industry news sources and publications.
Methodology
Step 1 - Identification of Relevant Samples Size from Population Database


Step 2 - Approaches for Defining Global Market Size (Value, Volume* & Price*)

Note*: In applicable scenarios
Step 3 - Data Sources
Primary Research
- Web Analytics
- Survey Reports
- Research Institute
- Latest Research Reports
- Opinion Leaders
Secondary Research
- Annual Reports
- White Paper
- Latest Press Release
- Industry Association
- Paid Database
- Investor Presentations

Step 4 - Data Triangulation
Involves using different sources of information in order to increase the validity of a study
These sources are likely to be stakeholders in a program - participants, other researchers, program staff, other community members, and so on.
Then we put all data in single framework & apply various statistical tools to find out the dynamic on the market.
During the analysis stage, feedback from the stakeholder groups would be compared to determine areas of agreement as well as areas of divergence