

Key Insights
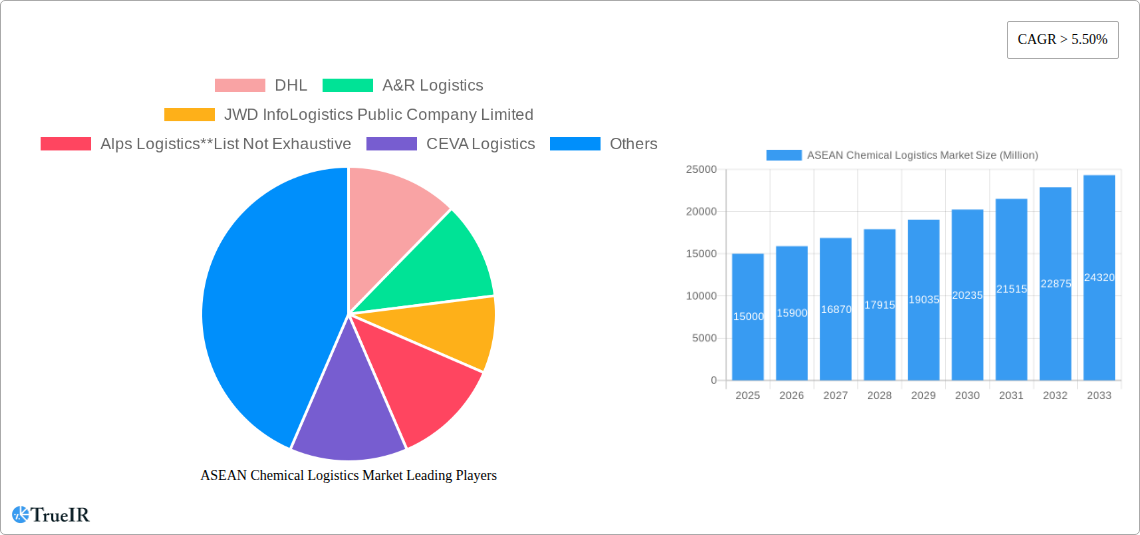
The ASEAN chemical logistics market is experiencing robust growth, driven by the burgeoning chemical industry across the region and the increasing demand for efficient and reliable transportation and warehousing solutions. A compound annual growth rate (CAGR) exceeding 5.5% from 2019 to 2024 indicates a significant expansion, projected to continue throughout the forecast period (2025-2033). Key drivers include the expanding manufacturing sectors in countries like Singapore, Thailand, and Vietnam, growing e-commerce activities demanding faster delivery times, and the rising adoption of sophisticated inventory management systems to minimize storage costs and optimize supply chains. The market is segmented by service (transportation, warehousing, etc.), mode of transportation (roadways, railways, etc.), and end-user industry (pharmaceuticals, specialty chemicals, etc.). While roadways currently dominate transportation, the increasing need for faster and more efficient cross-border transport is stimulating growth in airways and railways. Furthermore, the growing emphasis on sustainability is fostering the adoption of green logistics solutions, presenting new opportunities within the market. The dominance of major players like DHL and others reflects the need for specialized expertise in handling hazardous materials and ensuring regulatory compliance, a critical factor influencing market dynamics. However, infrastructural limitations in certain ASEAN nations and fluctuating fuel prices pose potential restraints to market growth.
The market’s size in 2025 is estimated to be substantial, reflecting the collective market value across all segments and countries within ASEAN. This value is expected to increase significantly by 2033, fueled by continuous industrial expansion, rising urbanization, and growing consumer demand. While specific country-level data is unavailable, the market’s overall growth trajectory clearly demonstrates a positive outlook for chemical logistics providers. The diversity of end-user industries suggests market resilience, as growth in one sector can offset potential slowdowns in another. The strategic investments in infrastructure and logistics technology within the region further amplify the market's overall potential. Competition among established players and emerging local firms drives innovation and improves overall service quality, further shaping the market landscape.
ASEAN Chemical Logistics Market: A Comprehensive Report (2019-2033)
This dynamic report provides a deep dive into the ASEAN Chemical Logistics Market, offering invaluable insights for industry stakeholders. With a detailed analysis spanning the period from 2019 to 2033, including a base year of 2025 and a forecast period of 2025-2033, this report is essential for understanding current market dynamics and future growth projections. The market is valued at xx Million in 2025 and is projected to reach xx Million by 2033, exhibiting a robust CAGR of xx%.
ASEAN Chemical Logistics Market Structure & Competitive Landscape
The ASEAN chemical logistics market is characterized by a moderately concentrated landscape, with several large multinational players and a number of regional operators competing for market share. The market concentration ratio (CR4) is estimated at xx%, indicating a relatively fragmented yet competitive environment. Innovation is a key driver, particularly in areas such as technology-enabled logistics, green logistics, and specialized warehousing for hazardous materials. Stringent regulations regarding the transportation and storage of chemicals significantly impact market operations. Product substitution, while limited, is influenced by advancements in packaging and transportation methods. The market is segmented by service (transportation, warehousing, distribution, inventory management, consulting, customs, green logistics, others), mode of transportation (roadways, railways, airways, waterways, pipelines), and end-user (pharmaceutical, specialty chemical, oil & gas, cosmetic, others). M&A activity has been relatively moderate in recent years, with an estimated xx Million in deal value during the historical period (2019-2024), primarily driven by companies seeking to expand their service offerings and geographic reach.
ASEAN Chemical Logistics Market Market Trends & Opportunities
The ASEAN chemical logistics market is experiencing significant growth driven by increasing industrialization, rising chemical production, and expanding cross-border trade within the region. The market size is projected to increase substantially, reaching an estimated value of xx Million by 2033. Technological advancements, particularly in digitalization and automation (e.g., blockchain for supply chain transparency, IoT for real-time tracking), are transforming the industry, improving efficiency, and enhancing security. Consumer preferences are shifting towards sustainable and environmentally friendly logistics solutions, creating opportunities for green logistics providers. Competitive dynamics are characterized by pricing pressures, the need for specialized services (handling hazardous materials), and the growing importance of supply chain resilience. Market penetration of advanced logistics technologies, such as AI-powered route optimization, is increasing at a rate of xx% annually.

Dominant Markets & Segments in ASEAN Chemical Logistics Market
Leading Regions/Countries: Singapore, Malaysia, and Thailand currently dominate the ASEAN chemical logistics market, driven by well-established industrial bases and supportive government policies. Indonesia and Vietnam are also emerging as key growth markets.
Dominant Segments:
- By Service: Transportation and warehousing currently constitute the largest segments, owing to the high volume of chemical shipments and storage needs. The consulting and management services segment is experiencing significant growth as companies seek expertise in managing complex chemical supply chains.
- By Mode of Transportation: Roadways are the most prevalent mode of transportation, given the extensive road networks within ASEAN countries. However, there's growing interest in railways for long-haul transport to reduce costs and environmental impact.
- By End User: The pharmaceutical and specialty chemical industries are major drivers of market growth, followed by the oil and gas and cosmetic industries.
Key Growth Drivers:
- Improving infrastructure: Investments in roads, railways, and ports are enhancing connectivity and facilitating efficient chemical transportation.
- Favorable government policies: Supportive policies promoting trade and industrial development are boosting market growth.
- Rising industrialization: Continued industrialization in the region is driving demand for chemical logistics services.
ASEAN Chemical Logistics Market Product Analysis
Product innovation in the ASEAN chemical logistics market focuses on improving efficiency, safety, and sustainability. This includes advancements in temperature-controlled transportation for sensitive chemicals, specialized packaging for hazardous materials, and real-time tracking systems. The market favors solutions that enhance supply chain visibility and reduce risks associated with chemical handling. The integration of technology is improving efficiency and reducing costs across the entire value chain.
Key Drivers, Barriers & Challenges in ASEAN Chemical Logistics Market
Key Drivers: The ASEAN chemical logistics market is driven by the region's economic growth, expanding manufacturing sector, and increasing demand for chemicals across various industries. Government initiatives to improve infrastructure and streamline regulations are also contributing factors. The rising adoption of technology-driven solutions, such as automated warehousing and advanced transportation management systems, further boosts efficiency and market expansion.
Key Challenges: Regulatory complexities regarding the transportation and handling of hazardous chemicals pose significant challenges. Supply chain disruptions, due to factors such as geopolitical instability and natural disasters, can significantly impact market operations. Intense competition among logistics providers puts pressure on pricing and profitability. An estimated xx% of chemical shipments experience delays annually due to infrastructural limitations.
Growth Drivers in the ASEAN Chemical Logistics Market Market
Economic growth, increased chemical production, and expanding trade within ASEAN are key drivers. Technological advancements like blockchain and IoT enhance efficiency and transparency. Government investments in infrastructure and supportive regulations also contribute significantly.
Challenges Impacting ASEAN Chemical Logistics Market Growth
Regulatory hurdles, especially for hazardous materials, and supply chain vulnerabilities (e.g., port congestion) hinder growth. Competition, fluctuating fuel prices, and the need for specialized expertise add to the challenges.
Key Players Shaping the ASEAN Chemical Logistics Market Market
- DHL
- A&R Logistics
- JWD InfoLogistics Public Company Limited
- Alps Logistics
- CEVA Logistics
- Agility Logistics
- CT Logistics
- Tiong Nam Logistics Holdings BhD
- Eagles Air & Sea
- BDP International
- Rinchem
- Rhenus Logistics
Significant ASEAN Chemical Logistics Market Industry Milestones
- October 2022: Rinchem nears completion of a new 45,000 sq. ft. chemical warehouse in Malaysia, boosting storage capacity by 3100 pallet positions.
- February 2022: Leschaco opens a new 120,000 sq. ft. chemical and dangerous goods warehouse in Port Klang, Malaysia, expanding storage capacity to 13,000 pallets.
- October 2021: Ratanakorn Asset and FLS form a joint venture (FLS Supply Chain Centers) to develop specialized warehouse complexes in Thailand, starting with a 10,000-square-meter hazardous chemical warehouse in Maptaphut, Rayong.
Future Outlook for ASEAN Chemical Logistics Market Market
The ASEAN chemical logistics market is poised for continued growth, driven by sustained economic expansion, rising industrial activity, and increasing adoption of advanced technologies. Strategic investments in infrastructure, further regulatory reforms, and a focus on sustainable practices will shape the market's future. Opportunities exist for companies offering specialized services, digital solutions, and green logistics options. The market’s potential for expansion is substantial, promising lucrative opportunities for established and emerging players alike.
ASEAN Chemical Logistics Market Segmentation
-
1. Service
- 1.1. Transportation
- 1.2. Warehous
- 1.3. Consulting & Management Services
- 1.4. Customs & Security
- 1.5. Green Logistics
- 1.6. Others
-
2. Mode of Transportation
- 2.1. Roadways
- 2.2. Railways
- 2.3. Airways
- 2.4. Waterways
- 2.5. Pipelines
-
3. End User
- 3.1. Pharmaceutical Industry
- 3.2. Specialty Chemical Industry
- 3.3. Oil and Gas Industry
- 3.4. Cosmetic Industry
- 3.5. Others
-
4. Geography
- 4.1. Singapore
- 4.2. Thailand
- 4.3. Malaysia
- 4.4. Vietnam
- 4.5. Indonesia
- 4.6. Philippines
- 4.7. Rest of ASEAN
ASEAN Chemical Logistics Market Segmentation By Geography
- 1. Singapore
- 2. Thailand
- 3. Malaysia
- 4. Vietnam
- 5. Indonesia
- 6. Philippines
- 7. Rest of ASEAN

ASEAN Chemical Logistics Market REPORT HIGHLIGHTS
| Aspects | Details |
|---|---|
| Study Period | 2019-2033 |
| Base Year | 2024 |
| Estimated Year | 2025 |
| Forecast Period | 2025-2033 |
| Historical Period | 2019-2024 |
| Growth Rate | CAGR of > 5.50% from 2019-2033 |
| Segmentation |
|
Table of Contents
- 1. Introduction
- 1.1. Research Scope
- 1.2. Market Segmentation
- 1.3. Research Methodology
- 1.4. Definitions and Assumptions
- 2. Executive Summary
- 2.1. Introduction
- 3. Market Dynamics
- 3.1. Introduction
- 3.2. Market Drivers
- 3.2.1. The Rise in Demand for Specialty Chemicals in ASEAN Countries Increasing Trade Logistics Activity; Partnerships and Collaborations Between Major Players in the Chemical Logistics Market are Being Formed for the Creation of Innovative Goods and Technologically Enhanced Services
- 3.3. Market Restrains
- 3.3.1. Complexities Related to Chemical Logistics; High Cost Involved in the Transportation of Chemicals
- 3.4. Market Trends
- 3.4.1. The Rise in Chemical Production is Expected to Propel the Growth of the Chemical Logistics Market
- 4. Market Factor Analysis
- 4.1. Porters Five Forces
- 4.2. Supply/Value Chain
- 4.3. PESTEL analysis
- 4.4. Market Entropy
- 4.5. Patent/Trademark Analysis
- 5. Global ASEAN Chemical Logistics Market Analysis, Insights and Forecast, 2019-2031
- 5.1. Market Analysis, Insights and Forecast - by Service
- 5.1.1. Transportation
- 5.1.2. Warehous
- 5.1.3. Consulting & Management Services
- 5.1.4. Customs & Security
- 5.1.5. Green Logistics
- 5.1.6. Others
- 5.2. Market Analysis, Insights and Forecast - by Mode of Transportation
- 5.2.1. Roadways
- 5.2.2. Railways
- 5.2.3. Airways
- 5.2.4. Waterways
- 5.2.5. Pipelines
- 5.3. Market Analysis, Insights and Forecast - by End User
- 5.3.1. Pharmaceutical Industry
- 5.3.2. Specialty Chemical Industry
- 5.3.3. Oil and Gas Industry
- 5.3.4. Cosmetic Industry
- 5.3.5. Others
- 5.4. Market Analysis, Insights and Forecast - by Geography
- 5.4.1. Singapore
- 5.4.2. Thailand
- 5.4.3. Malaysia
- 5.4.4. Vietnam
- 5.4.5. Indonesia
- 5.4.6. Philippines
- 5.4.7. Rest of ASEAN
- 5.5. Market Analysis, Insights and Forecast - by Region
- 5.5.1. Singapore
- 5.5.2. Thailand
- 5.5.3. Malaysia
- 5.5.4. Vietnam
- 5.5.5. Indonesia
- 5.5.6. Philippines
- 5.5.7. Rest of ASEAN
- 5.1. Market Analysis, Insights and Forecast - by Service
- 6. Singapore ASEAN Chemical Logistics Market Analysis, Insights and Forecast, 2019-2031
- 6.1. Market Analysis, Insights and Forecast - by Service
- 6.1.1. Transportation
- 6.1.2. Warehous
- 6.1.3. Consulting & Management Services
- 6.1.4. Customs & Security
- 6.1.5. Green Logistics
- 6.1.6. Others
- 6.2. Market Analysis, Insights and Forecast - by Mode of Transportation
- 6.2.1. Roadways
- 6.2.2. Railways
- 6.2.3. Airways
- 6.2.4. Waterways
- 6.2.5. Pipelines
- 6.3. Market Analysis, Insights and Forecast - by End User
- 6.3.1. Pharmaceutical Industry
- 6.3.2. Specialty Chemical Industry
- 6.3.3. Oil and Gas Industry
- 6.3.4. Cosmetic Industry
- 6.3.5. Others
- 6.4. Market Analysis, Insights and Forecast - by Geography
- 6.4.1. Singapore
- 6.4.2. Thailand
- 6.4.3. Malaysia
- 6.4.4. Vietnam
- 6.4.5. Indonesia
- 6.4.6. Philippines
- 6.4.7. Rest of ASEAN
- 6.1. Market Analysis, Insights and Forecast - by Service
- 7. Thailand ASEAN Chemical Logistics Market Analysis, Insights and Forecast, 2019-2031
- 7.1. Market Analysis, Insights and Forecast - by Service
- 7.1.1. Transportation
- 7.1.2. Warehous
- 7.1.3. Consulting & Management Services
- 7.1.4. Customs & Security
- 7.1.5. Green Logistics
- 7.1.6. Others
- 7.2. Market Analysis, Insights and Forecast - by Mode of Transportation
- 7.2.1. Roadways
- 7.2.2. Railways
- 7.2.3. Airways
- 7.2.4. Waterways
- 7.2.5. Pipelines
- 7.3. Market Analysis, Insights and Forecast - by End User
- 7.3.1. Pharmaceutical Industry
- 7.3.2. Specialty Chemical Industry
- 7.3.3. Oil and Gas Industry
- 7.3.4. Cosmetic Industry
- 7.3.5. Others
- 7.4. Market Analysis, Insights and Forecast - by Geography
- 7.4.1. Singapore
- 7.4.2. Thailand
- 7.4.3. Malaysia
- 7.4.4. Vietnam
- 7.4.5. Indonesia
- 7.4.6. Philippines
- 7.4.7. Rest of ASEAN
- 7.1. Market Analysis, Insights and Forecast - by Service
- 8. Malaysia ASEAN Chemical Logistics Market Analysis, Insights and Forecast, 2019-2031
- 8.1. Market Analysis, Insights and Forecast - by Service
- 8.1.1. Transportation
- 8.1.2. Warehous
- 8.1.3. Consulting & Management Services
- 8.1.4. Customs & Security
- 8.1.5. Green Logistics
- 8.1.6. Others
- 8.2. Market Analysis, Insights and Forecast - by Mode of Transportation
- 8.2.1. Roadways
- 8.2.2. Railways
- 8.2.3. Airways
- 8.2.4. Waterways
- 8.2.5. Pipelines
- 8.3. Market Analysis, Insights and Forecast - by End User
- 8.3.1. Pharmaceutical Industry
- 8.3.2. Specialty Chemical Industry
- 8.3.3. Oil and Gas Industry
- 8.3.4. Cosmetic Industry
- 8.3.5. Others
- 8.4. Market Analysis, Insights and Forecast - by Geography
- 8.4.1. Singapore
- 8.4.2. Thailand
- 8.4.3. Malaysia
- 8.4.4. Vietnam
- 8.4.5. Indonesia
- 8.4.6. Philippines
- 8.4.7. Rest of ASEAN
- 8.1. Market Analysis, Insights and Forecast - by Service
- 9. Vietnam ASEAN Chemical Logistics Market Analysis, Insights and Forecast, 2019-2031
- 9.1. Market Analysis, Insights and Forecast - by Service
- 9.1.1. Transportation
- 9.1.2. Warehous
- 9.1.3. Consulting & Management Services
- 9.1.4. Customs & Security
- 9.1.5. Green Logistics
- 9.1.6. Others
- 9.2. Market Analysis, Insights and Forecast - by Mode of Transportation
- 9.2.1. Roadways
- 9.2.2. Railways
- 9.2.3. Airways
- 9.2.4. Waterways
- 9.2.5. Pipelines
- 9.3. Market Analysis, Insights and Forecast - by End User
- 9.3.1. Pharmaceutical Industry
- 9.3.2. Specialty Chemical Industry
- 9.3.3. Oil and Gas Industry
- 9.3.4. Cosmetic Industry
- 9.3.5. Others
- 9.4. Market Analysis, Insights and Forecast - by Geography
- 9.4.1. Singapore
- 9.4.2. Thailand
- 9.4.3. Malaysia
- 9.4.4. Vietnam
- 9.4.5. Indonesia
- 9.4.6. Philippines
- 9.4.7. Rest of ASEAN
- 9.1. Market Analysis, Insights and Forecast - by Service
- 10. Indonesia ASEAN Chemical Logistics Market Analysis, Insights and Forecast, 2019-2031
- 10.1. Market Analysis, Insights and Forecast - by Service
- 10.1.1. Transportation
- 10.1.2. Warehous
- 10.1.3. Consulting & Management Services
- 10.1.4. Customs & Security
- 10.1.5. Green Logistics
- 10.1.6. Others
- 10.2. Market Analysis, Insights and Forecast - by Mode of Transportation
- 10.2.1. Roadways
- 10.2.2. Railways
- 10.2.3. Airways
- 10.2.4. Waterways
- 10.2.5. Pipelines
- 10.3. Market Analysis, Insights and Forecast - by End User
- 10.3.1. Pharmaceutical Industry
- 10.3.2. Specialty Chemical Industry
- 10.3.3. Oil and Gas Industry
- 10.3.4. Cosmetic Industry
- 10.3.5. Others
- 10.4. Market Analysis, Insights and Forecast - by Geography
- 10.4.1. Singapore
- 10.4.2. Thailand
- 10.4.3. Malaysia
- 10.4.4. Vietnam
- 10.4.5. Indonesia
- 10.4.6. Philippines
- 10.4.7. Rest of ASEAN
- 10.1. Market Analysis, Insights and Forecast - by Service
- 11. Philippines ASEAN Chemical Logistics Market Analysis, Insights and Forecast, 2019-2031
- 11.1. Market Analysis, Insights and Forecast - by Service
- 11.1.1. Transportation
- 11.1.2. Warehous
- 11.1.3. Consulting & Management Services
- 11.1.4. Customs & Security
- 11.1.5. Green Logistics
- 11.1.6. Others
- 11.2. Market Analysis, Insights and Forecast - by Mode of Transportation
- 11.2.1. Roadways
- 11.2.2. Railways
- 11.2.3. Airways
- 11.2.4. Waterways
- 11.2.5. Pipelines
- 11.3. Market Analysis, Insights and Forecast - by End User
- 11.3.1. Pharmaceutical Industry
- 11.3.2. Specialty Chemical Industry
- 11.3.3. Oil and Gas Industry
- 11.3.4. Cosmetic Industry
- 11.3.5. Others
- 11.4. Market Analysis, Insights and Forecast - by Geography
- 11.4.1. Singapore
- 11.4.2. Thailand
- 11.4.3. Malaysia
- 11.4.4. Vietnam
- 11.4.5. Indonesia
- 11.4.6. Philippines
- 11.4.7. Rest of ASEAN
- 11.1. Market Analysis, Insights and Forecast - by Service
- 12. Rest of ASEAN ASEAN Chemical Logistics Market Analysis, Insights and Forecast, 2019-2031
- 12.1. Market Analysis, Insights and Forecast - by Service
- 12.1.1. Transportation
- 12.1.2. Warehous
- 12.1.3. Consulting & Management Services
- 12.1.4. Customs & Security
- 12.1.5. Green Logistics
- 12.1.6. Others
- 12.2. Market Analysis, Insights and Forecast - by Mode of Transportation
- 12.2.1. Roadways
- 12.2.2. Railways
- 12.2.3. Airways
- 12.2.4. Waterways
- 12.2.5. Pipelines
- 12.3. Market Analysis, Insights and Forecast - by End User
- 12.3.1. Pharmaceutical Industry
- 12.3.2. Specialty Chemical Industry
- 12.3.3. Oil and Gas Industry
- 12.3.4. Cosmetic Industry
- 12.3.5. Others
- 12.4. Market Analysis, Insights and Forecast - by Geography
- 12.4.1. Singapore
- 12.4.2. Thailand
- 12.4.3. Malaysia
- 12.4.4. Vietnam
- 12.4.5. Indonesia
- 12.4.6. Philippines
- 12.4.7. Rest of ASEAN
- 12.1. Market Analysis, Insights and Forecast - by Service
- 13. Singapore ASEAN Chemical Logistics Market Analysis, Insights and Forecast, 2019-2031
- 13.1. Market Analysis, Insights and Forecast - By Country/Sub-region
- 13.1.1.
- 14. Thailand ASEAN Chemical Logistics Market Analysis, Insights and Forecast, 2019-2031
- 14.1. Market Analysis, Insights and Forecast - By Country/Sub-region
- 14.1.1.
- 15. Malaysia ASEAN Chemical Logistics Market Analysis, Insights and Forecast, 2019-2031
- 15.1. Market Analysis, Insights and Forecast - By Country/Sub-region
- 15.1.1.
- 16. Vietnam ASEAN Chemical Logistics Market Analysis, Insights and Forecast, 2019-2031
- 16.1. Market Analysis, Insights and Forecast - By Country/Sub-region
- 16.1.1.
- 17. Indonesia ASEAN Chemical Logistics Market Analysis, Insights and Forecast, 2019-2031
- 17.1. Market Analysis, Insights and Forecast - By Country/Sub-region
- 17.1.1.
- 18. Philippines ASEAN Chemical Logistics Market Analysis, Insights and Forecast, 2019-2031
- 18.1. Market Analysis, Insights and Forecast - By Country/Sub-region
- 18.1.1.
- 19. Rest of ASEAN ASEAN Chemical Logistics Market Analysis, Insights and Forecast, 2019-2031
- 19.1. Market Analysis, Insights and Forecast - By Country/Sub-region
- 19.1.1.
- 20. Competitive Analysis
- 20.1. Global Market Share Analysis 2024
- 20.2. Company Profiles
- 20.2.1 DHL
- 20.2.1.1. Overview
- 20.2.1.2. Products
- 20.2.1.3. SWOT Analysis
- 20.2.1.4. Recent Developments
- 20.2.1.5. Financials (Based on Availability)
- 20.2.2 A&R Logistics
- 20.2.2.1. Overview
- 20.2.2.2. Products
- 20.2.2.3. SWOT Analysis
- 20.2.2.4. Recent Developments
- 20.2.2.5. Financials (Based on Availability)
- 20.2.3 JWD InfoLogistics Public Company Limited
- 20.2.3.1. Overview
- 20.2.3.2. Products
- 20.2.3.3. SWOT Analysis
- 20.2.3.4. Recent Developments
- 20.2.3.5. Financials (Based on Availability)
- 20.2.4 Alps Logistics**List Not Exhaustive
- 20.2.4.1. Overview
- 20.2.4.2. Products
- 20.2.4.3. SWOT Analysis
- 20.2.4.4. Recent Developments
- 20.2.4.5. Financials (Based on Availability)
- 20.2.5 CEVA Logistics
- 20.2.5.1. Overview
- 20.2.5.2. Products
- 20.2.5.3. SWOT Analysis
- 20.2.5.4. Recent Developments
- 20.2.5.5. Financials (Based on Availability)
- 20.2.6 Agility Logistics
- 20.2.6.1. Overview
- 20.2.6.2. Products
- 20.2.6.3. SWOT Analysis
- 20.2.6.4. Recent Developments
- 20.2.6.5. Financials (Based on Availability)
- 20.2.7 CT Logistics
- 20.2.7.1. Overview
- 20.2.7.2. Products
- 20.2.7.3. SWOT Analysis
- 20.2.7.4. Recent Developments
- 20.2.7.5. Financials (Based on Availability)
- 20.2.8 Tiong Nam Logistics Holdings BhD
- 20.2.8.1. Overview
- 20.2.8.2. Products
- 20.2.8.3. SWOT Analysis
- 20.2.8.4. Recent Developments
- 20.2.8.5. Financials (Based on Availability)
- 20.2.9 Eagles Air & Sea
- 20.2.9.1. Overview
- 20.2.9.2. Products
- 20.2.9.3. SWOT Analysis
- 20.2.9.4. Recent Developments
- 20.2.9.5. Financials (Based on Availability)
- 20.2.10 BDP International
- 20.2.10.1. Overview
- 20.2.10.2. Products
- 20.2.10.3. SWOT Analysis
- 20.2.10.4. Recent Developments
- 20.2.10.5. Financials (Based on Availability)
- 20.2.11 Rinchem
- 20.2.11.1. Overview
- 20.2.11.2. Products
- 20.2.11.3. SWOT Analysis
- 20.2.11.4. Recent Developments
- 20.2.11.5. Financials (Based on Availability)
- 20.2.12 Rhenus Logistics
- 20.2.12.1. Overview
- 20.2.12.2. Products
- 20.2.12.3. SWOT Analysis
- 20.2.12.4. Recent Developments
- 20.2.12.5. Financials (Based on Availability)
- 20.2.1 DHL
List of Figures
- Figure 1: Global ASEAN Chemical Logistics Market Revenue Breakdown (Million, %) by Region 2024 & 2032
- Figure 2: Singapore ASEAN Chemical Logistics Market Revenue (Million), by Country 2024 & 2032
- Figure 3: Singapore ASEAN Chemical Logistics Market Revenue Share (%), by Country 2024 & 2032
- Figure 4: Thailand ASEAN Chemical Logistics Market Revenue (Million), by Country 2024 & 2032
- Figure 5: Thailand ASEAN Chemical Logistics Market Revenue Share (%), by Country 2024 & 2032
- Figure 6: Malaysia ASEAN Chemical Logistics Market Revenue (Million), by Country 2024 & 2032
- Figure 7: Malaysia ASEAN Chemical Logistics Market Revenue Share (%), by Country 2024 & 2032
- Figure 8: Vietnam ASEAN Chemical Logistics Market Revenue (Million), by Country 2024 & 2032
- Figure 9: Vietnam ASEAN Chemical Logistics Market Revenue Share (%), by Country 2024 & 2032
- Figure 10: Indonesia ASEAN Chemical Logistics Market Revenue (Million), by Country 2024 & 2032
- Figure 11: Indonesia ASEAN Chemical Logistics Market Revenue Share (%), by Country 2024 & 2032
- Figure 12: Philippines ASEAN Chemical Logistics Market Revenue (Million), by Country 2024 & 2032
- Figure 13: Philippines ASEAN Chemical Logistics Market Revenue Share (%), by Country 2024 & 2032
- Figure 14: Rest of ASEAN ASEAN Chemical Logistics Market Revenue (Million), by Country 2024 & 2032
- Figure 15: Rest of ASEAN ASEAN Chemical Logistics Market Revenue Share (%), by Country 2024 & 2032
- Figure 16: Singapore ASEAN Chemical Logistics Market Revenue (Million), by Service 2024 & 2032
- Figure 17: Singapore ASEAN Chemical Logistics Market Revenue Share (%), by Service 2024 & 2032
- Figure 18: Singapore ASEAN Chemical Logistics Market Revenue (Million), by Mode of Transportation 2024 & 2032
- Figure 19: Singapore ASEAN Chemical Logistics Market Revenue Share (%), by Mode of Transportation 2024 & 2032
- Figure 20: Singapore ASEAN Chemical Logistics Market Revenue (Million), by End User 2024 & 2032
- Figure 21: Singapore ASEAN Chemical Logistics Market Revenue Share (%), by End User 2024 & 2032
- Figure 22: Singapore ASEAN Chemical Logistics Market Revenue (Million), by Geography 2024 & 2032
- Figure 23: Singapore ASEAN Chemical Logistics Market Revenue Share (%), by Geography 2024 & 2032
- Figure 24: Singapore ASEAN Chemical Logistics Market Revenue (Million), by Country 2024 & 2032
- Figure 25: Singapore ASEAN Chemical Logistics Market Revenue Share (%), by Country 2024 & 2032
- Figure 26: Thailand ASEAN Chemical Logistics Market Revenue (Million), by Service 2024 & 2032
- Figure 27: Thailand ASEAN Chemical Logistics Market Revenue Share (%), by Service 2024 & 2032
- Figure 28: Thailand ASEAN Chemical Logistics Market Revenue (Million), by Mode of Transportation 2024 & 2032
- Figure 29: Thailand ASEAN Chemical Logistics Market Revenue Share (%), by Mode of Transportation 2024 & 2032
- Figure 30: Thailand ASEAN Chemical Logistics Market Revenue (Million), by End User 2024 & 2032
- Figure 31: Thailand ASEAN Chemical Logistics Market Revenue Share (%), by End User 2024 & 2032
- Figure 32: Thailand ASEAN Chemical Logistics Market Revenue (Million), by Geography 2024 & 2032
- Figure 33: Thailand ASEAN Chemical Logistics Market Revenue Share (%), by Geography 2024 & 2032
- Figure 34: Thailand ASEAN Chemical Logistics Market Revenue (Million), by Country 2024 & 2032
- Figure 35: Thailand ASEAN Chemical Logistics Market Revenue Share (%), by Country 2024 & 2032
- Figure 36: Malaysia ASEAN Chemical Logistics Market Revenue (Million), by Service 2024 & 2032
- Figure 37: Malaysia ASEAN Chemical Logistics Market Revenue Share (%), by Service 2024 & 2032
- Figure 38: Malaysia ASEAN Chemical Logistics Market Revenue (Million), by Mode of Transportation 2024 & 2032
- Figure 39: Malaysia ASEAN Chemical Logistics Market Revenue Share (%), by Mode of Transportation 2024 & 2032
- Figure 40: Malaysia ASEAN Chemical Logistics Market Revenue (Million), by End User 2024 & 2032
- Figure 41: Malaysia ASEAN Chemical Logistics Market Revenue Share (%), by End User 2024 & 2032
- Figure 42: Malaysia ASEAN Chemical Logistics Market Revenue (Million), by Geography 2024 & 2032
- Figure 43: Malaysia ASEAN Chemical Logistics Market Revenue Share (%), by Geography 2024 & 2032
- Figure 44: Malaysia ASEAN Chemical Logistics Market Revenue (Million), by Country 2024 & 2032
- Figure 45: Malaysia ASEAN Chemical Logistics Market Revenue Share (%), by Country 2024 & 2032
- Figure 46: Vietnam ASEAN Chemical Logistics Market Revenue (Million), by Service 2024 & 2032
- Figure 47: Vietnam ASEAN Chemical Logistics Market Revenue Share (%), by Service 2024 & 2032
- Figure 48: Vietnam ASEAN Chemical Logistics Market Revenue (Million), by Mode of Transportation 2024 & 2032
- Figure 49: Vietnam ASEAN Chemical Logistics Market Revenue Share (%), by Mode of Transportation 2024 & 2032
- Figure 50: Vietnam ASEAN Chemical Logistics Market Revenue (Million), by End User 2024 & 2032
- Figure 51: Vietnam ASEAN Chemical Logistics Market Revenue Share (%), by End User 2024 & 2032
- Figure 52: Vietnam ASEAN Chemical Logistics Market Revenue (Million), by Geography 2024 & 2032
- Figure 53: Vietnam ASEAN Chemical Logistics Market Revenue Share (%), by Geography 2024 & 2032
- Figure 54: Vietnam ASEAN Chemical Logistics Market Revenue (Million), by Country 2024 & 2032
- Figure 55: Vietnam ASEAN Chemical Logistics Market Revenue Share (%), by Country 2024 & 2032
- Figure 56: Indonesia ASEAN Chemical Logistics Market Revenue (Million), by Service 2024 & 2032
- Figure 57: Indonesia ASEAN Chemical Logistics Market Revenue Share (%), by Service 2024 & 2032
- Figure 58: Indonesia ASEAN Chemical Logistics Market Revenue (Million), by Mode of Transportation 2024 & 2032
- Figure 59: Indonesia ASEAN Chemical Logistics Market Revenue Share (%), by Mode of Transportation 2024 & 2032
- Figure 60: Indonesia ASEAN Chemical Logistics Market Revenue (Million), by End User 2024 & 2032
- Figure 61: Indonesia ASEAN Chemical Logistics Market Revenue Share (%), by End User 2024 & 2032
- Figure 62: Indonesia ASEAN Chemical Logistics Market Revenue (Million), by Geography 2024 & 2032
- Figure 63: Indonesia ASEAN Chemical Logistics Market Revenue Share (%), by Geography 2024 & 2032
- Figure 64: Indonesia ASEAN Chemical Logistics Market Revenue (Million), by Country 2024 & 2032
- Figure 65: Indonesia ASEAN Chemical Logistics Market Revenue Share (%), by Country 2024 & 2032
- Figure 66: Philippines ASEAN Chemical Logistics Market Revenue (Million), by Service 2024 & 2032
- Figure 67: Philippines ASEAN Chemical Logistics Market Revenue Share (%), by Service 2024 & 2032
- Figure 68: Philippines ASEAN Chemical Logistics Market Revenue (Million), by Mode of Transportation 2024 & 2032
- Figure 69: Philippines ASEAN Chemical Logistics Market Revenue Share (%), by Mode of Transportation 2024 & 2032
- Figure 70: Philippines ASEAN Chemical Logistics Market Revenue (Million), by End User 2024 & 2032
- Figure 71: Philippines ASEAN Chemical Logistics Market Revenue Share (%), by End User 2024 & 2032
- Figure 72: Philippines ASEAN Chemical Logistics Market Revenue (Million), by Geography 2024 & 2032
- Figure 73: Philippines ASEAN Chemical Logistics Market Revenue Share (%), by Geography 2024 & 2032
- Figure 74: Philippines ASEAN Chemical Logistics Market Revenue (Million), by Country 2024 & 2032
- Figure 75: Philippines ASEAN Chemical Logistics Market Revenue Share (%), by Country 2024 & 2032
- Figure 76: Rest of ASEAN ASEAN Chemical Logistics Market Revenue (Million), by Service 2024 & 2032
- Figure 77: Rest of ASEAN ASEAN Chemical Logistics Market Revenue Share (%), by Service 2024 & 2032
- Figure 78: Rest of ASEAN ASEAN Chemical Logistics Market Revenue (Million), by Mode of Transportation 2024 & 2032
- Figure 79: Rest of ASEAN ASEAN Chemical Logistics Market Revenue Share (%), by Mode of Transportation 2024 & 2032
- Figure 80: Rest of ASEAN ASEAN Chemical Logistics Market Revenue (Million), by End User 2024 & 2032
- Figure 81: Rest of ASEAN ASEAN Chemical Logistics Market Revenue Share (%), by End User 2024 & 2032
- Figure 82: Rest of ASEAN ASEAN Chemical Logistics Market Revenue (Million), by Geography 2024 & 2032
- Figure 83: Rest of ASEAN ASEAN Chemical Logistics Market Revenue Share (%), by Geography 2024 & 2032
- Figure 84: Rest of ASEAN ASEAN Chemical Logistics Market Revenue (Million), by Country 2024 & 2032
- Figure 85: Rest of ASEAN ASEAN Chemical Logistics Market Revenue Share (%), by Country 2024 & 2032
List of Tables
- Table 1: Global ASEAN Chemical Logistics Market Revenue Million Forecast, by Region 2019 & 2032
- Table 2: Global ASEAN Chemical Logistics Market Revenue Million Forecast, by Service 2019 & 2032
- Table 3: Global ASEAN Chemical Logistics Market Revenue Million Forecast, by Mode of Transportation 2019 & 2032
- Table 4: Global ASEAN Chemical Logistics Market Revenue Million Forecast, by End User 2019 & 2032
- Table 5: Global ASEAN Chemical Logistics Market Revenue Million Forecast, by Geography 2019 & 2032
- Table 6: Global ASEAN Chemical Logistics Market Revenue Million Forecast, by Region 2019 & 2032
- Table 7: Global ASEAN Chemical Logistics Market Revenue Million Forecast, by Country 2019 & 2032
- Table 8: ASEAN Chemical Logistics Market Revenue (Million) Forecast, by Application 2019 & 2032
- Table 9: Global ASEAN Chemical Logistics Market Revenue Million Forecast, by Country 2019 & 2032
- Table 10: ASEAN Chemical Logistics Market Revenue (Million) Forecast, by Application 2019 & 2032
- Table 11: Global ASEAN Chemical Logistics Market Revenue Million Forecast, by Country 2019 & 2032
- Table 12: ASEAN Chemical Logistics Market Revenue (Million) Forecast, by Application 2019 & 2032
- Table 13: Global ASEAN Chemical Logistics Market Revenue Million Forecast, by Country 2019 & 2032
- Table 14: ASEAN Chemical Logistics Market Revenue (Million) Forecast, by Application 2019 & 2032
- Table 15: Global ASEAN Chemical Logistics Market Revenue Million Forecast, by Country 2019 & 2032
- Table 16: ASEAN Chemical Logistics Market Revenue (Million) Forecast, by Application 2019 & 2032
- Table 17: Global ASEAN Chemical Logistics Market Revenue Million Forecast, by Country 2019 & 2032
- Table 18: ASEAN Chemical Logistics Market Revenue (Million) Forecast, by Application 2019 & 2032
- Table 19: Global ASEAN Chemical Logistics Market Revenue Million Forecast, by Country 2019 & 2032
- Table 20: ASEAN Chemical Logistics Market Revenue (Million) Forecast, by Application 2019 & 2032
- Table 21: Global ASEAN Chemical Logistics Market Revenue Million Forecast, by Service 2019 & 2032
- Table 22: Global ASEAN Chemical Logistics Market Revenue Million Forecast, by Mode of Transportation 2019 & 2032
- Table 23: Global ASEAN Chemical Logistics Market Revenue Million Forecast, by End User 2019 & 2032
- Table 24: Global ASEAN Chemical Logistics Market Revenue Million Forecast, by Geography 2019 & 2032
- Table 25: Global ASEAN Chemical Logistics Market Revenue Million Forecast, by Country 2019 & 2032
- Table 26: Global ASEAN Chemical Logistics Market Revenue Million Forecast, by Service 2019 & 2032
- Table 27: Global ASEAN Chemical Logistics Market Revenue Million Forecast, by Mode of Transportation 2019 & 2032
- Table 28: Global ASEAN Chemical Logistics Market Revenue Million Forecast, by End User 2019 & 2032
- Table 29: Global ASEAN Chemical Logistics Market Revenue Million Forecast, by Geography 2019 & 2032
- Table 30: Global ASEAN Chemical Logistics Market Revenue Million Forecast, by Country 2019 & 2032
- Table 31: Global ASEAN Chemical Logistics Market Revenue Million Forecast, by Service 2019 & 2032
- Table 32: Global ASEAN Chemical Logistics Market Revenue Million Forecast, by Mode of Transportation 2019 & 2032
- Table 33: Global ASEAN Chemical Logistics Market Revenue Million Forecast, by End User 2019 & 2032
- Table 34: Global ASEAN Chemical Logistics Market Revenue Million Forecast, by Geography 2019 & 2032
- Table 35: Global ASEAN Chemical Logistics Market Revenue Million Forecast, by Country 2019 & 2032
- Table 36: Global ASEAN Chemical Logistics Market Revenue Million Forecast, by Service 2019 & 2032
- Table 37: Global ASEAN Chemical Logistics Market Revenue Million Forecast, by Mode of Transportation 2019 & 2032
- Table 38: Global ASEAN Chemical Logistics Market Revenue Million Forecast, by End User 2019 & 2032
- Table 39: Global ASEAN Chemical Logistics Market Revenue Million Forecast, by Geography 2019 & 2032
- Table 40: Global ASEAN Chemical Logistics Market Revenue Million Forecast, by Country 2019 & 2032
- Table 41: Global ASEAN Chemical Logistics Market Revenue Million Forecast, by Service 2019 & 2032
- Table 42: Global ASEAN Chemical Logistics Market Revenue Million Forecast, by Mode of Transportation 2019 & 2032
- Table 43: Global ASEAN Chemical Logistics Market Revenue Million Forecast, by End User 2019 & 2032
- Table 44: Global ASEAN Chemical Logistics Market Revenue Million Forecast, by Geography 2019 & 2032
- Table 45: Global ASEAN Chemical Logistics Market Revenue Million Forecast, by Country 2019 & 2032
- Table 46: Global ASEAN Chemical Logistics Market Revenue Million Forecast, by Service 2019 & 2032
- Table 47: Global ASEAN Chemical Logistics Market Revenue Million Forecast, by Mode of Transportation 2019 & 2032
- Table 48: Global ASEAN Chemical Logistics Market Revenue Million Forecast, by End User 2019 & 2032
- Table 49: Global ASEAN Chemical Logistics Market Revenue Million Forecast, by Geography 2019 & 2032
- Table 50: Global ASEAN Chemical Logistics Market Revenue Million Forecast, by Country 2019 & 2032
- Table 51: Global ASEAN Chemical Logistics Market Revenue Million Forecast, by Service 2019 & 2032
- Table 52: Global ASEAN Chemical Logistics Market Revenue Million Forecast, by Mode of Transportation 2019 & 2032
- Table 53: Global ASEAN Chemical Logistics Market Revenue Million Forecast, by End User 2019 & 2032
- Table 54: Global ASEAN Chemical Logistics Market Revenue Million Forecast, by Geography 2019 & 2032
- Table 55: Global ASEAN Chemical Logistics Market Revenue Million Forecast, by Country 2019 & 2032
Frequently Asked Questions
1. What is the projected Compound Annual Growth Rate (CAGR) of the ASEAN Chemical Logistics Market?
The projected CAGR is approximately > 5.50%.
2. Which companies are prominent players in the ASEAN Chemical Logistics Market?
Key companies in the market include DHL, A&R Logistics, JWD InfoLogistics Public Company Limited, Alps Logistics**List Not Exhaustive, CEVA Logistics, Agility Logistics, CT Logistics, Tiong Nam Logistics Holdings BhD, Eagles Air & Sea, BDP International, Rinchem, Rhenus Logistics.
3. What are the main segments of the ASEAN Chemical Logistics Market?
The market segments include Service, Mode of Transportation, End User, Geography.
4. Can you provide details about the market size?
The market size is estimated to be USD XX Million as of 2022.
5. What are some drivers contributing to market growth?
The Rise in Demand for Specialty Chemicals in ASEAN Countries Increasing Trade Logistics Activity; Partnerships and Collaborations Between Major Players in the Chemical Logistics Market are Being Formed for the Creation of Innovative Goods and Technologically Enhanced Services.
6. What are the notable trends driving market growth?
The Rise in Chemical Production is Expected to Propel the Growth of the Chemical Logistics Market.
7. Are there any restraints impacting market growth?
Complexities Related to Chemical Logistics; High Cost Involved in the Transportation of Chemicals.
8. Can you provide examples of recent developments in the market?
October 2022: Rinchem is nearing the completion of a brand-new chemical warehouse based in Malaysia slated to be ready in Q2 of 2023. While the company currently has two other warehouses in the Asia Pacific (Taiwan & South Korea), this will be Rinchem's first warehouse located in Malaysia. The 45,000 sq. ft. dangerous goods warehouse will have the capacity to store 3100 pallet positions. Rinchem's warehouses are custom-built to support the proper segregation of various hazard classes and to offer multiple temperature zones.
9. What pricing options are available for accessing the report?
Pricing options include single-user, multi-user, and enterprise licenses priced at USD 4750, USD 5250, and USD 8750 respectively.
10. Is the market size provided in terms of value or volume?
The market size is provided in terms of value, measured in Million.
11. Are there any specific market keywords associated with the report?
Yes, the market keyword associated with the report is "ASEAN Chemical Logistics Market," which aids in identifying and referencing the specific market segment covered.
12. How do I determine which pricing option suits my needs best?
The pricing options vary based on user requirements and access needs. Individual users may opt for single-user licenses, while businesses requiring broader access may choose multi-user or enterprise licenses for cost-effective access to the report.
13. Are there any additional resources or data provided in the ASEAN Chemical Logistics Market report?
While the report offers comprehensive insights, it's advisable to review the specific contents or supplementary materials provided to ascertain if additional resources or data are available.
14. How can I stay updated on further developments or reports in the ASEAN Chemical Logistics Market?
To stay informed about further developments, trends, and reports in the ASEAN Chemical Logistics Market, consider subscribing to industry newsletters, following relevant companies and organizations, or regularly checking reputable industry news sources and publications.
Methodology
Step 1 - Identification of Relevant Samples Size from Population Database


Step 2 - Approaches for Defining Global Market Size (Value, Volume* & Price*)

Note*: In applicable scenarios
Step 3 - Data Sources
Primary Research
- Web Analytics
- Survey Reports
- Research Institute
- Latest Research Reports
- Opinion Leaders
Secondary Research
- Annual Reports
- White Paper
- Latest Press Release
- Industry Association
- Paid Database
- Investor Presentations

Step 4 - Data Triangulation
Involves using different sources of information in order to increase the validity of a study
These sources are likely to be stakeholders in a program - participants, other researchers, program staff, other community members, and so on.
Then we put all data in single framework & apply various statistical tools to find out the dynamic on the market.
During the analysis stage, feedback from the stakeholder groups would be compared to determine areas of agreement as well as areas of divergence
