

Key Insights
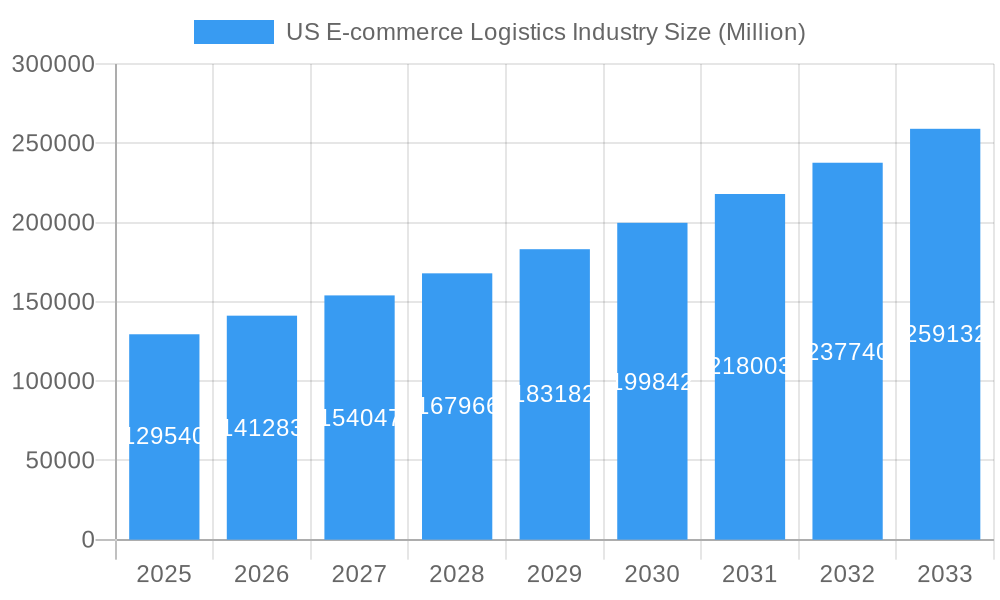
The US e-commerce logistics industry is experiencing robust growth, fueled by the ever-increasing popularity of online shopping and the demand for efficient and reliable delivery services. The market, valued at $129.54 billion in 2025, is projected to maintain a Compound Annual Growth Rate (CAGR) of 8.90% from 2025 to 2033. This expansion is driven by several key factors. Firstly, the continuous rise in online retail sales across diverse product categories, including fashion and apparel, consumer electronics, and home appliances, necessitates a robust logistics infrastructure. Secondly, consumer expectations for faster and more convenient delivery options, such as same-day and next-day delivery, are pushing logistics providers to innovate and invest in advanced technologies like automation and data analytics. Finally, the growth of cross-border e-commerce is opening new avenues for expansion, requiring sophisticated logistics solutions to manage international shipments and customs regulations. The market is segmented by service type (transportation, warehousing, value-added services), business model (B2B, B2C), destination (domestic, international), and product type, reflecting the diverse needs of the e-commerce ecosystem. Major players like DHL, FedEx, UPS, and others are constantly vying for market share through strategic partnerships, technological advancements, and expansion of their service offerings. The regional distribution across the United States – Northeast, Southeast, Midwest, Southwest, and West – reflects varying population density and consumer behavior patterns, influencing the concentration of logistics activities.
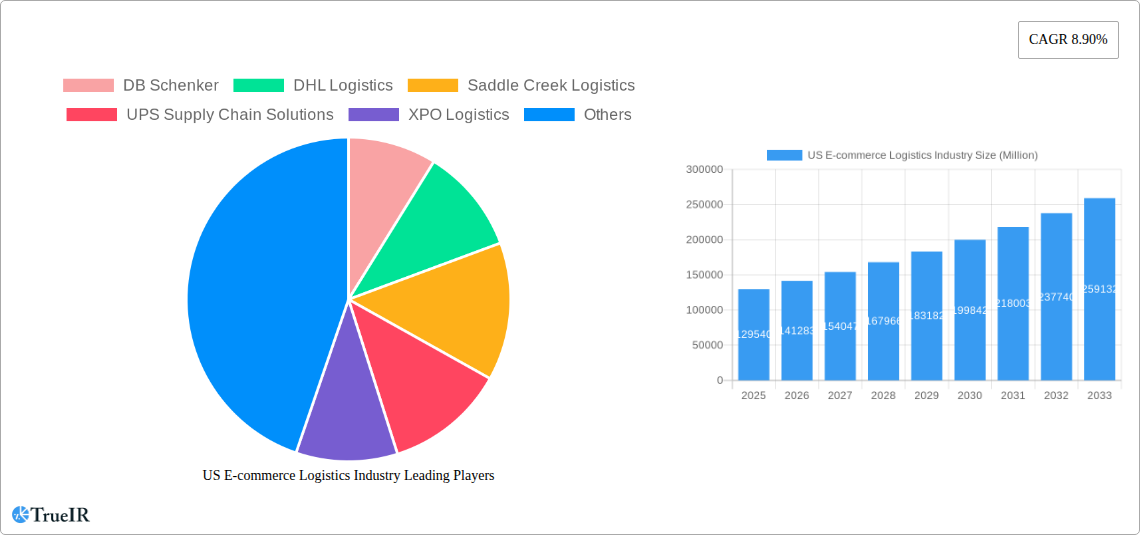
US E-commerce Logistics Industry Market Size (In Billion)
The competitive landscape is highly dynamic, with established players facing challenges from emerging tech-driven logistics companies and specialized niche providers. Sustained growth will depend on the industry's ability to address ongoing challenges, including labor shortages, rising fuel costs, and the need to optimize supply chains for greater efficiency and resilience. Future growth will likely be shaped by the adoption of sustainable practices, advancements in automation and artificial intelligence, and the continued focus on enhancing the customer experience through real-time tracking and transparent delivery updates. The increasing focus on last-mile delivery optimization and the expansion of delivery options, such as click-and-collect services and locker systems, will further define the trajectory of this rapidly evolving market.
US E-commerce Logistics Industry Company Market Share
US E-commerce Logistics Industry Market Report: 2019-2033
This comprehensive report provides a detailed analysis of the US e-commerce logistics industry, encompassing market size, trends, competitive landscape, and future outlook. With a study period spanning 2019-2033, a base year of 2025, and a forecast period of 2025-2033, this report offers invaluable insights for businesses, investors, and policymakers operating within this dynamic sector. The report leverages extensive market research and data analysis to provide a clear, concise, and actionable understanding of this multi-billion dollar market.
US E-commerce Logistics Industry Market Structure & Competitive Landscape
The US e-commerce logistics industry is a dynamic and multifaceted sector, shaped by the strategic operations of global giants and agile, specialized providers. Market concentration is notably moderate, with a handful of dominant entities capturing a substantial market share while a vast ecosystem of smaller firms innovates and thrives in niche segments. This industry is a hotbed of innovation, propelled by rapid advancements in automation, sophisticated data analytics for predictive insights and operational optimization, and a growing imperative for sustainable logistics practices. Stringent regulatory frameworks governing safety, data security, and environmental responsibility exert a significant influence on operational strategies and associated costs. Competitive pressures also stem from the potential for large retailers to develop in-house logistics capabilities, acting as a form of product substitute. The industry serves a diverse clientele, catering to B2B, B2C, domestic, and international e-commerce enterprises across a wide spectrum of product categories. Continuous merger and acquisition (M&A) activity is a hallmark of this market, as key players strategically expand their reach, enhance their service portfolios, and consolidate their positions.
- Market Concentration: The Herfindahl-Hirschman Index (HHI) is estimated at approximately [Insert HHI Value Here], signifying a moderately concentrated market with room for competitive differentiation.
- M&A Activity: An estimated $[Insert M&A Deal Value Here] Million in M&A deals were finalized in the historical period (2019-2024). Projections for the forecast period (2025-2033) anticipate a further $[Insert Projected M&A Deal Value Here] Million in strategic transactions.
- Innovation Drivers: Key catalysts for innovation include advanced automation (e.g., robotics, AI integration), sophisticated data analytics for predictive modeling and route optimization, and the development of sustainable logistics solutions (e.g., green technologies, carbon offsetting initiatives).
- Regulatory Impacts: Compliance with evolving regulations related to transportation safety, data privacy (e.g., CCPA, CPRA), and environmental protection plays a critical role in shaping operational expenditures and strategic decision-making.
US E-commerce Logistics Industry Market Trends & Opportunities
The US e-commerce logistics market is on a trajectory of robust and sustained growth, propelled by the relentless expansion of online retail, escalating consumer expectations for expedited and convenient delivery services, and continuous technological breakthroughs. The estimated market size for 2025 stands at $[Insert Market Size Here] Million, with a projected Compound Annual Growth Rate (CAGR) of [Insert CAGR Here]% anticipated throughout the forecast period (2025-2033). This significant expansion is underpinned by several pivotal trends:
- Technological Shifts: The widespread adoption of automation, artificial intelligence (AI), and big data analytics is revolutionizing warehouse management, route optimization, and last-mile delivery networks. The burgeoning potential of autonomous vehicles and drone delivery presents compelling opportunities for enhanced efficiency and substantial cost reductions.
- Consumer Preferences: A pronounced consumer demand for faster delivery options, including same-day and next-day services, is a primary driver for substantial investments in advanced logistics infrastructure and cutting-edge technologies. Transparency and real-time tracking capabilities are also paramount for customer satisfaction.
- Competitive Dynamics: The fierce competition between established industry leaders and agile startups is fostering a climate of continuous innovation and price optimization, ultimately benefiting the end consumer. Strategic consolidation through mergers and acquisitions is also actively reshaping the competitive landscape.
Dominant Markets & Segments in US E-commerce Logistics Industry
The US e-commerce logistics market is geographically diverse, with significant activity across all regions. However, the highest growth is observed in major metropolitan areas and population centers due to high consumer density and robust e-commerce activity. Among segments, the B2C segment dominates due to the high volume of individual online purchases. Domestic logistics accounts for the largest share of the market, followed by cross-border shipments. High-volume product categories like Fashion and Apparel, Consumer Electronics, and Home Appliances are major drivers of growth.
- By Service: Warehousing and inventory management represent the largest segment due to the increasing need for efficient storage and fulfillment capabilities.
- By Business: B2C dominates due to the high volume of online purchases made by individual consumers.
- By Destination: Domestic logistics is the largest segment, due to the large domestic market and e-commerce penetration.
- By Product: Fashion and Apparel and Consumer Electronics are the highest-volume product categories.
Key Growth Drivers:
- Robust e-commerce growth and increasing online penetration.
- Technological advancements driving efficiency and cost reductions.
- Government initiatives promoting infrastructure development and logistics modernization.
US E-commerce Logistics Industry Product Analysis
The industry offers a wide range of services, including transportation, warehousing, inventory management, and value-added services like labeling and packaging. Recent innovations focus on enhancing efficiency, transparency, and sustainability through automation, advanced tracking systems, and green logistics solutions. Companies are competing on speed, reliability, cost-effectiveness, and advanced technological capabilities. The market fit for these innovations is high, given consumer demands for faster and more reliable delivery, coupled with growing environmental concerns.
Key Drivers, Barriers & Challenges in US E-commerce Logistics Industry
Key Drivers:
- The exponential growth of e-commerce, fueled by increasing internet penetration and widespread consumer adoption of online purchasing behaviors.
- Pioneering technological innovations in automation, AI, and data analytics are driving significant improvements in operational efficiency and cost optimization.
- Supportive government initiatives aimed at fostering infrastructure development and modernizing logistics networks are providing a favorable environment for growth.
Challenges:
- Escalating labor costs and persistent driver shortages are creating significant pressure on delivery timelines and overall operational expenses. A [Insert Labor Cost Increase]% increase in labor costs was observed in 2024, directly impacting the profitability of logistics companies.
- Disruptions within the supply chain and heightened transportation costs, exacerbated by fuel price volatility, are posing substantial risks to profitability. Fuel prices experienced a [Insert Fuel Price Increase]% surge in 2024, affecting the entire sector's cost structure.
- The increasing complexity and scope of regulatory requirements and compliance mandates are adding to operational overhead and administrative burdens.
Growth Drivers in the US E-commerce Logistics Industry Market
The US e-commerce logistics industry’s growth is driven by the rapid expansion of e-commerce, technological advancements such as automation and AI, and supportive government policies aimed at improving infrastructure and streamlining logistics processes. The increasing demand for faster and more reliable delivery options is also a significant growth driver, prompting investments in new technologies and infrastructure.
Challenges Impacting US E-commerce Logistics Industry Growth
Critical challenges that continue to exert pressure on the growth of the US e-commerce logistics industry include widespread labor shortages, the escalating cost of fuel, and persistent vulnerabilities within the global supply chain. Navigating increasingly complex regulatory landscapes and adhering to stringent compliance requirements further compound operational complexities and elevate costs. The intense competitive arena, characterized by the ongoing rivalry between established incumbents and emerging disruptors, places additional strain on profit margins across the sector.
Key Players Shaping the US E-commerce Logistics Industry Market
- DB Schenker
- DHL Logistics
- Saddle Creek Logistics
- UPS Supply Chain Solutions
- XPO Logistics
- Rakuten Super Logistics
- FedEx
- Geodis Logistics
- Kenco Logistics Services
- Kuehne and Nagel Logistics (This list is representative and not exhaustive)
Significant US E-commerce Logistics Industry Milestones
- August 2023: DHL eCommerce opened a new 352,000 sq ft distribution center in Melrose Park, Illinois, featuring an automated sorter capable of handling 40,000 parcels per hour. This is part of a larger expansion plan involving 11 new/relocated warehouses, with 7 more planned.
- April 2023: DHL Express launched GoGreen Plus, expanding sustainable shipping services for US SMEs by offering carbon footprint offsetting through Sustainable Aviation Fuel.
Future Outlook for US E-commerce Logistics Industry Market
The US e-commerce logistics industry is poised for continued growth, driven by the persistent expansion of online retail, ongoing technological advancements, and the increasing demand for seamless and sustainable logistics solutions. Strategic investments in automation, data analytics, and sustainable practices will be crucial for companies to maintain a competitive edge and capitalize on emerging opportunities within this dynamic market. The market is expected to witness further consolidation through mergers and acquisitions, shaping the competitive landscape in the coming years.
US E-commerce Logistics Industry Segmentation
-
1. Service
- 1.1. Transportation
- 1.2. Warehousing and Inventory management
- 1.3. Value-added services (Labeling, Packaging, etc)
-
2. Business
- 2.1. B2B
- 2.2. B2C
-
3. Destination
- 3.1. Domestic
- 3.2. International/cross-border
-
4. Product
- 4.1. Fashion and Apparel
- 4.2. Consumer Electronics
- 4.3. Home Appliances
- 4.4. Furniture
- 4.5. Beauty and Personal Care Products
- 4.6. Other Products (Toys, Food Products, etc.)
US E-commerce Logistics Industry Segmentation By Geography
-
1. North America
- 1.1. United States
- 1.2. Canada
- 1.3. Mexico
-
2. South America
- 2.1. Brazil
- 2.2. Argentina
- 2.3. Rest of South America
-
3. Europe
- 3.1. United Kingdom
- 3.2. Germany
- 3.3. France
- 3.4. Italy
- 3.5. Spain
- 3.6. Russia
- 3.7. Benelux
- 3.8. Nordics
- 3.9. Rest of Europe
-
4. Middle East & Africa
- 4.1. Turkey
- 4.2. Israel
- 4.3. GCC
- 4.4. North Africa
- 4.5. South Africa
- 4.6. Rest of Middle East & Africa
-
5. Asia Pacific
- 5.1. China
- 5.2. India
- 5.3. Japan
- 5.4. South Korea
- 5.5. ASEAN
- 5.6. Oceania
- 5.7. Rest of Asia Pacific
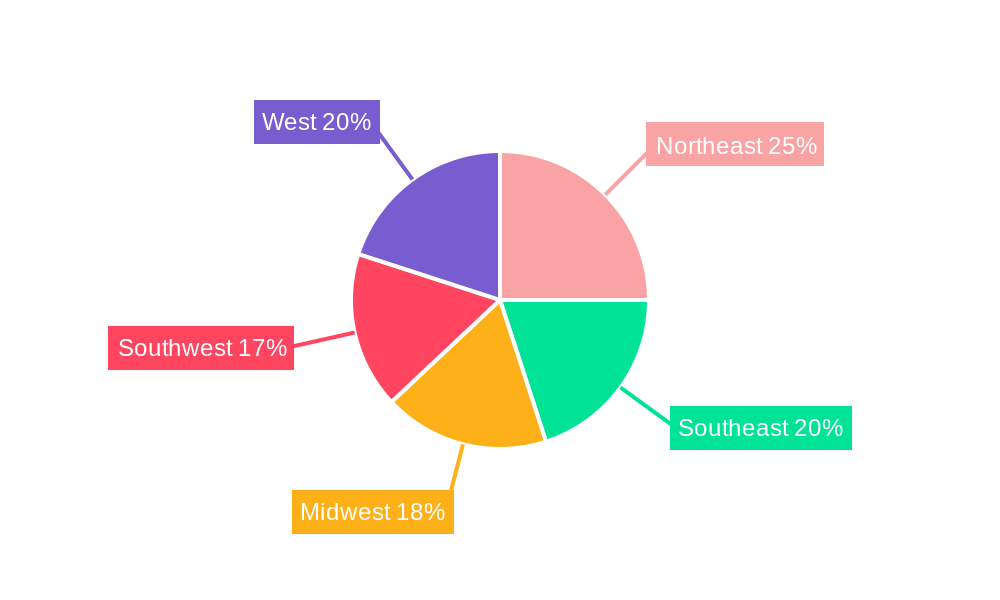
US E-commerce Logistics Industry Regional Market Share
Geographic Coverage of US E-commerce Logistics Industry
US E-commerce Logistics Industry REPORT HIGHLIGHTS
| Aspects | Details |
|---|---|
| Study Period | 2020-2034 |
| Base Year | 2025 |
| Estimated Year | 2026 |
| Forecast Period | 2026-2034 |
| Historical Period | 2020-2025 |
| Growth Rate | CAGR of 8.90% from 2020-2034 |
| Segmentation |
|
Table of Contents
- 1. Introduction
- 1.1. Research Scope
- 1.2. Market Segmentation
- 1.3. Research Objective
- 1.4. Definitions and Assumptions
- 2. Executive Summary
- 2.1. Market Snapshot
- 3. Market Dynamics
- 3.1. Market Drivers
- 3.2. Market Restrains
- 3.3. Market Trends
- 3.4. Market Opportunities
- 4. Market Factor Analysis
- 4.1. Porters Five Forces
- 4.1.1. Bargaining Power of Suppliers
- 4.1.2. Bargaining Power of Buyers
- 4.1.3. Threat of New Entrants
- 4.1.4. Threat of Substitutes
- 4.1.5. Competitive Rivalry
- 4.2. PESTEL analysis
- 4.3. BCG Analysis
- 4.3.1. Stars (High Growth, High Market Share)
- 4.3.2. Cash Cows (Low Growth, High Market Share)
- 4.3.3. Question Mark (High Growth, Low Market Share)
- 4.3.4. Dogs (Low Growth, Low Market Share)
- 4.4. Ansoff Matrix Analysis
- 4.5. Supply Chain Analysis
- 4.6. Regulatory Landscape
- 4.7. Current Market Potential and Opportunity Assessment (TAM–SAM–SOM Framework)
- 4.8. TIR Analyst Note
- 4.1. Porters Five Forces
- 5. Market Analysis, Insights and Forecast 2021-2033
- 5.1. Market Analysis, Insights and Forecast - by Service
- 5.1.1. Transportation
- 5.1.2. Warehousing and Inventory management
- 5.1.3. Value-added services (Labeling, Packaging, etc)
- 5.2. Market Analysis, Insights and Forecast - by Business
- 5.2.1. B2B
- 5.2.2. B2C
- 5.3. Market Analysis, Insights and Forecast - by Destination
- 5.3.1. Domestic
- 5.3.2. International/cross-border
- 5.4. Market Analysis, Insights and Forecast - by Product
- 5.4.1. Fashion and Apparel
- 5.4.2. Consumer Electronics
- 5.4.3. Home Appliances
- 5.4.4. Furniture
- 5.4.5. Beauty and Personal Care Products
- 5.4.6. Other Products (Toys, Food Products, etc.)
- 5.5. Market Analysis, Insights and Forecast - by Region
- 5.5.1. North America
- 5.5.2. South America
- 5.5.3. Europe
- 5.5.4. Middle East & Africa
- 5.5.5. Asia Pacific
- 5.1. Market Analysis, Insights and Forecast - by Service
- 6. Global US E-commerce Logistics Industry Analysis, Insights and Forecast, 2021-2033
- 6.1. Market Analysis, Insights and Forecast - by Service
- 6.1.1. Transportation
- 6.1.2. Warehousing and Inventory management
- 6.1.3. Value-added services (Labeling, Packaging, etc)
- 6.2. Market Analysis, Insights and Forecast - by Business
- 6.2.1. B2B
- 6.2.2. B2C
- 6.3. Market Analysis, Insights and Forecast - by Destination
- 6.3.1. Domestic
- 6.3.2. International/cross-border
- 6.4. Market Analysis, Insights and Forecast - by Product
- 6.4.1. Fashion and Apparel
- 6.4.2. Consumer Electronics
- 6.4.3. Home Appliances
- 6.4.4. Furniture
- 6.4.5. Beauty and Personal Care Products
- 6.4.6. Other Products (Toys, Food Products, etc.)
- 6.1. Market Analysis, Insights and Forecast - by Service
- 7. North America US E-commerce Logistics Industry Analysis, Insights and Forecast, 2020-2032
- 7.1. Market Analysis, Insights and Forecast - by Service
- 7.1.1. Transportation
- 7.1.2. Warehousing and Inventory management
- 7.1.3. Value-added services (Labeling, Packaging, etc)
- 7.2. Market Analysis, Insights and Forecast - by Business
- 7.2.1. B2B
- 7.2.2. B2C
- 7.3. Market Analysis, Insights and Forecast - by Destination
- 7.3.1. Domestic
- 7.3.2. International/cross-border
- 7.4. Market Analysis, Insights and Forecast - by Product
- 7.4.1. Fashion and Apparel
- 7.4.2. Consumer Electronics
- 7.4.3. Home Appliances
- 7.4.4. Furniture
- 7.4.5. Beauty and Personal Care Products
- 7.4.6. Other Products (Toys, Food Products, etc.)
- 7.1. Market Analysis, Insights and Forecast - by Service
- 8. South America US E-commerce Logistics Industry Analysis, Insights and Forecast, 2020-2032
- 8.1. Market Analysis, Insights and Forecast - by Service
- 8.1.1. Transportation
- 8.1.2. Warehousing and Inventory management
- 8.1.3. Value-added services (Labeling, Packaging, etc)
- 8.2. Market Analysis, Insights and Forecast - by Business
- 8.2.1. B2B
- 8.2.2. B2C
- 8.3. Market Analysis, Insights and Forecast - by Destination
- 8.3.1. Domestic
- 8.3.2. International/cross-border
- 8.4. Market Analysis, Insights and Forecast - by Product
- 8.4.1. Fashion and Apparel
- 8.4.2. Consumer Electronics
- 8.4.3. Home Appliances
- 8.4.4. Furniture
- 8.4.5. Beauty and Personal Care Products
- 8.4.6. Other Products (Toys, Food Products, etc.)
- 8.1. Market Analysis, Insights and Forecast - by Service
- 9. Europe US E-commerce Logistics Industry Analysis, Insights and Forecast, 2020-2032
- 9.1. Market Analysis, Insights and Forecast - by Service
- 9.1.1. Transportation
- 9.1.2. Warehousing and Inventory management
- 9.1.3. Value-added services (Labeling, Packaging, etc)
- 9.2. Market Analysis, Insights and Forecast - by Business
- 9.2.1. B2B
- 9.2.2. B2C
- 9.3. Market Analysis, Insights and Forecast - by Destination
- 9.3.1. Domestic
- 9.3.2. International/cross-border
- 9.4. Market Analysis, Insights and Forecast - by Product
- 9.4.1. Fashion and Apparel
- 9.4.2. Consumer Electronics
- 9.4.3. Home Appliances
- 9.4.4. Furniture
- 9.4.5. Beauty and Personal Care Products
- 9.4.6. Other Products (Toys, Food Products, etc.)
- 9.1. Market Analysis, Insights and Forecast - by Service
- 10. Middle East & Africa US E-commerce Logistics Industry Analysis, Insights and Forecast, 2020-2032
- 10.1. Market Analysis, Insights and Forecast - by Service
- 10.1.1. Transportation
- 10.1.2. Warehousing and Inventory management
- 10.1.3. Value-added services (Labeling, Packaging, etc)
- 10.2. Market Analysis, Insights and Forecast - by Business
- 10.2.1. B2B
- 10.2.2. B2C
- 10.3. Market Analysis, Insights and Forecast - by Destination
- 10.3.1. Domestic
- 10.3.2. International/cross-border
- 10.4. Market Analysis, Insights and Forecast - by Product
- 10.4.1. Fashion and Apparel
- 10.4.2. Consumer Electronics
- 10.4.3. Home Appliances
- 10.4.4. Furniture
- 10.4.5. Beauty and Personal Care Products
- 10.4.6. Other Products (Toys, Food Products, etc.)
- 10.1. Market Analysis, Insights and Forecast - by Service
- 11. Asia Pacific US E-commerce Logistics Industry Analysis, Insights and Forecast, 2020-2032
- 11.1. Market Analysis, Insights and Forecast - by Service
- 11.1.1. Transportation
- 11.1.2. Warehousing and Inventory management
- 11.1.3. Value-added services (Labeling, Packaging, etc)
- 11.2. Market Analysis, Insights and Forecast - by Business
- 11.2.1. B2B
- 11.2.2. B2C
- 11.3. Market Analysis, Insights and Forecast - by Destination
- 11.3.1. Domestic
- 11.3.2. International/cross-border
- 11.4. Market Analysis, Insights and Forecast - by Product
- 11.4.1. Fashion and Apparel
- 11.4.2. Consumer Electronics
- 11.4.3. Home Appliances
- 11.4.4. Furniture
- 11.4.5. Beauty and Personal Care Products
- 11.4.6. Other Products (Toys, Food Products, etc.)
- 11.1. Market Analysis, Insights and Forecast - by Service
- 12. Competitive Analysis
- 12.1. Company Profiles
- 12.1.1 DB Schenker
- 12.1.1.1. Company Overview
- 12.1.1.2. Products
- 12.1.1.3. Company Financials
- 12.1.1.4. SWOT Analysis
- 12.1.2 DHL Logistics
- 12.1.2.1. Company Overview
- 12.1.2.2. Products
- 12.1.2.3. Company Financials
- 12.1.2.4. SWOT Analysis
- 12.1.3 Saddle Creek Logistics
- 12.1.3.1. Company Overview
- 12.1.3.2. Products
- 12.1.3.3. Company Financials
- 12.1.3.4. SWOT Analysis
- 12.1.4 UPS Supply Chain Solutions
- 12.1.4.1. Company Overview
- 12.1.4.2. Products
- 12.1.4.3. Company Financials
- 12.1.4.4. SWOT Analysis
- 12.1.5 XPO Logistics
- 12.1.5.1. Company Overview
- 12.1.5.2. Products
- 12.1.5.3. Company Financials
- 12.1.5.4. SWOT Analysis
- 12.1.6 Rakuten Super Logistics
- 12.1.6.1. Company Overview
- 12.1.6.2. Products
- 12.1.6.3. Company Financials
- 12.1.6.4. SWOT Analysis
- 12.1.7 FedEx
- 12.1.7.1. Company Overview
- 12.1.7.2. Products
- 12.1.7.3. Company Financials
- 12.1.7.4. SWOT Analysis
- 12.1.8 Geodis Logistics
- 12.1.8.1. Company Overview
- 12.1.8.2. Products
- 12.1.8.3. Company Financials
- 12.1.8.4. SWOT Analysis
- 12.1.9 Kenco Logistics Services
- 12.1.9.1. Company Overview
- 12.1.9.2. Products
- 12.1.9.3. Company Financials
- 12.1.9.4. SWOT Analysis
- 12.1.10 Kuehne and Nagel Logistics**List Not Exhaustive
- 12.1.10.1. Company Overview
- 12.1.10.2. Products
- 12.1.10.3. Company Financials
- 12.1.10.4. SWOT Analysis
- 12.1.1 DB Schenker
- 12.2. Market Entropy
- 12.2.1 Company's Key Areas Served
- 12.2.2 Recent Developments
- 12.3. Company Market Share Analysis 2025
- 12.3.1 Top 5 Companies Market Share Analysis
- 12.3.2 Top 3 Companies Market Share Analysis
- 12.4. List of Potential Customers
- 13. Research Methodology
List of Figures
- Figure 1: Global US E-commerce Logistics Industry Revenue Breakdown (Million, %) by Region 2025 & 2033
- Figure 2: North America US E-commerce Logistics Industry Revenue (Million), by Service 2025 & 2033
- Figure 3: North America US E-commerce Logistics Industry Revenue Share (%), by Service 2025 & 2033
- Figure 4: North America US E-commerce Logistics Industry Revenue (Million), by Business 2025 & 2033
- Figure 5: North America US E-commerce Logistics Industry Revenue Share (%), by Business 2025 & 2033
- Figure 6: North America US E-commerce Logistics Industry Revenue (Million), by Destination 2025 & 2033
- Figure 7: North America US E-commerce Logistics Industry Revenue Share (%), by Destination 2025 & 2033
- Figure 8: North America US E-commerce Logistics Industry Revenue (Million), by Product 2025 & 2033
- Figure 9: North America US E-commerce Logistics Industry Revenue Share (%), by Product 2025 & 2033
- Figure 10: North America US E-commerce Logistics Industry Revenue (Million), by Country 2025 & 2033
- Figure 11: North America US E-commerce Logistics Industry Revenue Share (%), by Country 2025 & 2033
- Figure 12: South America US E-commerce Logistics Industry Revenue (Million), by Service 2025 & 2033
- Figure 13: South America US E-commerce Logistics Industry Revenue Share (%), by Service 2025 & 2033
- Figure 14: South America US E-commerce Logistics Industry Revenue (Million), by Business 2025 & 2033
- Figure 15: South America US E-commerce Logistics Industry Revenue Share (%), by Business 2025 & 2033
- Figure 16: South America US E-commerce Logistics Industry Revenue (Million), by Destination 2025 & 2033
- Figure 17: South America US E-commerce Logistics Industry Revenue Share (%), by Destination 2025 & 2033
- Figure 18: South America US E-commerce Logistics Industry Revenue (Million), by Product 2025 & 2033
- Figure 19: South America US E-commerce Logistics Industry Revenue Share (%), by Product 2025 & 2033
- Figure 20: South America US E-commerce Logistics Industry Revenue (Million), by Country 2025 & 2033
- Figure 21: South America US E-commerce Logistics Industry Revenue Share (%), by Country 2025 & 2033
- Figure 22: Europe US E-commerce Logistics Industry Revenue (Million), by Service 2025 & 2033
- Figure 23: Europe US E-commerce Logistics Industry Revenue Share (%), by Service 2025 & 2033
- Figure 24: Europe US E-commerce Logistics Industry Revenue (Million), by Business 2025 & 2033
- Figure 25: Europe US E-commerce Logistics Industry Revenue Share (%), by Business 2025 & 2033
- Figure 26: Europe US E-commerce Logistics Industry Revenue (Million), by Destination 2025 & 2033
- Figure 27: Europe US E-commerce Logistics Industry Revenue Share (%), by Destination 2025 & 2033
- Figure 28: Europe US E-commerce Logistics Industry Revenue (Million), by Product 2025 & 2033
- Figure 29: Europe US E-commerce Logistics Industry Revenue Share (%), by Product 2025 & 2033
- Figure 30: Europe US E-commerce Logistics Industry Revenue (Million), by Country 2025 & 2033
- Figure 31: Europe US E-commerce Logistics Industry Revenue Share (%), by Country 2025 & 2033
- Figure 32: Middle East & Africa US E-commerce Logistics Industry Revenue (Million), by Service 2025 & 2033
- Figure 33: Middle East & Africa US E-commerce Logistics Industry Revenue Share (%), by Service 2025 & 2033
- Figure 34: Middle East & Africa US E-commerce Logistics Industry Revenue (Million), by Business 2025 & 2033
- Figure 35: Middle East & Africa US E-commerce Logistics Industry Revenue Share (%), by Business 2025 & 2033
- Figure 36: Middle East & Africa US E-commerce Logistics Industry Revenue (Million), by Destination 2025 & 2033
- Figure 37: Middle East & Africa US E-commerce Logistics Industry Revenue Share (%), by Destination 2025 & 2033
- Figure 38: Middle East & Africa US E-commerce Logistics Industry Revenue (Million), by Product 2025 & 2033
- Figure 39: Middle East & Africa US E-commerce Logistics Industry Revenue Share (%), by Product 2025 & 2033
- Figure 40: Middle East & Africa US E-commerce Logistics Industry Revenue (Million), by Country 2025 & 2033
- Figure 41: Middle East & Africa US E-commerce Logistics Industry Revenue Share (%), by Country 2025 & 2033
- Figure 42: Asia Pacific US E-commerce Logistics Industry Revenue (Million), by Service 2025 & 2033
- Figure 43: Asia Pacific US E-commerce Logistics Industry Revenue Share (%), by Service 2025 & 2033
- Figure 44: Asia Pacific US E-commerce Logistics Industry Revenue (Million), by Business 2025 & 2033
- Figure 45: Asia Pacific US E-commerce Logistics Industry Revenue Share (%), by Business 2025 & 2033
- Figure 46: Asia Pacific US E-commerce Logistics Industry Revenue (Million), by Destination 2025 & 2033
- Figure 47: Asia Pacific US E-commerce Logistics Industry Revenue Share (%), by Destination 2025 & 2033
- Figure 48: Asia Pacific US E-commerce Logistics Industry Revenue (Million), by Product 2025 & 2033
- Figure 49: Asia Pacific US E-commerce Logistics Industry Revenue Share (%), by Product 2025 & 2033
- Figure 50: Asia Pacific US E-commerce Logistics Industry Revenue (Million), by Country 2025 & 2033
- Figure 51: Asia Pacific US E-commerce Logistics Industry Revenue Share (%), by Country 2025 & 2033
List of Tables
- Table 1: Global US E-commerce Logistics Industry Revenue Million Forecast, by Service 2020 & 2033
- Table 2: Global US E-commerce Logistics Industry Revenue Million Forecast, by Business 2020 & 2033
- Table 3: Global US E-commerce Logistics Industry Revenue Million Forecast, by Destination 2020 & 2033
- Table 4: Global US E-commerce Logistics Industry Revenue Million Forecast, by Product 2020 & 2033
- Table 5: Global US E-commerce Logistics Industry Revenue Million Forecast, by Region 2020 & 2033
- Table 6: Global US E-commerce Logistics Industry Revenue Million Forecast, by Service 2020 & 2033
- Table 7: Global US E-commerce Logistics Industry Revenue Million Forecast, by Business 2020 & 2033
- Table 8: Global US E-commerce Logistics Industry Revenue Million Forecast, by Destination 2020 & 2033
- Table 9: Global US E-commerce Logistics Industry Revenue Million Forecast, by Product 2020 & 2033
- Table 10: Global US E-commerce Logistics Industry Revenue Million Forecast, by Country 2020 & 2033
- Table 11: United States US E-commerce Logistics Industry Revenue (Million) Forecast, by Application 2020 & 2033
- Table 12: Canada US E-commerce Logistics Industry Revenue (Million) Forecast, by Application 2020 & 2033
- Table 13: Mexico US E-commerce Logistics Industry Revenue (Million) Forecast, by Application 2020 & 2033
- Table 14: Global US E-commerce Logistics Industry Revenue Million Forecast, by Service 2020 & 2033
- Table 15: Global US E-commerce Logistics Industry Revenue Million Forecast, by Business 2020 & 2033
- Table 16: Global US E-commerce Logistics Industry Revenue Million Forecast, by Destination 2020 & 2033
- Table 17: Global US E-commerce Logistics Industry Revenue Million Forecast, by Product 2020 & 2033
- Table 18: Global US E-commerce Logistics Industry Revenue Million Forecast, by Country 2020 & 2033
- Table 19: Brazil US E-commerce Logistics Industry Revenue (Million) Forecast, by Application 2020 & 2033
- Table 20: Argentina US E-commerce Logistics Industry Revenue (Million) Forecast, by Application 2020 & 2033
- Table 21: Rest of South America US E-commerce Logistics Industry Revenue (Million) Forecast, by Application 2020 & 2033
- Table 22: Global US E-commerce Logistics Industry Revenue Million Forecast, by Service 2020 & 2033
- Table 23: Global US E-commerce Logistics Industry Revenue Million Forecast, by Business 2020 & 2033
- Table 24: Global US E-commerce Logistics Industry Revenue Million Forecast, by Destination 2020 & 2033
- Table 25: Global US E-commerce Logistics Industry Revenue Million Forecast, by Product 2020 & 2033
- Table 26: Global US E-commerce Logistics Industry Revenue Million Forecast, by Country 2020 & 2033
- Table 27: United Kingdom US E-commerce Logistics Industry Revenue (Million) Forecast, by Application 2020 & 2033
- Table 28: Germany US E-commerce Logistics Industry Revenue (Million) Forecast, by Application 2020 & 2033
- Table 29: France US E-commerce Logistics Industry Revenue (Million) Forecast, by Application 2020 & 2033
- Table 30: Italy US E-commerce Logistics Industry Revenue (Million) Forecast, by Application 2020 & 2033
- Table 31: Spain US E-commerce Logistics Industry Revenue (Million) Forecast, by Application 2020 & 2033
- Table 32: Russia US E-commerce Logistics Industry Revenue (Million) Forecast, by Application 2020 & 2033
- Table 33: Benelux US E-commerce Logistics Industry Revenue (Million) Forecast, by Application 2020 & 2033
- Table 34: Nordics US E-commerce Logistics Industry Revenue (Million) Forecast, by Application 2020 & 2033
- Table 35: Rest of Europe US E-commerce Logistics Industry Revenue (Million) Forecast, by Application 2020 & 2033
- Table 36: Global US E-commerce Logistics Industry Revenue Million Forecast, by Service 2020 & 2033
- Table 37: Global US E-commerce Logistics Industry Revenue Million Forecast, by Business 2020 & 2033
- Table 38: Global US E-commerce Logistics Industry Revenue Million Forecast, by Destination 2020 & 2033
- Table 39: Global US E-commerce Logistics Industry Revenue Million Forecast, by Product 2020 & 2033
- Table 40: Global US E-commerce Logistics Industry Revenue Million Forecast, by Country 2020 & 2033
- Table 41: Turkey US E-commerce Logistics Industry Revenue (Million) Forecast, by Application 2020 & 2033
- Table 42: Israel US E-commerce Logistics Industry Revenue (Million) Forecast, by Application 2020 & 2033
- Table 43: GCC US E-commerce Logistics Industry Revenue (Million) Forecast, by Application 2020 & 2033
- Table 44: North Africa US E-commerce Logistics Industry Revenue (Million) Forecast, by Application 2020 & 2033
- Table 45: South Africa US E-commerce Logistics Industry Revenue (Million) Forecast, by Application 2020 & 2033
- Table 46: Rest of Middle East & Africa US E-commerce Logistics Industry Revenue (Million) Forecast, by Application 2020 & 2033
- Table 47: Global US E-commerce Logistics Industry Revenue Million Forecast, by Service 2020 & 2033
- Table 48: Global US E-commerce Logistics Industry Revenue Million Forecast, by Business 2020 & 2033
- Table 49: Global US E-commerce Logistics Industry Revenue Million Forecast, by Destination 2020 & 2033
- Table 50: Global US E-commerce Logistics Industry Revenue Million Forecast, by Product 2020 & 2033
- Table 51: Global US E-commerce Logistics Industry Revenue Million Forecast, by Country 2020 & 2033
- Table 52: China US E-commerce Logistics Industry Revenue (Million) Forecast, by Application 2020 & 2033
- Table 53: India US E-commerce Logistics Industry Revenue (Million) Forecast, by Application 2020 & 2033
- Table 54: Japan US E-commerce Logistics Industry Revenue (Million) Forecast, by Application 2020 & 2033
- Table 55: South Korea US E-commerce Logistics Industry Revenue (Million) Forecast, by Application 2020 & 2033
- Table 56: ASEAN US E-commerce Logistics Industry Revenue (Million) Forecast, by Application 2020 & 2033
- Table 57: Oceania US E-commerce Logistics Industry Revenue (Million) Forecast, by Application 2020 & 2033
- Table 58: Rest of Asia Pacific US E-commerce Logistics Industry Revenue (Million) Forecast, by Application 2020 & 2033
Frequently Asked Questions
1. What is the projected Compound Annual Growth Rate (CAGR) of the US E-commerce Logistics Industry?
The projected CAGR is approximately 8.90%.
2. Which companies are prominent players in the US E-commerce Logistics Industry?
Key companies in the market include DB Schenker, DHL Logistics, Saddle Creek Logistics, UPS Supply Chain Solutions, XPO Logistics, Rakuten Super Logistics, FedEx, Geodis Logistics, Kenco Logistics Services, Kuehne and Nagel Logistics**List Not Exhaustive.
3. What are the main segments of the US E-commerce Logistics Industry?
The market segments include Service, Business, Destination, Product.
4. Can you provide details about the market size?
The market size is estimated to be USD 129.54 Million as of 2022.
5. What are some drivers contributing to market growth?
Rise In Cross Border Logistics; Upgrade e-commerce with new supply chain technology.
6. What are the notable trends driving market growth?
Upgrade e-commerce with new supply chain technology.
7. Are there any restraints impacting market growth?
Supply Chain Disruptions; Warehousing and Inventory management.
8. Can you provide examples of recent developments in the market?
August 2023: A new distribution center has been opened by DHL eCommerce as part of its five-year strategic growth plan. The new facility, located in the city of Melrose Park in Illinois, encompasses a total area of 352,000 square feet. In addition to capacity enhancement, the facility is equipped with an Automated Honeywell Cross-belt Loop Sorter, which is capable of handling up to forty thousand parcels and packages an hour. As part of the logistics provider's recent expansion, 11 warehouses have been constructed or relocated, and seven more are expected to be finished at some point in the near future, as reported by the sources.
9. What pricing options are available for accessing the report?
Pricing options include single-user, multi-user, and enterprise licenses priced at USD 3800, USD 4500, and USD 5800 respectively.
10. Is the market size provided in terms of value or volume?
The market size is provided in terms of value, measured in Million.
11. Are there any specific market keywords associated with the report?
Yes, the market keyword associated with the report is "US E-commerce Logistics Industry," which aids in identifying and referencing the specific market segment covered.
12. How do I determine which pricing option suits my needs best?
The pricing options vary based on user requirements and access needs. Individual users may opt for single-user licenses, while businesses requiring broader access may choose multi-user or enterprise licenses for cost-effective access to the report.
13. Are there any additional resources or data provided in the US E-commerce Logistics Industry report?
While the report offers comprehensive insights, it's advisable to review the specific contents or supplementary materials provided to ascertain if additional resources or data are available.
14. How can I stay updated on further developments or reports in the US E-commerce Logistics Industry?
To stay informed about further developments, trends, and reports in the US E-commerce Logistics Industry, consider subscribing to industry newsletters, following relevant companies and organizations, or regularly checking reputable industry news sources and publications.
Methodology
Step 1 - Identification of Relevant Samples Size from Population Database


Step 2 - Approaches for Defining Global Market Size (Value, Volume* & Price*)

Note*: In applicable scenarios
Step 3 - Data Sources
Primary Research
- Web Analytics
- Survey Reports
- Research Institute
- Latest Research Reports
- Opinion Leaders
Secondary Research
- Annual Reports
- White Paper
- Latest Press Release
- Industry Association
- Paid Database
- Investor Presentations

Step 4 - Data Triangulation
Involves using different sources of information in order to increase the validity of a study
These sources are likely to be stakeholders in a program - participants, other researchers, program staff, other community members, and so on.
Then we put all data in single framework & apply various statistical tools to find out the dynamic on the market.
During the analysis stage, feedback from the stakeholder groups would be compared to determine areas of agreement as well as areas of divergence