

Key Insights
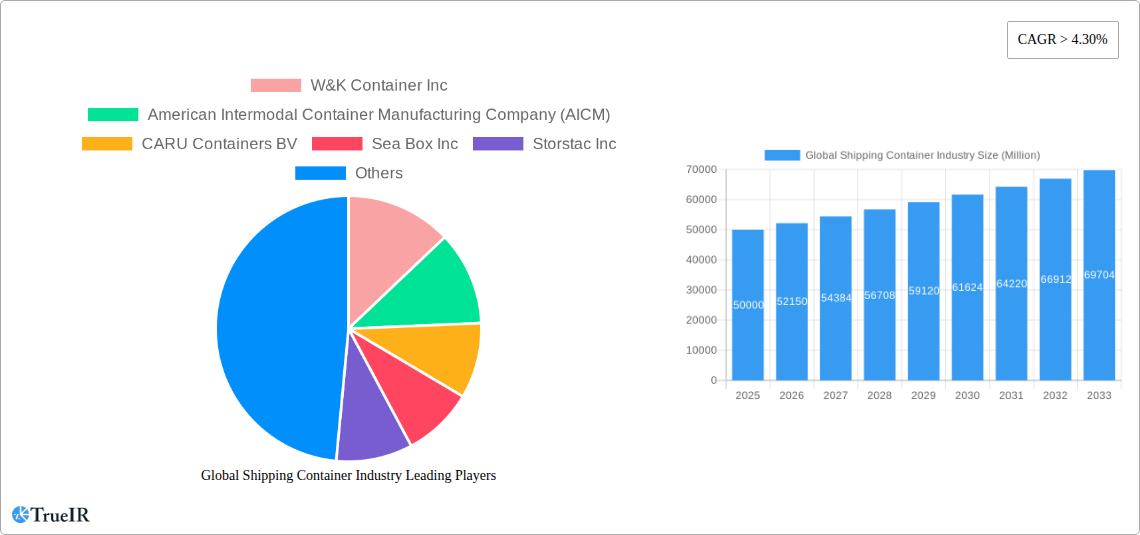
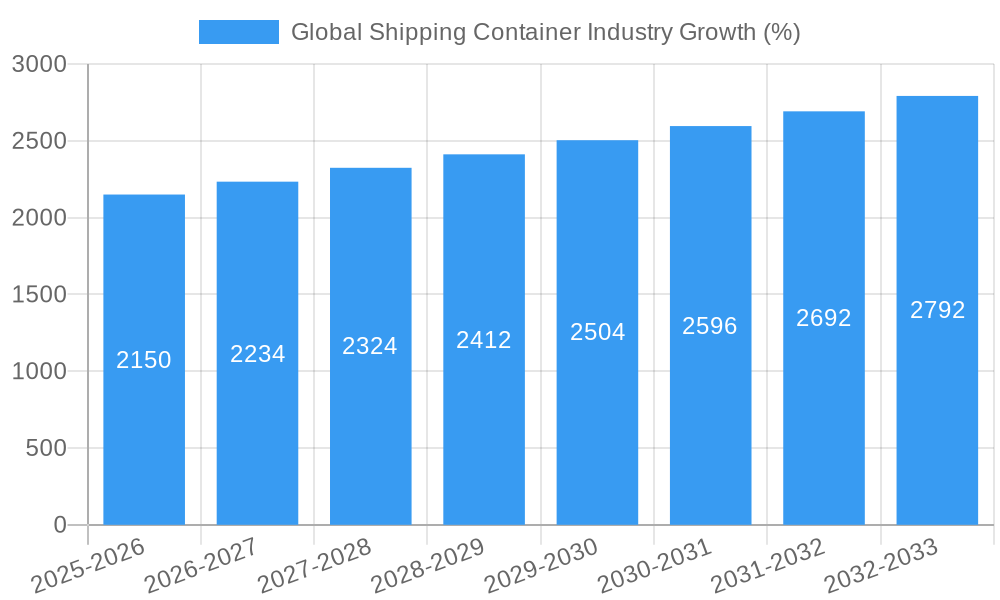
The global shipping container market, currently valued at approximately $XX million (estimated based on available CAGR and market trends), is experiencing robust growth, projected to maintain a Compound Annual Growth Rate (CAGR) exceeding 4.30% from 2025 to 2033. This expansion is driven by several key factors. The surge in global trade, particularly e-commerce, necessitates efficient and reliable containerized shipping solutions. Increased demand for faster and more secure transportation of goods, especially perishable items, fuels the growth of refrigerated and specialized containers. Furthermore, ongoing investments in port infrastructure and technological advancements in container tracking and management contribute to market expansion. Segment-wise, the large container (40 feet) segment currently holds a significant market share due to its cost-effectiveness for large-volume shipments. However, the high-cube container segment is anticipated to witness substantial growth driven by its increased cargo capacity. The dry storage container type remains dominant, though refrigerated and tank containers are experiencing faster growth rates due to the increasing demand for temperature-sensitive and liquid cargo transportation.
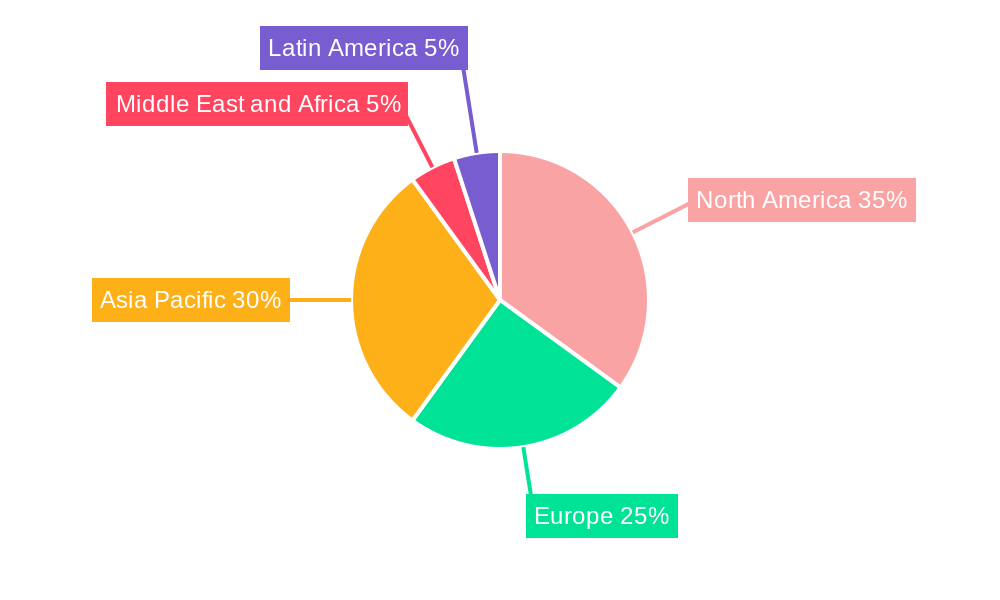
Significant regional variations exist within the market. North America and Asia-Pacific currently dominate the market share, driven by strong manufacturing and import/export activities. However, emerging economies in regions like the Middle East and Africa are expected to show significant growth potential in the coming years, spurred by infrastructure development and increasing international trade. The market is highly competitive with numerous key players, including W&K Container Inc, American Intermodal Container Manufacturing Company (AICM), and Singamas Container Holdings Limited, among others. These companies are continuously innovating to improve container design, durability, and tracking capabilities, further fueling market growth. However, fluctuating fuel prices and geopolitical uncertainties represent potential restraints to market expansion. Furthermore, the need for sustainable and environmentally friendly container solutions is becoming increasingly important, influencing future market trends and driving innovation within the industry.
Global Shipping Container Industry Market Report: 2019-2033
This comprehensive report provides a detailed analysis of the global shipping container industry, encompassing market size, key players, trends, and future outlook from 2019 to 2033. With a focus on key segments like dry storage, refrigerated, and tank containers, across various sizes (20ft, 40ft, high cube), this report is essential for businesses, investors, and researchers seeking to navigate this dynamic market. The report leverages extensive data analysis and insights, utilizing the study period of 2019-2024 as historical data, 2025 as the base and estimated year, and 2025-2033 as the forecast period.
Global Shipping Container Industry Market Structure & Competitive Landscape
The global shipping container market exhibits a moderately concentrated structure, with a handful of major players controlling a significant share. The industry's Herfindahl-Hirschman Index (HHI) is estimated at xx, indicating a moderate level of concentration. Key players, such as Maersk Container Industry AS, CIMC, and Singamas Container Holdings Limited, are driving innovation through investments in new materials, manufacturing processes, and intelligent container technologies. Stringent regulations concerning container safety, environmental standards (e.g., emissions), and trade policies significantly influence market dynamics. Product substitutes, such as intermodal transport using rail or road, exert competitive pressure, particularly for shorter distances. The market is segmented by end-users, including shipping lines, logistics providers, and freight forwarders, each with specific container requirements.
Mergers and acquisitions (M&A) activity has been significant, though recent events highlight regulatory challenges. For instance, the failed merger between CIMC and Maersk Container Industry in 2022, valued at USD 987.3 Million, underscores the regulatory scrutiny in this industry. The overall M&A volume in the period 2019-2024 is estimated at xx transactions, representing a xx% CAGR. Future M&A activity is expected to focus on expanding geographical reach, technological integration, and gaining access to specialized container types.
Global Shipping Container Industry Market Trends & Opportunities
The global shipping container market is experiencing robust growth, driven by the expansion of global trade, increasing e-commerce activity, and the need for efficient logistics solutions. The market size was valued at xx Million in 2024 and is projected to reach xx Million by 2033, registering a CAGR of xx% during the forecast period. This growth is fueled by several key trends. Technological advancements, such as smart containers equipped with sensors for real-time tracking and condition monitoring, are gaining traction, enhancing supply chain visibility and efficiency. Consumer preferences for faster and more reliable delivery are driving demand for specialized containers, like refrigerated containers for perishable goods and tank containers for liquid cargo. The competitive landscape is marked by ongoing innovation, consolidation, and strategic partnerships, shaping market dynamics. Market penetration rates for technologically advanced containers are rising steadily, reaching xx% in 2024 and expected to reach xx% by 2033.
Dominant Markets & Segments in Global Shipping Container Industry
While precise market share data requires detailed proprietary analysis, Asia is widely considered the dominant region in terms of both manufacturing and demand for shipping containers, driven by its significant role in global trade and manufacturing hubs. China, in particular, is a key player in manufacturing due to its vast production capacity.
- By Size: The 40-foot large container segment holds the largest market share, followed by the 20-foot small container. The high cube container segment is experiencing faster growth, driven by the need for increased cargo capacity.
- By Type: Dry storage containers dominate the market in terms of volume, due to their versatility. However, the refrigerated container segment exhibits significant growth potential, propelled by the rising demand for transporting perishable goods globally. The tank container segment caters to the specialized transportation of liquids and gases.
Key growth drivers for specific segments include robust infrastructure development in emerging economies, supportive government policies aimed at boosting trade and logistics, and the growing demand for specialized cargo handling solutions. The sustained growth within these segments stems from a confluence of factors including expanding global trade, increasing e-commerce, and the growing need for efficient and secure transport of goods across various industries.
Global Shipping Container Industry Product Analysis
The shipping container industry is witnessing significant product innovations, primarily focused on enhancing durability, security, and efficiency. Smart containers, incorporating IoT technology, provide real-time tracking and monitoring of cargo, reducing theft and damage. The introduction of specialized containers, tailored to specific cargo types, such as temperature-controlled containers for pharmaceuticals and reefer containers for perishable products, caters to increasing customer requirements. These innovations offer competitive advantages by providing better supply chain visibility, reducing transportation costs, and improving the overall efficiency of logistics operations. The market fit of these innovations is strong, reflecting the industry's push towards smarter, more secure, and more efficient shipping solutions.
Key Drivers, Barriers & Challenges in Global Shipping Container Industry
Key Drivers: The expansion of global trade, rising e-commerce, investment in port infrastructure, and technological advancements in container design and tracking are key drivers. Government policies promoting trade and efficient logistics further fuel market growth.
Challenges: Supply chain disruptions, as witnessed during the COVID-19 pandemic, leading to container shortages and increased freight costs; regulatory hurdles relating to environmental standards and safety regulations; and intense competition among manufacturers impacting pricing and profitability are significant challenges. The combined impact of these factors can lead to significant cost increases and reduced efficiency across the global supply chain.
Growth Drivers in the Global Shipping Container Industry Market
The primary growth drivers include the exponential increase in global trade volume, particularly in Asia and emerging economies, the continuous improvement in logistics infrastructure globally, and the ongoing technological innovations enhancing container efficiency and supply chain transparency. Furthermore, government initiatives promoting trade and efficient logistics play a significant role in fostering market expansion.
Challenges Impacting Global Shipping Container Industry Growth
Significant challenges include fluctuating global trade patterns, economic slowdowns impacting demand, the potential for geopolitical instability disrupting supply chains, and stringent environmental regulations increasing manufacturing costs. The intense competition amongst major players also keeps profit margins under pressure.
Key Players Shaping the Global Shipping Container Industry Market
- W&K Container Inc
- American Intermodal Container Manufacturing Company (AICM)
- CARU Containers BV
- Sea Box Inc
- Storstac Inc
- China International Marine Containers Co Ltd
- Singamas Container Holdings Limited
- Valisons & Co
- CXIC (Changzhou Xinhuachang Int'l Containers) Co Ltd
- YMC Container Solutions
- Ritveyraaj Cargo Shipping Containers
- Maersk Container Industry AS
- TLS Offshore Containers International Pvt Ltd
- Dong Fang International Container (Hong Kong) Co Ltd
- China Eastern Containers
Significant Global Shipping Container Industry Industry Milestones
- August 2022: The abandoned merger between China International Marine Containers and Maersk Container Industry highlights the increasing regulatory scrutiny within the industry, impacting future consolidation strategies.
- May 2022: Mazagon Dock Shipbuilders' entry into container manufacturing, driven by a CONCOR order for 2,500 12-foot containers, signifies a shift towards localized production in India, potentially addressing past supply chain bottlenecks. The USD 12.18 Million deal demonstrates the significant investment potential within this space.
Future Outlook for Global Shipping Container Industry Market
The global shipping container industry is poised for continued growth, driven by the increasing globalization of trade, rising e-commerce activities, and technological advancements leading to more efficient and sustainable shipping solutions. Strategic opportunities exist in developing specialized containers for niche markets, investing in smart container technologies, and expanding into emerging economies with robust infrastructure development. The market potential remains substantial, with opportunities for innovation, expansion, and consolidation amongst key players.
Global Shipping Container Industry Segmentation
-
1. Size
- 1.1. Small Container (20 Feet)
- 1.2. Large Container (40 Feet)
- 1.3. High Cube Container
-
2. Type
- 2.1. Dry Storage Container
- 2.2. Refrigerated Container
- 2.3. Tank Container
Global Shipping Container Industry Segmentation By Geography
-
1. North America
- 1.1. United States
- 1.2. Canada
-
2. Europe
- 2.1. Germany
- 2.2. United Kingdom
- 2.3. France
- 2.4. Rest of Europe
-
3. Asia Pacific
- 3.1. China
- 3.2. Japan
- 3.3. India
- 3.4. Rest of Asia Pacific
-
4. Middle East and Africa
- 4.1. South Africa
- 4.2. United Arab Emirates
- 4.3. Saudi Arabia
- 4.4. Rest of the Middle East and Africa
-
5. Latin America
- 5.1. Mexico
- 5.2. Brazil
- 5.3. Argentina
- 5.4. Rest of the Latin America
Global Shipping Container Industry REPORT HIGHLIGHTS
| Aspects | Details |
|---|---|
| Study Period | 2019-2033 |
| Base Year | 2024 |
| Estimated Year | 2025 |
| Forecast Period | 2025-2033 |
| Historical Period | 2019-2024 |
| Growth Rate | CAGR of > 4.30% from 2019-2033 |
| Segmentation |
|
Table of Contents
- 1. Introduction
- 1.1. Research Scope
- 1.2. Market Segmentation
- 1.3. Research Methodology
- 1.4. Definitions and Assumptions
- 2. Executive Summary
- 2.1. Introduction
- 3. Market Dynamics
- 3.1. Introduction
- 3.2. Market Drivers
- 3.2.1. 4.; Increasing Consumption of Frozen Food Driving the Market
- 3.3. Market Restrains
- 3.3.1. 4.; Constantly Increasing Fuel Costs
- 3.4. Market Trends
- 3.4.1. Increase in Demand for Cargo Transportation through Ships Driving the Market
- 4. Market Factor Analysis
- 4.1. Porters Five Forces
- 4.2. Supply/Value Chain
- 4.3. PESTEL analysis
- 4.4. Market Entropy
- 4.5. Patent/Trademark Analysis
- 5. Global Shipping Container Industry Analysis, Insights and Forecast, 2019-2031
- 5.1. Market Analysis, Insights and Forecast - by Size
- 5.1.1. Small Container (20 Feet)
- 5.1.2. Large Container (40 Feet)
- 5.1.3. High Cube Container
- 5.2. Market Analysis, Insights and Forecast - by Type
- 5.2.1. Dry Storage Container
- 5.2.2. Refrigerated Container
- 5.2.3. Tank Container
- 5.3. Market Analysis, Insights and Forecast - by Region
- 5.3.1. North America
- 5.3.2. Europe
- 5.3.3. Asia Pacific
- 5.3.4. Middle East and Africa
- 5.3.5. Latin America
- 5.1. Market Analysis, Insights and Forecast - by Size
- 6. North America Global Shipping Container Industry Analysis, Insights and Forecast, 2019-2031
- 6.1. Market Analysis, Insights and Forecast - by Size
- 6.1.1. Small Container (20 Feet)
- 6.1.2. Large Container (40 Feet)
- 6.1.3. High Cube Container
- 6.2. Market Analysis, Insights and Forecast - by Type
- 6.2.1. Dry Storage Container
- 6.2.2. Refrigerated Container
- 6.2.3. Tank Container
- 6.1. Market Analysis, Insights and Forecast - by Size
- 7. Europe Global Shipping Container Industry Analysis, Insights and Forecast, 2019-2031
- 7.1. Market Analysis, Insights and Forecast - by Size
- 7.1.1. Small Container (20 Feet)
- 7.1.2. Large Container (40 Feet)
- 7.1.3. High Cube Container
- 7.2. Market Analysis, Insights and Forecast - by Type
- 7.2.1. Dry Storage Container
- 7.2.2. Refrigerated Container
- 7.2.3. Tank Container
- 7.1. Market Analysis, Insights and Forecast - by Size
- 8. Asia Pacific Global Shipping Container Industry Analysis, Insights and Forecast, 2019-2031
- 8.1. Market Analysis, Insights and Forecast - by Size
- 8.1.1. Small Container (20 Feet)
- 8.1.2. Large Container (40 Feet)
- 8.1.3. High Cube Container
- 8.2. Market Analysis, Insights and Forecast - by Type
- 8.2.1. Dry Storage Container
- 8.2.2. Refrigerated Container
- 8.2.3. Tank Container
- 8.1. Market Analysis, Insights and Forecast - by Size
- 9. Middle East and Africa Global Shipping Container Industry Analysis, Insights and Forecast, 2019-2031
- 9.1. Market Analysis, Insights and Forecast - by Size
- 9.1.1. Small Container (20 Feet)
- 9.1.2. Large Container (40 Feet)
- 9.1.3. High Cube Container
- 9.2. Market Analysis, Insights and Forecast - by Type
- 9.2.1. Dry Storage Container
- 9.2.2. Refrigerated Container
- 9.2.3. Tank Container
- 9.1. Market Analysis, Insights and Forecast - by Size
- 10. Latin America Global Shipping Container Industry Analysis, Insights and Forecast, 2019-2031
- 10.1. Market Analysis, Insights and Forecast - by Size
- 10.1.1. Small Container (20 Feet)
- 10.1.2. Large Container (40 Feet)
- 10.1.3. High Cube Container
- 10.2. Market Analysis, Insights and Forecast - by Type
- 10.2.1. Dry Storage Container
- 10.2.2. Refrigerated Container
- 10.2.3. Tank Container
- 10.1. Market Analysis, Insights and Forecast - by Size
- 11. North America Global Shipping Container Industry Analysis, Insights and Forecast, 2019-2031
- 11.1. Market Analysis, Insights and Forecast - By Country/Sub-region
- 11.1.1 United States
- 11.1.2 Canada
- 12. Europe Global Shipping Container Industry Analysis, Insights and Forecast, 2019-2031
- 12.1. Market Analysis, Insights and Forecast - By Country/Sub-region
- 12.1.1 Germany
- 12.1.2 United Kingdom
- 12.1.3 France
- 12.1.4 Rest of Europe
- 13. Asia Pacific Global Shipping Container Industry Analysis, Insights and Forecast, 2019-2031
- 13.1. Market Analysis, Insights and Forecast - By Country/Sub-region
- 13.1.1 China
- 13.1.2 Japan
- 13.1.3 India
- 13.1.4 Rest of Asia Pacific
- 14. Middle East and Africa Global Shipping Container Industry Analysis, Insights and Forecast, 2019-2031
- 14.1. Market Analysis, Insights and Forecast - By Country/Sub-region
- 14.1.1 South Africa
- 14.1.2 United Arab Emirates
- 14.1.3 Saudi Arabia
- 14.1.4 Rest of the Middle East and Africa
- 15. Latin America Global Shipping Container Industry Analysis, Insights and Forecast, 2019-2031
- 15.1. Market Analysis, Insights and Forecast - By Country/Sub-region
- 15.1.1 Mexico
- 15.1.2 Brazil
- 15.1.3 Argentina
- 15.1.4 Rest of the Latin America
- 16. Competitive Analysis
- 16.1. Market Share Analysis 2024
- 16.2. Company Profiles
- 16.2.1 W&K Container Inc
- 16.2.1.1. Overview
- 16.2.1.2. Products
- 16.2.1.3. SWOT Analysis
- 16.2.1.4. Recent Developments
- 16.2.1.5. Financials (Based on Availability)
- 16.2.2 American Intermodal Container Manufacturing Company (AICM)
- 16.2.2.1. Overview
- 16.2.2.2. Products
- 16.2.2.3. SWOT Analysis
- 16.2.2.4. Recent Developments
- 16.2.2.5. Financials (Based on Availability)
- 16.2.3 CARU Containers BV
- 16.2.3.1. Overview
- 16.2.3.2. Products
- 16.2.3.3. SWOT Analysis
- 16.2.3.4. Recent Developments
- 16.2.3.5. Financials (Based on Availability)
- 16.2.4 Sea Box Inc
- 16.2.4.1. Overview
- 16.2.4.2. Products
- 16.2.4.3. SWOT Analysis
- 16.2.4.4. Recent Developments
- 16.2.4.5. Financials (Based on Availability)
- 16.2.5 Storstac Inc
- 16.2.5.1. Overview
- 16.2.5.2. Products
- 16.2.5.3. SWOT Analysis
- 16.2.5.4. Recent Developments
- 16.2.5.5. Financials (Based on Availability)
- 16.2.6 China International Marine Containers Co Ltd
- 16.2.6.1. Overview
- 16.2.6.2. Products
- 16.2.6.3. SWOT Analysis
- 16.2.6.4. Recent Developments
- 16.2.6.5. Financials (Based on Availability)
- 16.2.7 Singamas Container Holdings Limited
- 16.2.7.1. Overview
- 16.2.7.2. Products
- 16.2.7.3. SWOT Analysis
- 16.2.7.4. Recent Developments
- 16.2.7.5. Financials (Based on Availability)
- 16.2.8 Valisons & Co
- 16.2.8.1. Overview
- 16.2.8.2. Products
- 16.2.8.3. SWOT Analysis
- 16.2.8.4. Recent Developments
- 16.2.8.5. Financials (Based on Availability)
- 16.2.9 CXIC (Changzhou Xinhuachang Int'l Containers) Co Ltd
- 16.2.9.1. Overview
- 16.2.9.2. Products
- 16.2.9.3. SWOT Analysis
- 16.2.9.4. Recent Developments
- 16.2.9.5. Financials (Based on Availability)
- 16.2.10 YMC Container Solutions
- 16.2.10.1. Overview
- 16.2.10.2. Products
- 16.2.10.3. SWOT Analysis
- 16.2.10.4. Recent Developments
- 16.2.10.5. Financials (Based on Availability)
- 16.2.11 Ritveyraaj Cargo Shipping Containers**List Not Exhaustive
- 16.2.11.1. Overview
- 16.2.11.2. Products
- 16.2.11.3. SWOT Analysis
- 16.2.11.4. Recent Developments
- 16.2.11.5. Financials (Based on Availability)
- 16.2.12 Maersk Container Industry AS
- 16.2.12.1. Overview
- 16.2.12.2. Products
- 16.2.12.3. SWOT Analysis
- 16.2.12.4. Recent Developments
- 16.2.12.5. Financials (Based on Availability)
- 16.2.13 TLS Offshore Containers International Pvt Ltd
- 16.2.13.1. Overview
- 16.2.13.2. Products
- 16.2.13.3. SWOT Analysis
- 16.2.13.4. Recent Developments
- 16.2.13.5. Financials (Based on Availability)
- 16.2.14 Dong Fang International Container (Hong Kong) Co Ltd
- 16.2.14.1. Overview
- 16.2.14.2. Products
- 16.2.14.3. SWOT Analysis
- 16.2.14.4. Recent Developments
- 16.2.14.5. Financials (Based on Availability)
- 16.2.15 China Eastern Containers
- 16.2.15.1. Overview
- 16.2.15.2. Products
- 16.2.15.3. SWOT Analysis
- 16.2.15.4. Recent Developments
- 16.2.15.5. Financials (Based on Availability)
- 16.2.1 W&K Container Inc
List of Figures
- Figure 1: Global Global Shipping Container Industry Revenue Breakdown (Million, %) by Region 2024 & 2032
- Figure 2: North America Global Shipping Container Industry Revenue (Million), by Country 2024 & 2032
- Figure 3: North America Global Shipping Container Industry Revenue Share (%), by Country 2024 & 2032
- Figure 4: Europe Global Shipping Container Industry Revenue (Million), by Country 2024 & 2032
- Figure 5: Europe Global Shipping Container Industry Revenue Share (%), by Country 2024 & 2032
- Figure 6: Asia Pacific Global Shipping Container Industry Revenue (Million), by Country 2024 & 2032
- Figure 7: Asia Pacific Global Shipping Container Industry Revenue Share (%), by Country 2024 & 2032
- Figure 8: Middle East and Africa Global Shipping Container Industry Revenue (Million), by Country 2024 & 2032
- Figure 9: Middle East and Africa Global Shipping Container Industry Revenue Share (%), by Country 2024 & 2032
- Figure 10: Latin America Global Shipping Container Industry Revenue (Million), by Country 2024 & 2032
- Figure 11: Latin America Global Shipping Container Industry Revenue Share (%), by Country 2024 & 2032
- Figure 12: North America Global Shipping Container Industry Revenue (Million), by Size 2024 & 2032
- Figure 13: North America Global Shipping Container Industry Revenue Share (%), by Size 2024 & 2032
- Figure 14: North America Global Shipping Container Industry Revenue (Million), by Type 2024 & 2032
- Figure 15: North America Global Shipping Container Industry Revenue Share (%), by Type 2024 & 2032
- Figure 16: North America Global Shipping Container Industry Revenue (Million), by Country 2024 & 2032
- Figure 17: North America Global Shipping Container Industry Revenue Share (%), by Country 2024 & 2032
- Figure 18: Europe Global Shipping Container Industry Revenue (Million), by Size 2024 & 2032
- Figure 19: Europe Global Shipping Container Industry Revenue Share (%), by Size 2024 & 2032
- Figure 20: Europe Global Shipping Container Industry Revenue (Million), by Type 2024 & 2032
- Figure 21: Europe Global Shipping Container Industry Revenue Share (%), by Type 2024 & 2032
- Figure 22: Europe Global Shipping Container Industry Revenue (Million), by Country 2024 & 2032
- Figure 23: Europe Global Shipping Container Industry Revenue Share (%), by Country 2024 & 2032
- Figure 24: Asia Pacific Global Shipping Container Industry Revenue (Million), by Size 2024 & 2032
- Figure 25: Asia Pacific Global Shipping Container Industry Revenue Share (%), by Size 2024 & 2032
- Figure 26: Asia Pacific Global Shipping Container Industry Revenue (Million), by Type 2024 & 2032
- Figure 27: Asia Pacific Global Shipping Container Industry Revenue Share (%), by Type 2024 & 2032
- Figure 28: Asia Pacific Global Shipping Container Industry Revenue (Million), by Country 2024 & 2032
- Figure 29: Asia Pacific Global Shipping Container Industry Revenue Share (%), by Country 2024 & 2032
- Figure 30: Middle East and Africa Global Shipping Container Industry Revenue (Million), by Size 2024 & 2032
- Figure 31: Middle East and Africa Global Shipping Container Industry Revenue Share (%), by Size 2024 & 2032
- Figure 32: Middle East and Africa Global Shipping Container Industry Revenue (Million), by Type 2024 & 2032
- Figure 33: Middle East and Africa Global Shipping Container Industry Revenue Share (%), by Type 2024 & 2032
- Figure 34: Middle East and Africa Global Shipping Container Industry Revenue (Million), by Country 2024 & 2032
- Figure 35: Middle East and Africa Global Shipping Container Industry Revenue Share (%), by Country 2024 & 2032
- Figure 36: Latin America Global Shipping Container Industry Revenue (Million), by Size 2024 & 2032
- Figure 37: Latin America Global Shipping Container Industry Revenue Share (%), by Size 2024 & 2032
- Figure 38: Latin America Global Shipping Container Industry Revenue (Million), by Type 2024 & 2032
- Figure 39: Latin America Global Shipping Container Industry Revenue Share (%), by Type 2024 & 2032
- Figure 40: Latin America Global Shipping Container Industry Revenue (Million), by Country 2024 & 2032
- Figure 41: Latin America Global Shipping Container Industry Revenue Share (%), by Country 2024 & 2032
List of Tables
- Table 1: Global Shipping Container Industry Revenue Million Forecast, by Region 2019 & 2032
- Table 2: Global Shipping Container Industry Revenue Million Forecast, by Size 2019 & 2032
- Table 3: Global Shipping Container Industry Revenue Million Forecast, by Type 2019 & 2032
- Table 4: Global Shipping Container Industry Revenue Million Forecast, by Region 2019 & 2032
- Table 5: Global Shipping Container Industry Revenue Million Forecast, by Country 2019 & 2032
- Table 6: United States Global Shipping Container Industry Revenue (Million) Forecast, by Application 2019 & 2032
- Table 7: Canada Global Shipping Container Industry Revenue (Million) Forecast, by Application 2019 & 2032
- Table 8: Global Shipping Container Industry Revenue Million Forecast, by Country 2019 & 2032
- Table 9: Germany Global Shipping Container Industry Revenue (Million) Forecast, by Application 2019 & 2032
- Table 10: United Kingdom Global Shipping Container Industry Revenue (Million) Forecast, by Application 2019 & 2032
- Table 11: France Global Shipping Container Industry Revenue (Million) Forecast, by Application 2019 & 2032
- Table 12: Rest of Europe Global Shipping Container Industry Revenue (Million) Forecast, by Application 2019 & 2032
- Table 13: Global Shipping Container Industry Revenue Million Forecast, by Country 2019 & 2032
- Table 14: China Global Shipping Container Industry Revenue (Million) Forecast, by Application 2019 & 2032
- Table 15: Japan Global Shipping Container Industry Revenue (Million) Forecast, by Application 2019 & 2032
- Table 16: India Global Shipping Container Industry Revenue (Million) Forecast, by Application 2019 & 2032
- Table 17: Rest of Asia Pacific Global Shipping Container Industry Revenue (Million) Forecast, by Application 2019 & 2032
- Table 18: Global Shipping Container Industry Revenue Million Forecast, by Country 2019 & 2032
- Table 19: South Africa Global Shipping Container Industry Revenue (Million) Forecast, by Application 2019 & 2032
- Table 20: United Arab Emirates Global Shipping Container Industry Revenue (Million) Forecast, by Application 2019 & 2032
- Table 21: Saudi Arabia Global Shipping Container Industry Revenue (Million) Forecast, by Application 2019 & 2032
- Table 22: Rest of the Middle East and Africa Global Shipping Container Industry Revenue (Million) Forecast, by Application 2019 & 2032
- Table 23: Global Shipping Container Industry Revenue Million Forecast, by Country 2019 & 2032
- Table 24: Mexico Global Shipping Container Industry Revenue (Million) Forecast, by Application 2019 & 2032
- Table 25: Brazil Global Shipping Container Industry Revenue (Million) Forecast, by Application 2019 & 2032
- Table 26: Argentina Global Shipping Container Industry Revenue (Million) Forecast, by Application 2019 & 2032
- Table 27: Rest of the Latin America Global Shipping Container Industry Revenue (Million) Forecast, by Application 2019 & 2032
- Table 28: Global Shipping Container Industry Revenue Million Forecast, by Size 2019 & 2032
- Table 29: Global Shipping Container Industry Revenue Million Forecast, by Type 2019 & 2032
- Table 30: Global Shipping Container Industry Revenue Million Forecast, by Country 2019 & 2032
- Table 31: United States Global Shipping Container Industry Revenue (Million) Forecast, by Application 2019 & 2032
- Table 32: Canada Global Shipping Container Industry Revenue (Million) Forecast, by Application 2019 & 2032
- Table 33: Global Shipping Container Industry Revenue Million Forecast, by Size 2019 & 2032
- Table 34: Global Shipping Container Industry Revenue Million Forecast, by Type 2019 & 2032
- Table 35: Global Shipping Container Industry Revenue Million Forecast, by Country 2019 & 2032
- Table 36: Germany Global Shipping Container Industry Revenue (Million) Forecast, by Application 2019 & 2032
- Table 37: United Kingdom Global Shipping Container Industry Revenue (Million) Forecast, by Application 2019 & 2032
- Table 38: France Global Shipping Container Industry Revenue (Million) Forecast, by Application 2019 & 2032
- Table 39: Rest of Europe Global Shipping Container Industry Revenue (Million) Forecast, by Application 2019 & 2032
- Table 40: Global Shipping Container Industry Revenue Million Forecast, by Size 2019 & 2032
- Table 41: Global Shipping Container Industry Revenue Million Forecast, by Type 2019 & 2032
- Table 42: Global Shipping Container Industry Revenue Million Forecast, by Country 2019 & 2032
- Table 43: China Global Shipping Container Industry Revenue (Million) Forecast, by Application 2019 & 2032
- Table 44: Japan Global Shipping Container Industry Revenue (Million) Forecast, by Application 2019 & 2032
- Table 45: India Global Shipping Container Industry Revenue (Million) Forecast, by Application 2019 & 2032
- Table 46: Rest of Asia Pacific Global Shipping Container Industry Revenue (Million) Forecast, by Application 2019 & 2032
- Table 47: Global Shipping Container Industry Revenue Million Forecast, by Size 2019 & 2032
- Table 48: Global Shipping Container Industry Revenue Million Forecast, by Type 2019 & 2032
- Table 49: Global Shipping Container Industry Revenue Million Forecast, by Country 2019 & 2032
- Table 50: South Africa Global Shipping Container Industry Revenue (Million) Forecast, by Application 2019 & 2032
- Table 51: United Arab Emirates Global Shipping Container Industry Revenue (Million) Forecast, by Application 2019 & 2032
- Table 52: Saudi Arabia Global Shipping Container Industry Revenue (Million) Forecast, by Application 2019 & 2032
- Table 53: Rest of the Middle East and Africa Global Shipping Container Industry Revenue (Million) Forecast, by Application 2019 & 2032
- Table 54: Global Shipping Container Industry Revenue Million Forecast, by Size 2019 & 2032
- Table 55: Global Shipping Container Industry Revenue Million Forecast, by Type 2019 & 2032
- Table 56: Global Shipping Container Industry Revenue Million Forecast, by Country 2019 & 2032
- Table 57: Mexico Global Shipping Container Industry Revenue (Million) Forecast, by Application 2019 & 2032
- Table 58: Brazil Global Shipping Container Industry Revenue (Million) Forecast, by Application 2019 & 2032
- Table 59: Argentina Global Shipping Container Industry Revenue (Million) Forecast, by Application 2019 & 2032
- Table 60: Rest of the Latin America Global Shipping Container Industry Revenue (Million) Forecast, by Application 2019 & 2032
Frequently Asked Questions
1. What is the projected Compound Annual Growth Rate (CAGR) of the Global Shipping Container Industry?
The projected CAGR is approximately > 4.30%.
2. Which companies are prominent players in the Global Shipping Container Industry?
Key companies in the market include W&K Container Inc, American Intermodal Container Manufacturing Company (AICM), CARU Containers BV, Sea Box Inc, Storstac Inc, China International Marine Containers Co Ltd, Singamas Container Holdings Limited, Valisons & Co, CXIC (Changzhou Xinhuachang Int'l Containers) Co Ltd, YMC Container Solutions, Ritveyraaj Cargo Shipping Containers**List Not Exhaustive, Maersk Container Industry AS, TLS Offshore Containers International Pvt Ltd, Dong Fang International Container (Hong Kong) Co Ltd, China Eastern Containers.
3. What are the main segments of the Global Shipping Container Industry?
The market segments include Size, Type.
4. Can you provide details about the market size?
The market size is estimated to be USD XX Million as of 2022.
5. What are some drivers contributing to market growth?
4.; Increasing Consumption of Frozen Food Driving the Market.
6. What are the notable trends driving market growth?
Increase in Demand for Cargo Transportation through Ships Driving the Market.
7. Are there any restraints impacting market growth?
4.; Constantly Increasing Fuel Costs.
8. Can you provide examples of recent developments in the market?
August 2022: Global shipping container suppliers China International Marine Containers and Maersk Container Industry in a joint statement said they have abandoned a merger plan, citing significant regulatory challenges. China International Marine Containers (CIMC) in September 2021 had agreed to buy the Danish shipping company AP Moeller - Maersk refrigerated containers maker for USD 987.3 million. The U.S. Justice Department said the deal would have combined two of the world's four suppliers of refrigerated shipping containers and further concentrated the global cold supply chain.
9. What pricing options are available for accessing the report?
Pricing options include single-user, multi-user, and enterprise licenses priced at USD 4750, USD 5250, and USD 8750 respectively.
10. Is the market size provided in terms of value or volume?
The market size is provided in terms of value, measured in Million.
11. Are there any specific market keywords associated with the report?
Yes, the market keyword associated with the report is "Global Shipping Container Industry," which aids in identifying and referencing the specific market segment covered.
12. How do I determine which pricing option suits my needs best?
The pricing options vary based on user requirements and access needs. Individual users may opt for single-user licenses, while businesses requiring broader access may choose multi-user or enterprise licenses for cost-effective access to the report.
13. Are there any additional resources or data provided in the Global Shipping Container Industry report?
While the report offers comprehensive insights, it's advisable to review the specific contents or supplementary materials provided to ascertain if additional resources or data are available.
14. How can I stay updated on further developments or reports in the Global Shipping Container Industry?
To stay informed about further developments, trends, and reports in the Global Shipping Container Industry, consider subscribing to industry newsletters, following relevant companies and organizations, or regularly checking reputable industry news sources and publications.
Methodology
Step 1 - Identification of Relevant Samples Size from Population Database


Step 2 - Approaches for Defining Global Market Size (Value, Volume* & Price*)

Note*: In applicable scenarios
Step 3 - Data Sources
Primary Research
- Web Analytics
- Survey Reports
- Research Institute
- Latest Research Reports
- Opinion Leaders
Secondary Research
- Annual Reports
- White Paper
- Latest Press Release
- Industry Association
- Paid Database
- Investor Presentations

Step 4 - Data Triangulation
Involves using different sources of information in order to increase the validity of a study
These sources are likely to be stakeholders in a program - participants, other researchers, program staff, other community members, and so on.
Then we put all data in single framework & apply various statistical tools to find out the dynamic on the market.
During the analysis stage, feedback from the stakeholder groups would be compared to determine areas of agreement as well as areas of divergence
