

Key Insights
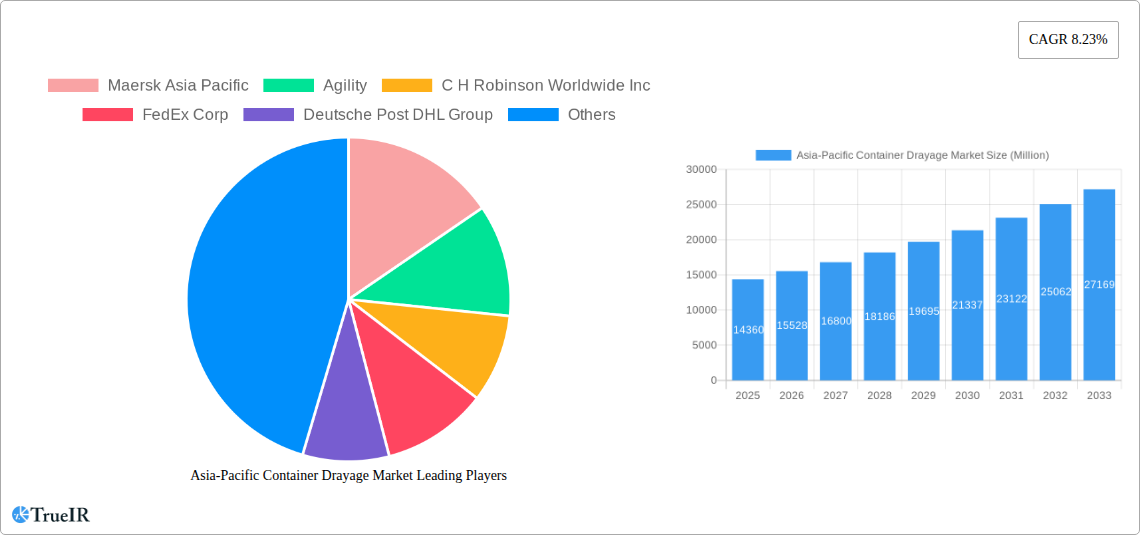
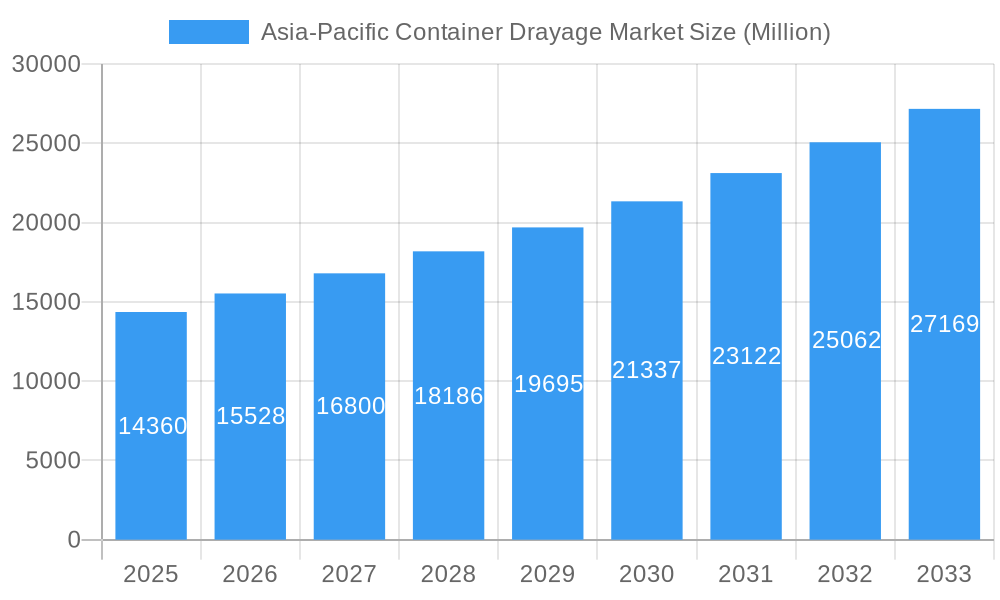
The Asia-Pacific container drayage market, valued at $14.36 billion in 2025, is projected to experience robust growth, exhibiting a Compound Annual Growth Rate (CAGR) of 8.23% from 2025 to 2033. This expansion is fueled by several key factors. The surging e-commerce sector across the region is driving demand for efficient last-mile delivery solutions, significantly boosting the need for container drayage services. Furthermore, increasing port congestion and the ongoing efforts to optimize supply chain efficiency are compelling businesses to outsource their drayage operations to specialized providers. Improvements in logistics technology, such as real-time tracking and route optimization software, are further enhancing operational efficiency and contributing to market growth. However, challenges such as fluctuating fuel prices, driver shortages, and stringent environmental regulations pose potential restraints on market expansion. The market is segmented by various service types (e.g., intermodal, short-haul, long-haul), modes of transport (e.g., truck, rail), and customer types (e.g., importers, exporters, freight forwarders). Major players like Maersk, Agility, C.H. Robinson, FedEx, DHL, and others compete intensely, focusing on technological advancements and strategic partnerships to maintain a competitive edge.
Asia-Pacific Container Drayage Market Market Size (In Billion)
The forecast period of 2025-2033 anticipates a significant increase in market size, driven by continued growth in e-commerce and industrialization within Asia-Pacific. While specific regional breakdowns are unavailable, the market is expected to witness substantial growth in key economies such as China, India, Japan, and Australia, owing to their expanding manufacturing and retail sectors. The competitive landscape is dynamic, with established players and emerging logistics providers vying for market share through service diversification, technological integration, and strategic acquisitions. Focus on sustainability and reduced carbon emissions will likely become a crucial aspect of the market’s future growth, influencing the adoption of eco-friendly transport solutions and operational practices. Overall, the Asia-Pacific container drayage market presents significant opportunities for growth and investment, despite the challenges posed by external factors.
Asia-Pacific Container Drayage Market Company Market Share
Asia-Pacific Container Drayage Market Report: 2019-2033
This comprehensive report provides an in-depth analysis of the Asia-Pacific container drayage market, offering crucial insights for stakeholders seeking to navigate this dynamic sector. With a study period spanning 2019-2033, a base year of 2025, and a forecast period of 2025-2033, this report delivers a holistic view of market trends, competitive landscapes, and future growth potential. The report leverages extensive data analysis and incorporates recent industry developments to offer actionable intelligence. The market is expected to reach xx Million by 2033, exhibiting a CAGR of xx% during the forecast period.
Asia-Pacific Container Drayage Market Structure & Competitive Landscape
The Asia-Pacific container drayage market exhibits a moderately concentrated structure, with a few major players holding significant market share. The Herfindahl-Hirschman Index (HHI) for the market is estimated at xx, indicating a competitive landscape with room for both consolidation and expansion. Innovation in areas such as technology integration (e.g., AI-powered route optimization, blockchain for enhanced transparency) and sustainable practices (e.g., electric or hybrid drayage trucks) are key drivers. Stringent regulations concerning emissions and safety standards significantly impact operational costs and business strategies. Product substitutes, primarily involving rail transport and intermodal solutions, pose competitive challenges.
The market is segmented primarily by end-user industries (e.g., manufacturing, retail, consumer goods), each having distinct transportation needs. Mergers and acquisitions (M&A) activity within the sector has been moderate, with approximately xx M&A deals recorded during the historical period (2019-2024), primarily focused on expanding geographical reach and service offerings. Future M&A activity is anticipated to remain steady, driven by the need for consolidation and access to advanced technologies.
- Market Concentration: Moderately concentrated (HHI: xx)
- Innovation Drivers: Technology integration, sustainable practices
- Regulatory Impacts: Stringent emission and safety standards
- Product Substitutes: Rail transport, intermodal solutions
- End-User Segmentation: Manufacturing, retail, consumer goods
- M&A Trends: Moderate activity (xx deals during 2019-2024), focusing on geographic expansion and technology acquisition
Asia-Pacific Container Drayage Market Trends & Opportunities
The Asia-Pacific container drayage market is experiencing robust growth, driven by the burgeoning e-commerce sector, rising global trade volumes, and the increasing demand for efficient last-mile delivery solutions. The market size was valued at xx Million in 2024 and is projected to reach xx Million by 2033, exhibiting substantial growth potential. Technological advancements, including the adoption of telematics, GPS tracking, and route optimization software, are enhancing operational efficiency and reducing transportation costs. Consumer preferences for faster delivery times and increased transparency in supply chains are also driving demand. Competitive dynamics are characterized by price competition, service differentiation, and strategic alliances among players aiming to capture a greater market share. The market penetration rate for advanced technologies (such as real-time tracking and predictive analytics) is currently at xx% and is expected to increase to xx% by 2033.
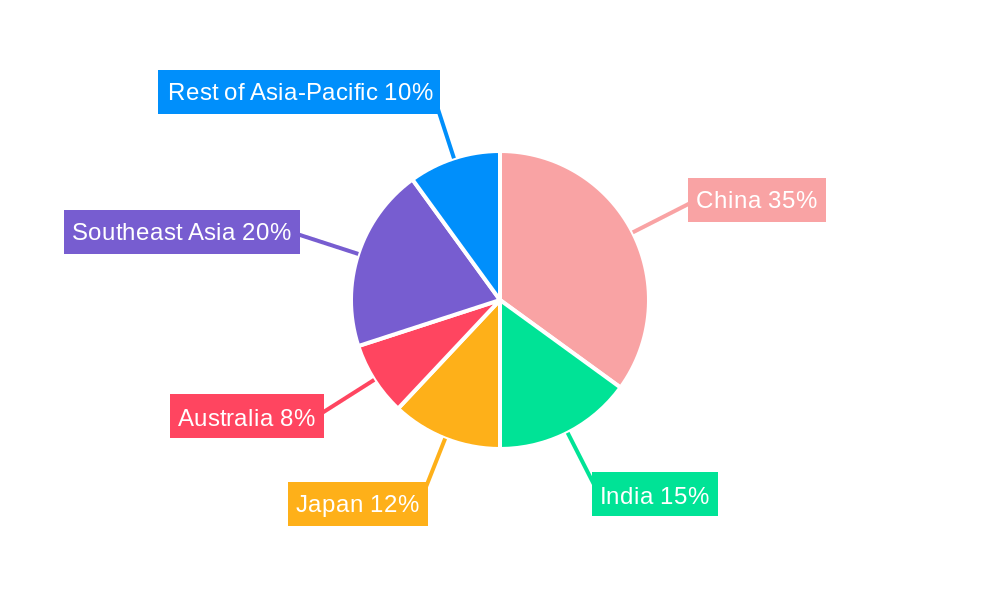
Dominant Markets & Segments in Asia-Pacific Container Drayage Market
China dominates the Asia-Pacific container drayage market due to its immense manufacturing base, robust port infrastructure, and high import/export volumes. Other key markets include India, Singapore, South Korea, and Japan. The rapid growth of e-commerce in developing economies presents significant opportunities.
Key Growth Drivers in China:
- Extensive port infrastructure and logistics networks.
- High manufacturing and export volumes.
- Growing e-commerce sector.
- Government support for infrastructure development.
Key Growth Drivers in India:
- Increasing manufacturing and industrial output.
- Growing e-commerce market.
- Infrastructure investments focusing on port and logistics enhancements.
- Favorable government policies promoting ease of doing business.
Key Growth Drivers in Singapore:
- Strategic location as a major transshipment hub.
- Efficient port operations and advanced logistics infrastructure.
- Strong government support for the logistics sector.
- High level of technological adoption.
The dominance of China is primarily attributed to the country's massive manufacturing capacity and the resulting need for efficient container drayage services. The continuous expansion of port facilities and related infrastructure, coupled with supportive government policies, contributes significantly to its leading position.
Asia-Pacific Container Drayage Market Product Analysis
The container drayage market offers a range of services, from basic transportation to specialized handling of oversized or temperature-sensitive cargo. Technological advancements, such as real-time tracking systems, route optimization software, and the use of electric and autonomous vehicles, are continuously improving service efficiency, delivery speed, and cost-effectiveness. These innovations are enhancing the overall market competitiveness by streamlining logistics and minimizing environmental impact. The market is witnessing increased demand for value-added services, such as customs brokerage and warehousing, as customers seek comprehensive solutions.
Key Drivers, Barriers & Challenges in Asia-Pacific Container Drayage Market
Key Drivers: Rising e-commerce, increased globalization, expansion of port infrastructure, and government initiatives promoting logistics development are significant drivers. Technological advancements such as AI and IoT are enhancing efficiency and creating new opportunities. Examples include the increasing adoption of electronic data interchange (EDI) and the use of GPS tracking.
Challenges: Supply chain disruptions, fuel price volatility, driver shortages, stringent environmental regulations, and port congestion pose considerable challenges. These factors can lead to increased operating costs, delivery delays, and reduced profitability. For example, the impact of port congestion in major Asian ports can lead to significant delays and increased costs for shippers.
Growth Drivers in the Asia-Pacific Container Drayage Market Market
The growth of the Asia-Pacific container drayage market is largely driven by increasing e-commerce activity, rising international trade, and the expansion of manufacturing and industrial sectors in the region. Government investments in infrastructure, including improved port facilities and road networks, also contribute significantly. Technological advancements like automation and real-time tracking systems boost efficiency and reduce operational costs.
Challenges Impacting Asia-Pacific Container Drayage Market Growth
The Asia-Pacific container drayage market faces challenges such as driver shortages, fuel price volatility, and increasing regulatory pressure on emissions. Port congestion and infrastructure limitations in certain regions also constrain growth. Supply chain disruptions caused by geopolitical events or natural disasters can significantly impact operational efficiency and profitability.
Key Players Shaping the Asia-Pacific Container Drayage Market Market
Significant Asia-Pacific Container Drayage Market Industry Milestones
- July 2024: DP World launched 51 new freight forwarding offices across the Asia-Pacific, expanding its reach in air and ocean freight. This significantly strengthens its market position and capacity.
- February 2024: HERE Technologies partnered with PSA Singapore to enhance Singapore's container truck ecosystem efficiency. This collaboration leverages technology to optimize logistics within a crucial global hub.
Future Outlook for Asia-Pacific Container Drayage Market Market
The Asia-Pacific container drayage market is poised for continued growth, driven by sustained expansion of e-commerce, increased trade volumes, and ongoing infrastructure development. Strategic investments in technology, sustainable practices, and workforce development will be crucial for players to maintain a competitive edge. The market presents significant opportunities for companies specializing in innovative logistics solutions and those adept at managing complex supply chains.
Asia-Pacific Container Drayage Market Segmentation
-
1. Mode of Transport
- 1.1. Rail
- 1.2. Road
- 1.3. Other Modes of Transport
-
2. Geography
- 2.1. China
- 2.2. Japan
- 2.3. India
- 2.4. South Korea
- 2.5. Indonesia
- 2.6. Vietnam
- 2.7. Australia
- 2.8. Rest of Asia-Pacific
Asia-Pacific Container Drayage Market Segmentation By Geography
- 1. China
- 2. Japan
- 3. India
- 4. South Korea
- 5. Indonesia
- 6. Vietnam
- 7. Australia
- 8. Rest of Asia Pacific
Asia-Pacific Container Drayage Market Regional Market Share
Geographic Coverage of Asia-Pacific Container Drayage Market
Asia-Pacific Container Drayage Market REPORT HIGHLIGHTS
| Aspects | Details |
|---|---|
| Study Period | 2020-2034 |
| Base Year | 2025 |
| Estimated Year | 2026 |
| Forecast Period | 2026-2034 |
| Historical Period | 2020-2025 |
| Growth Rate | CAGR of 8.23% from 2020-2034 |
| Segmentation |
|
Table of Contents
- 1. Introduction
- 1.1. Research Scope
- 1.2. Market Segmentation
- 1.3. Research Objective
- 1.4. Definitions and Assumptions
- 2. Executive Summary
- 2.1. Market Snapshot
- 3. Market Dynamics
- 3.1. Market Drivers
- 3.2. Market Restrains
- 3.3. Market Trends
- 3.4. Market Opportunities
- 4. Market Factor Analysis
- 4.1. Porters Five Forces
- 4.1.1. Bargaining Power of Suppliers
- 4.1.2. Bargaining Power of Buyers
- 4.1.3. Threat of New Entrants
- 4.1.4. Threat of Substitutes
- 4.1.5. Competitive Rivalry
- 4.2. PESTEL analysis
- 4.3. BCG Analysis
- 4.3.1. Stars (High Growth, High Market Share)
- 4.3.2. Cash Cows (Low Growth, High Market Share)
- 4.3.3. Question Mark (High Growth, Low Market Share)
- 4.3.4. Dogs (Low Growth, Low Market Share)
- 4.4. Ansoff Matrix Analysis
- 4.5. Supply Chain Analysis
- 4.6. Regulatory Landscape
- 4.7. Current Market Potential and Opportunity Assessment (TAM–SAM–SOM Framework)
- 4.8. TIR Analyst Note
- 4.1. Porters Five Forces
- 5. Market Analysis, Insights and Forecast 2021-2033
- 5.1. Market Analysis, Insights and Forecast - by Mode of Transport
- 5.1.1. Rail
- 5.1.2. Road
- 5.1.3. Other Modes of Transport
- 5.2. Market Analysis, Insights and Forecast - by Geography
- 5.2.1. China
- 5.2.2. Japan
- 5.2.3. India
- 5.2.4. South Korea
- 5.2.5. Indonesia
- 5.2.6. Vietnam
- 5.2.7. Australia
- 5.2.8. Rest of Asia-Pacific
- 5.3. Market Analysis, Insights and Forecast - by Region
- 5.3.1. China
- 5.3.2. Japan
- 5.3.3. India
- 5.3.4. South Korea
- 5.3.5. Indonesia
- 5.3.6. Vietnam
- 5.3.7. Australia
- 5.3.8. Rest of Asia Pacific
- 5.1. Market Analysis, Insights and Forecast - by Mode of Transport
- 6. Global Asia-Pacific Container Drayage Market Analysis, Insights and Forecast, 2021-2033
- 6.1. Market Analysis, Insights and Forecast - by Mode of Transport
- 6.1.1. Rail
- 6.1.2. Road
- 6.1.3. Other Modes of Transport
- 6.2. Market Analysis, Insights and Forecast - by Geography
- 6.2.1. China
- 6.2.2. Japan
- 6.2.3. India
- 6.2.4. South Korea
- 6.2.5. Indonesia
- 6.2.6. Vietnam
- 6.2.7. Australia
- 6.2.8. Rest of Asia-Pacific
- 6.1. Market Analysis, Insights and Forecast - by Mode of Transport
- 7. China Asia-Pacific Container Drayage Market Analysis, Insights and Forecast, 2020-2032
- 7.1. Market Analysis, Insights and Forecast - by Mode of Transport
- 7.1.1. Rail
- 7.1.2. Road
- 7.1.3. Other Modes of Transport
- 7.2. Market Analysis, Insights and Forecast - by Geography
- 7.2.1. China
- 7.2.2. Japan
- 7.2.3. India
- 7.2.4. South Korea
- 7.2.5. Indonesia
- 7.2.6. Vietnam
- 7.2.7. Australia
- 7.2.8. Rest of Asia-Pacific
- 7.1. Market Analysis, Insights and Forecast - by Mode of Transport
- 8. Japan Asia-Pacific Container Drayage Market Analysis, Insights and Forecast, 2020-2032
- 8.1. Market Analysis, Insights and Forecast - by Mode of Transport
- 8.1.1. Rail
- 8.1.2. Road
- 8.1.3. Other Modes of Transport
- 8.2. Market Analysis, Insights and Forecast - by Geography
- 8.2.1. China
- 8.2.2. Japan
- 8.2.3. India
- 8.2.4. South Korea
- 8.2.5. Indonesia
- 8.2.6. Vietnam
- 8.2.7. Australia
- 8.2.8. Rest of Asia-Pacific
- 8.1. Market Analysis, Insights and Forecast - by Mode of Transport
- 9. India Asia-Pacific Container Drayage Market Analysis, Insights and Forecast, 2020-2032
- 9.1. Market Analysis, Insights and Forecast - by Mode of Transport
- 9.1.1. Rail
- 9.1.2. Road
- 9.1.3. Other Modes of Transport
- 9.2. Market Analysis, Insights and Forecast - by Geography
- 9.2.1. China
- 9.2.2. Japan
- 9.2.3. India
- 9.2.4. South Korea
- 9.2.5. Indonesia
- 9.2.6. Vietnam
- 9.2.7. Australia
- 9.2.8. Rest of Asia-Pacific
- 9.1. Market Analysis, Insights and Forecast - by Mode of Transport
- 10. South Korea Asia-Pacific Container Drayage Market Analysis, Insights and Forecast, 2020-2032
- 10.1. Market Analysis, Insights and Forecast - by Mode of Transport
- 10.1.1. Rail
- 10.1.2. Road
- 10.1.3. Other Modes of Transport
- 10.2. Market Analysis, Insights and Forecast - by Geography
- 10.2.1. China
- 10.2.2. Japan
- 10.2.3. India
- 10.2.4. South Korea
- 10.2.5. Indonesia
- 10.2.6. Vietnam
- 10.2.7. Australia
- 10.2.8. Rest of Asia-Pacific
- 10.1. Market Analysis, Insights and Forecast - by Mode of Transport
- 11. Indonesia Asia-Pacific Container Drayage Market Analysis, Insights and Forecast, 2020-2032
- 11.1. Market Analysis, Insights and Forecast - by Mode of Transport
- 11.1.1. Rail
- 11.1.2. Road
- 11.1.3. Other Modes of Transport
- 11.2. Market Analysis, Insights and Forecast - by Geography
- 11.2.1. China
- 11.2.2. Japan
- 11.2.3. India
- 11.2.4. South Korea
- 11.2.5. Indonesia
- 11.2.6. Vietnam
- 11.2.7. Australia
- 11.2.8. Rest of Asia-Pacific
- 11.1. Market Analysis, Insights and Forecast - by Mode of Transport
- 12. Vietnam Asia-Pacific Container Drayage Market Analysis, Insights and Forecast, 2020-2032
- 12.1. Market Analysis, Insights and Forecast - by Mode of Transport
- 12.1.1. Rail
- 12.1.2. Road
- 12.1.3. Other Modes of Transport
- 12.2. Market Analysis, Insights and Forecast - by Geography
- 12.2.1. China
- 12.2.2. Japan
- 12.2.3. India
- 12.2.4. South Korea
- 12.2.5. Indonesia
- 12.2.6. Vietnam
- 12.2.7. Australia
- 12.2.8. Rest of Asia-Pacific
- 12.1. Market Analysis, Insights and Forecast - by Mode of Transport
- 13. Australia Asia-Pacific Container Drayage Market Analysis, Insights and Forecast, 2020-2032
- 13.1. Market Analysis, Insights and Forecast - by Mode of Transport
- 13.1.1. Rail
- 13.1.2. Road
- 13.1.3. Other Modes of Transport
- 13.2. Market Analysis, Insights and Forecast - by Geography
- 13.2.1. China
- 13.2.2. Japan
- 13.2.3. India
- 13.2.4. South Korea
- 13.2.5. Indonesia
- 13.2.6. Vietnam
- 13.2.7. Australia
- 13.2.8. Rest of Asia-Pacific
- 13.1. Market Analysis, Insights and Forecast - by Mode of Transport
- 14. Rest of Asia Pacific Asia-Pacific Container Drayage Market Analysis, Insights and Forecast, 2020-2032
- 14.1. Market Analysis, Insights and Forecast - by Mode of Transport
- 14.1.1. Rail
- 14.1.2. Road
- 14.1.3. Other Modes of Transport
- 14.2. Market Analysis, Insights and Forecast - by Geography
- 14.2.1. China
- 14.2.2. Japan
- 14.2.3. India
- 14.2.4. South Korea
- 14.2.5. Indonesia
- 14.2.6. Vietnam
- 14.2.7. Australia
- 14.2.8. Rest of Asia-Pacific
- 14.1. Market Analysis, Insights and Forecast - by Mode of Transport
- 15. Competitive Analysis
- 15.1. Company Profiles
- 15.1.1 Maersk Asia Pacific
- 15.1.1.1. Company Overview
- 15.1.1.2. Products
- 15.1.1.3. Company Financials
- 15.1.1.4. SWOT Analysis
- 15.1.2 Agility
- 15.1.2.1. Company Overview
- 15.1.2.2. Products
- 15.1.2.3. Company Financials
- 15.1.2.4. SWOT Analysis
- 15.1.3 C H Robinson Worldwide Inc
- 15.1.3.1. Company Overview
- 15.1.3.2. Products
- 15.1.3.3. Company Financials
- 15.1.3.4. SWOT Analysis
- 15.1.4 FedEx Corp
- 15.1.4.1. Company Overview
- 15.1.4.2. Products
- 15.1.4.3. Company Financials
- 15.1.4.4. SWOT Analysis
- 15.1.5 Deutsche Post DHL Group
- 15.1.5.1. Company Overview
- 15.1.5.2. Products
- 15.1.5.3. Company Financials
- 15.1.5.4. SWOT Analysis
- 15.1.6 Hitachi Ltd
- 15.1.6.1. Company Overview
- 15.1.6.2. Products
- 15.1.6.3. Company Financials
- 15.1.6.4. SWOT Analysis
- 15.1.7 CMA CGM SA Group
- 15.1.7.1. Company Overview
- 15.1.7.2. Products
- 15.1.7.3. Company Financials
- 15.1.7.4. SWOT Analysis
- 15.1.8 DB Schenker
- 15.1.8.1. Company Overview
- 15.1.8.2. Products
- 15.1.8.3. Company Financials
- 15.1.8.4. SWOT Analysis
- 15.1.9 United Parcel Services Inc
- 15.1.9.1. Company Overview
- 15.1.9.2. Products
- 15.1.9.3. Company Financials
- 15.1.9.4. SWOT Analysis
- 15.1.10 Ceva Logistics
- 15.1.10.1. Company Overview
- 15.1.10.2. Products
- 15.1.10.3. Company Financials
- 15.1.10.4. SWOT Analysis
- 15.1.11 Yusen Logistics Co Ltd**List Not Exhaustive 6 3 Other Companie
- 15.1.11.1. Company Overview
- 15.1.11.2. Products
- 15.1.11.3. Company Financials
- 15.1.11.4. SWOT Analysis
- 15.1.1 Maersk Asia Pacific
- 15.2. Market Entropy
- 15.2.1 Company's Key Areas Served
- 15.2.2 Recent Developments
- 15.3. Company Market Share Analysis 2025
- 15.3.1 Top 5 Companies Market Share Analysis
- 15.3.2 Top 3 Companies Market Share Analysis
- 15.4. List of Potential Customers
- 16. Research Methodology
List of Figures
- Figure 1: Global Asia-Pacific Container Drayage Market Revenue Breakdown (Million, %) by Region 2025 & 2033
- Figure 2: Global Asia-Pacific Container Drayage Market Volume Breakdown (Billion, %) by Region 2025 & 2033
- Figure 3: China Asia-Pacific Container Drayage Market Revenue (Million), by Mode of Transport 2025 & 2033
- Figure 4: China Asia-Pacific Container Drayage Market Volume (Billion), by Mode of Transport 2025 & 2033
- Figure 5: China Asia-Pacific Container Drayage Market Revenue Share (%), by Mode of Transport 2025 & 2033
- Figure 6: China Asia-Pacific Container Drayage Market Volume Share (%), by Mode of Transport 2025 & 2033
- Figure 7: China Asia-Pacific Container Drayage Market Revenue (Million), by Geography 2025 & 2033
- Figure 8: China Asia-Pacific Container Drayage Market Volume (Billion), by Geography 2025 & 2033
- Figure 9: China Asia-Pacific Container Drayage Market Revenue Share (%), by Geography 2025 & 2033
- Figure 10: China Asia-Pacific Container Drayage Market Volume Share (%), by Geography 2025 & 2033
- Figure 11: China Asia-Pacific Container Drayage Market Revenue (Million), by Country 2025 & 2033
- Figure 12: China Asia-Pacific Container Drayage Market Volume (Billion), by Country 2025 & 2033
- Figure 13: China Asia-Pacific Container Drayage Market Revenue Share (%), by Country 2025 & 2033
- Figure 14: China Asia-Pacific Container Drayage Market Volume Share (%), by Country 2025 & 2033
- Figure 15: Japan Asia-Pacific Container Drayage Market Revenue (Million), by Mode of Transport 2025 & 2033
- Figure 16: Japan Asia-Pacific Container Drayage Market Volume (Billion), by Mode of Transport 2025 & 2033
- Figure 17: Japan Asia-Pacific Container Drayage Market Revenue Share (%), by Mode of Transport 2025 & 2033
- Figure 18: Japan Asia-Pacific Container Drayage Market Volume Share (%), by Mode of Transport 2025 & 2033
- Figure 19: Japan Asia-Pacific Container Drayage Market Revenue (Million), by Geography 2025 & 2033
- Figure 20: Japan Asia-Pacific Container Drayage Market Volume (Billion), by Geography 2025 & 2033
- Figure 21: Japan Asia-Pacific Container Drayage Market Revenue Share (%), by Geography 2025 & 2033
- Figure 22: Japan Asia-Pacific Container Drayage Market Volume Share (%), by Geography 2025 & 2033
- Figure 23: Japan Asia-Pacific Container Drayage Market Revenue (Million), by Country 2025 & 2033
- Figure 24: Japan Asia-Pacific Container Drayage Market Volume (Billion), by Country 2025 & 2033
- Figure 25: Japan Asia-Pacific Container Drayage Market Revenue Share (%), by Country 2025 & 2033
- Figure 26: Japan Asia-Pacific Container Drayage Market Volume Share (%), by Country 2025 & 2033
- Figure 27: India Asia-Pacific Container Drayage Market Revenue (Million), by Mode of Transport 2025 & 2033
- Figure 28: India Asia-Pacific Container Drayage Market Volume (Billion), by Mode of Transport 2025 & 2033
- Figure 29: India Asia-Pacific Container Drayage Market Revenue Share (%), by Mode of Transport 2025 & 2033
- Figure 30: India Asia-Pacific Container Drayage Market Volume Share (%), by Mode of Transport 2025 & 2033
- Figure 31: India Asia-Pacific Container Drayage Market Revenue (Million), by Geography 2025 & 2033
- Figure 32: India Asia-Pacific Container Drayage Market Volume (Billion), by Geography 2025 & 2033
- Figure 33: India Asia-Pacific Container Drayage Market Revenue Share (%), by Geography 2025 & 2033
- Figure 34: India Asia-Pacific Container Drayage Market Volume Share (%), by Geography 2025 & 2033
- Figure 35: India Asia-Pacific Container Drayage Market Revenue (Million), by Country 2025 & 2033
- Figure 36: India Asia-Pacific Container Drayage Market Volume (Billion), by Country 2025 & 2033
- Figure 37: India Asia-Pacific Container Drayage Market Revenue Share (%), by Country 2025 & 2033
- Figure 38: India Asia-Pacific Container Drayage Market Volume Share (%), by Country 2025 & 2033
- Figure 39: South Korea Asia-Pacific Container Drayage Market Revenue (Million), by Mode of Transport 2025 & 2033
- Figure 40: South Korea Asia-Pacific Container Drayage Market Volume (Billion), by Mode of Transport 2025 & 2033
- Figure 41: South Korea Asia-Pacific Container Drayage Market Revenue Share (%), by Mode of Transport 2025 & 2033
- Figure 42: South Korea Asia-Pacific Container Drayage Market Volume Share (%), by Mode of Transport 2025 & 2033
- Figure 43: South Korea Asia-Pacific Container Drayage Market Revenue (Million), by Geography 2025 & 2033
- Figure 44: South Korea Asia-Pacific Container Drayage Market Volume (Billion), by Geography 2025 & 2033
- Figure 45: South Korea Asia-Pacific Container Drayage Market Revenue Share (%), by Geography 2025 & 2033
- Figure 46: South Korea Asia-Pacific Container Drayage Market Volume Share (%), by Geography 2025 & 2033
- Figure 47: South Korea Asia-Pacific Container Drayage Market Revenue (Million), by Country 2025 & 2033
- Figure 48: South Korea Asia-Pacific Container Drayage Market Volume (Billion), by Country 2025 & 2033
- Figure 49: South Korea Asia-Pacific Container Drayage Market Revenue Share (%), by Country 2025 & 2033
- Figure 50: South Korea Asia-Pacific Container Drayage Market Volume Share (%), by Country 2025 & 2033
- Figure 51: Indonesia Asia-Pacific Container Drayage Market Revenue (Million), by Mode of Transport 2025 & 2033
- Figure 52: Indonesia Asia-Pacific Container Drayage Market Volume (Billion), by Mode of Transport 2025 & 2033
- Figure 53: Indonesia Asia-Pacific Container Drayage Market Revenue Share (%), by Mode of Transport 2025 & 2033
- Figure 54: Indonesia Asia-Pacific Container Drayage Market Volume Share (%), by Mode of Transport 2025 & 2033
- Figure 55: Indonesia Asia-Pacific Container Drayage Market Revenue (Million), by Geography 2025 & 2033
- Figure 56: Indonesia Asia-Pacific Container Drayage Market Volume (Billion), by Geography 2025 & 2033
- Figure 57: Indonesia Asia-Pacific Container Drayage Market Revenue Share (%), by Geography 2025 & 2033
- Figure 58: Indonesia Asia-Pacific Container Drayage Market Volume Share (%), by Geography 2025 & 2033
- Figure 59: Indonesia Asia-Pacific Container Drayage Market Revenue (Million), by Country 2025 & 2033
- Figure 60: Indonesia Asia-Pacific Container Drayage Market Volume (Billion), by Country 2025 & 2033
- Figure 61: Indonesia Asia-Pacific Container Drayage Market Revenue Share (%), by Country 2025 & 2033
- Figure 62: Indonesia Asia-Pacific Container Drayage Market Volume Share (%), by Country 2025 & 2033
- Figure 63: Vietnam Asia-Pacific Container Drayage Market Revenue (Million), by Mode of Transport 2025 & 2033
- Figure 64: Vietnam Asia-Pacific Container Drayage Market Volume (Billion), by Mode of Transport 2025 & 2033
- Figure 65: Vietnam Asia-Pacific Container Drayage Market Revenue Share (%), by Mode of Transport 2025 & 2033
- Figure 66: Vietnam Asia-Pacific Container Drayage Market Volume Share (%), by Mode of Transport 2025 & 2033
- Figure 67: Vietnam Asia-Pacific Container Drayage Market Revenue (Million), by Geography 2025 & 2033
- Figure 68: Vietnam Asia-Pacific Container Drayage Market Volume (Billion), by Geography 2025 & 2033
- Figure 69: Vietnam Asia-Pacific Container Drayage Market Revenue Share (%), by Geography 2025 & 2033
- Figure 70: Vietnam Asia-Pacific Container Drayage Market Volume Share (%), by Geography 2025 & 2033
- Figure 71: Vietnam Asia-Pacific Container Drayage Market Revenue (Million), by Country 2025 & 2033
- Figure 72: Vietnam Asia-Pacific Container Drayage Market Volume (Billion), by Country 2025 & 2033
- Figure 73: Vietnam Asia-Pacific Container Drayage Market Revenue Share (%), by Country 2025 & 2033
- Figure 74: Vietnam Asia-Pacific Container Drayage Market Volume Share (%), by Country 2025 & 2033
- Figure 75: Australia Asia-Pacific Container Drayage Market Revenue (Million), by Mode of Transport 2025 & 2033
- Figure 76: Australia Asia-Pacific Container Drayage Market Volume (Billion), by Mode of Transport 2025 & 2033
- Figure 77: Australia Asia-Pacific Container Drayage Market Revenue Share (%), by Mode of Transport 2025 & 2033
- Figure 78: Australia Asia-Pacific Container Drayage Market Volume Share (%), by Mode of Transport 2025 & 2033
- Figure 79: Australia Asia-Pacific Container Drayage Market Revenue (Million), by Geography 2025 & 2033
- Figure 80: Australia Asia-Pacific Container Drayage Market Volume (Billion), by Geography 2025 & 2033
- Figure 81: Australia Asia-Pacific Container Drayage Market Revenue Share (%), by Geography 2025 & 2033
- Figure 82: Australia Asia-Pacific Container Drayage Market Volume Share (%), by Geography 2025 & 2033
- Figure 83: Australia Asia-Pacific Container Drayage Market Revenue (Million), by Country 2025 & 2033
- Figure 84: Australia Asia-Pacific Container Drayage Market Volume (Billion), by Country 2025 & 2033
- Figure 85: Australia Asia-Pacific Container Drayage Market Revenue Share (%), by Country 2025 & 2033
- Figure 86: Australia Asia-Pacific Container Drayage Market Volume Share (%), by Country 2025 & 2033
- Figure 87: Rest of Asia Pacific Asia-Pacific Container Drayage Market Revenue (Million), by Mode of Transport 2025 & 2033
- Figure 88: Rest of Asia Pacific Asia-Pacific Container Drayage Market Volume (Billion), by Mode of Transport 2025 & 2033
- Figure 89: Rest of Asia Pacific Asia-Pacific Container Drayage Market Revenue Share (%), by Mode of Transport 2025 & 2033
- Figure 90: Rest of Asia Pacific Asia-Pacific Container Drayage Market Volume Share (%), by Mode of Transport 2025 & 2033
- Figure 91: Rest of Asia Pacific Asia-Pacific Container Drayage Market Revenue (Million), by Geography 2025 & 2033
- Figure 92: Rest of Asia Pacific Asia-Pacific Container Drayage Market Volume (Billion), by Geography 2025 & 2033
- Figure 93: Rest of Asia Pacific Asia-Pacific Container Drayage Market Revenue Share (%), by Geography 2025 & 2033
- Figure 94: Rest of Asia Pacific Asia-Pacific Container Drayage Market Volume Share (%), by Geography 2025 & 2033
- Figure 95: Rest of Asia Pacific Asia-Pacific Container Drayage Market Revenue (Million), by Country 2025 & 2033
- Figure 96: Rest of Asia Pacific Asia-Pacific Container Drayage Market Volume (Billion), by Country 2025 & 2033
- Figure 97: Rest of Asia Pacific Asia-Pacific Container Drayage Market Revenue Share (%), by Country 2025 & 2033
- Figure 98: Rest of Asia Pacific Asia-Pacific Container Drayage Market Volume Share (%), by Country 2025 & 2033
List of Tables
- Table 1: Global Asia-Pacific Container Drayage Market Revenue Million Forecast, by Mode of Transport 2020 & 2033
- Table 2: Global Asia-Pacific Container Drayage Market Volume Billion Forecast, by Mode of Transport 2020 & 2033
- Table 3: Global Asia-Pacific Container Drayage Market Revenue Million Forecast, by Geography 2020 & 2033
- Table 4: Global Asia-Pacific Container Drayage Market Volume Billion Forecast, by Geography 2020 & 2033
- Table 5: Global Asia-Pacific Container Drayage Market Revenue Million Forecast, by Region 2020 & 2033
- Table 6: Global Asia-Pacific Container Drayage Market Volume Billion Forecast, by Region 2020 & 2033
- Table 7: Global Asia-Pacific Container Drayage Market Revenue Million Forecast, by Mode of Transport 2020 & 2033
- Table 8: Global Asia-Pacific Container Drayage Market Volume Billion Forecast, by Mode of Transport 2020 & 2033
- Table 9: Global Asia-Pacific Container Drayage Market Revenue Million Forecast, by Geography 2020 & 2033
- Table 10: Global Asia-Pacific Container Drayage Market Volume Billion Forecast, by Geography 2020 & 2033
- Table 11: Global Asia-Pacific Container Drayage Market Revenue Million Forecast, by Country 2020 & 2033
- Table 12: Global Asia-Pacific Container Drayage Market Volume Billion Forecast, by Country 2020 & 2033
- Table 13: Global Asia-Pacific Container Drayage Market Revenue Million Forecast, by Mode of Transport 2020 & 2033
- Table 14: Global Asia-Pacific Container Drayage Market Volume Billion Forecast, by Mode of Transport 2020 & 2033
- Table 15: Global Asia-Pacific Container Drayage Market Revenue Million Forecast, by Geography 2020 & 2033
- Table 16: Global Asia-Pacific Container Drayage Market Volume Billion Forecast, by Geography 2020 & 2033
- Table 17: Global Asia-Pacific Container Drayage Market Revenue Million Forecast, by Country 2020 & 2033
- Table 18: Global Asia-Pacific Container Drayage Market Volume Billion Forecast, by Country 2020 & 2033
- Table 19: Global Asia-Pacific Container Drayage Market Revenue Million Forecast, by Mode of Transport 2020 & 2033
- Table 20: Global Asia-Pacific Container Drayage Market Volume Billion Forecast, by Mode of Transport 2020 & 2033
- Table 21: Global Asia-Pacific Container Drayage Market Revenue Million Forecast, by Geography 2020 & 2033
- Table 22: Global Asia-Pacific Container Drayage Market Volume Billion Forecast, by Geography 2020 & 2033
- Table 23: Global Asia-Pacific Container Drayage Market Revenue Million Forecast, by Country 2020 & 2033
- Table 24: Global Asia-Pacific Container Drayage Market Volume Billion Forecast, by Country 2020 & 2033
- Table 25: Global Asia-Pacific Container Drayage Market Revenue Million Forecast, by Mode of Transport 2020 & 2033
- Table 26: Global Asia-Pacific Container Drayage Market Volume Billion Forecast, by Mode of Transport 2020 & 2033
- Table 27: Global Asia-Pacific Container Drayage Market Revenue Million Forecast, by Geography 2020 & 2033
- Table 28: Global Asia-Pacific Container Drayage Market Volume Billion Forecast, by Geography 2020 & 2033
- Table 29: Global Asia-Pacific Container Drayage Market Revenue Million Forecast, by Country 2020 & 2033
- Table 30: Global Asia-Pacific Container Drayage Market Volume Billion Forecast, by Country 2020 & 2033
- Table 31: Global Asia-Pacific Container Drayage Market Revenue Million Forecast, by Mode of Transport 2020 & 2033
- Table 32: Global Asia-Pacific Container Drayage Market Volume Billion Forecast, by Mode of Transport 2020 & 2033
- Table 33: Global Asia-Pacific Container Drayage Market Revenue Million Forecast, by Geography 2020 & 2033
- Table 34: Global Asia-Pacific Container Drayage Market Volume Billion Forecast, by Geography 2020 & 2033
- Table 35: Global Asia-Pacific Container Drayage Market Revenue Million Forecast, by Country 2020 & 2033
- Table 36: Global Asia-Pacific Container Drayage Market Volume Billion Forecast, by Country 2020 & 2033
- Table 37: Global Asia-Pacific Container Drayage Market Revenue Million Forecast, by Mode of Transport 2020 & 2033
- Table 38: Global Asia-Pacific Container Drayage Market Volume Billion Forecast, by Mode of Transport 2020 & 2033
- Table 39: Global Asia-Pacific Container Drayage Market Revenue Million Forecast, by Geography 2020 & 2033
- Table 40: Global Asia-Pacific Container Drayage Market Volume Billion Forecast, by Geography 2020 & 2033
- Table 41: Global Asia-Pacific Container Drayage Market Revenue Million Forecast, by Country 2020 & 2033
- Table 42: Global Asia-Pacific Container Drayage Market Volume Billion Forecast, by Country 2020 & 2033
- Table 43: Global Asia-Pacific Container Drayage Market Revenue Million Forecast, by Mode of Transport 2020 & 2033
- Table 44: Global Asia-Pacific Container Drayage Market Volume Billion Forecast, by Mode of Transport 2020 & 2033
- Table 45: Global Asia-Pacific Container Drayage Market Revenue Million Forecast, by Geography 2020 & 2033
- Table 46: Global Asia-Pacific Container Drayage Market Volume Billion Forecast, by Geography 2020 & 2033
- Table 47: Global Asia-Pacific Container Drayage Market Revenue Million Forecast, by Country 2020 & 2033
- Table 48: Global Asia-Pacific Container Drayage Market Volume Billion Forecast, by Country 2020 & 2033
- Table 49: Global Asia-Pacific Container Drayage Market Revenue Million Forecast, by Mode of Transport 2020 & 2033
- Table 50: Global Asia-Pacific Container Drayage Market Volume Billion Forecast, by Mode of Transport 2020 & 2033
- Table 51: Global Asia-Pacific Container Drayage Market Revenue Million Forecast, by Geography 2020 & 2033
- Table 52: Global Asia-Pacific Container Drayage Market Volume Billion Forecast, by Geography 2020 & 2033
- Table 53: Global Asia-Pacific Container Drayage Market Revenue Million Forecast, by Country 2020 & 2033
- Table 54: Global Asia-Pacific Container Drayage Market Volume Billion Forecast, by Country 2020 & 2033
Frequently Asked Questions
1. What is the projected Compound Annual Growth Rate (CAGR) of the Asia-Pacific Container Drayage Market?
The projected CAGR is approximately 8.23%.
2. Which companies are prominent players in the Asia-Pacific Container Drayage Market?
Key companies in the market include Maersk Asia Pacific, Agility, C H Robinson Worldwide Inc, FedEx Corp, Deutsche Post DHL Group, Hitachi Ltd, CMA CGM SA Group, DB Schenker, United Parcel Services Inc, Ceva Logistics, Yusen Logistics Co Ltd**List Not Exhaustive 6 3 Other Companie.
3. What are the main segments of the Asia-Pacific Container Drayage Market?
The market segments include Mode of Transport, Geography.
4. Can you provide details about the market size?
The market size is estimated to be USD 14.36 Million as of 2022.
5. What are some drivers contributing to market growth?
4.; Increasing Railway Trade4.; Growing E-commerce Sector.
6. What are the notable trends driving market growth?
Port Congestion Easing in Key Asian Hubs. Surge in Demand for Container Drayage Driving the Transportation Segment.
7. Are there any restraints impacting market growth?
4.; Increasing Railway Trade4.; Growing E-commerce Sector.
8. Can you provide examples of recent developments in the market?
July 2024: DP World, the Dubai-based ports and logistics leader, unveiled 51 fresh freight forwarding offices in the Asia-Pacific. These new offices, specializing in air and ocean freight, leverage DP World's robust infrastructure, spanning ports, terminals, warehouses, trucks, rail, and vessels.February 2024: HERE Technologies, a leading provider of location data and technology solutions, partnered with PSA Singapore, the operator of the world's largest transshipment hub, to transform Singapore's container truck ecosystem. Their goal is to boost the efficiency of goods transportation within Singapore's terminals. Singapore, a global maritime leader, hosts the world's second busiest container port, the Port of Singapore. PSA's network spans 600+ ports globally, and in the previous year, it managed an impressive 38.8 million TEUs.
9. What pricing options are available for accessing the report?
Pricing options include single-user, multi-user, and enterprise licenses priced at USD 4750, USD 5250, and USD 8750 respectively.
10. Is the market size provided in terms of value or volume?
The market size is provided in terms of value, measured in Million and volume, measured in Billion.
11. Are there any specific market keywords associated with the report?
Yes, the market keyword associated with the report is "Asia-Pacific Container Drayage Market," which aids in identifying and referencing the specific market segment covered.
12. How do I determine which pricing option suits my needs best?
The pricing options vary based on user requirements and access needs. Individual users may opt for single-user licenses, while businesses requiring broader access may choose multi-user or enterprise licenses for cost-effective access to the report.
13. Are there any additional resources or data provided in the Asia-Pacific Container Drayage Market report?
While the report offers comprehensive insights, it's advisable to review the specific contents or supplementary materials provided to ascertain if additional resources or data are available.
14. How can I stay updated on further developments or reports in the Asia-Pacific Container Drayage Market?
To stay informed about further developments, trends, and reports in the Asia-Pacific Container Drayage Market, consider subscribing to industry newsletters, following relevant companies and organizations, or regularly checking reputable industry news sources and publications.
Methodology
Step 1 - Identification of Relevant Samples Size from Population Database


Step 2 - Approaches for Defining Global Market Size (Value, Volume* & Price*)

Note*: In applicable scenarios
Step 3 - Data Sources
Primary Research
- Web Analytics
- Survey Reports
- Research Institute
- Latest Research Reports
- Opinion Leaders
Secondary Research
- Annual Reports
- White Paper
- Latest Press Release
- Industry Association
- Paid Database
- Investor Presentations

Step 4 - Data Triangulation
Involves using different sources of information in order to increase the validity of a study
These sources are likely to be stakeholders in a program - participants, other researchers, program staff, other community members, and so on.
Then we put all data in single framework & apply various statistical tools to find out the dynamic on the market.
During the analysis stage, feedback from the stakeholder groups would be compared to determine areas of agreement as well as areas of divergence