

Key Insights
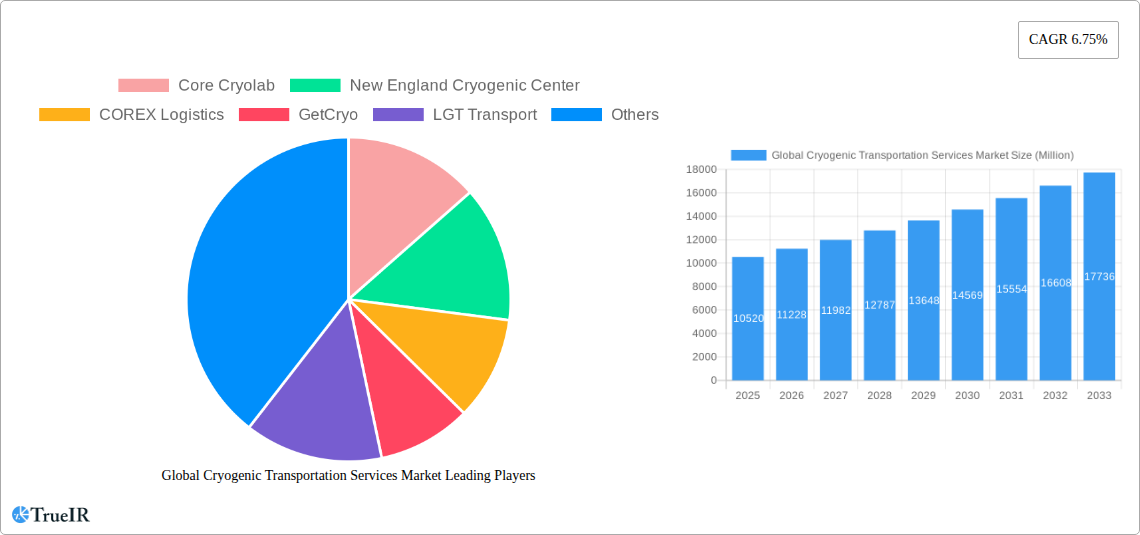
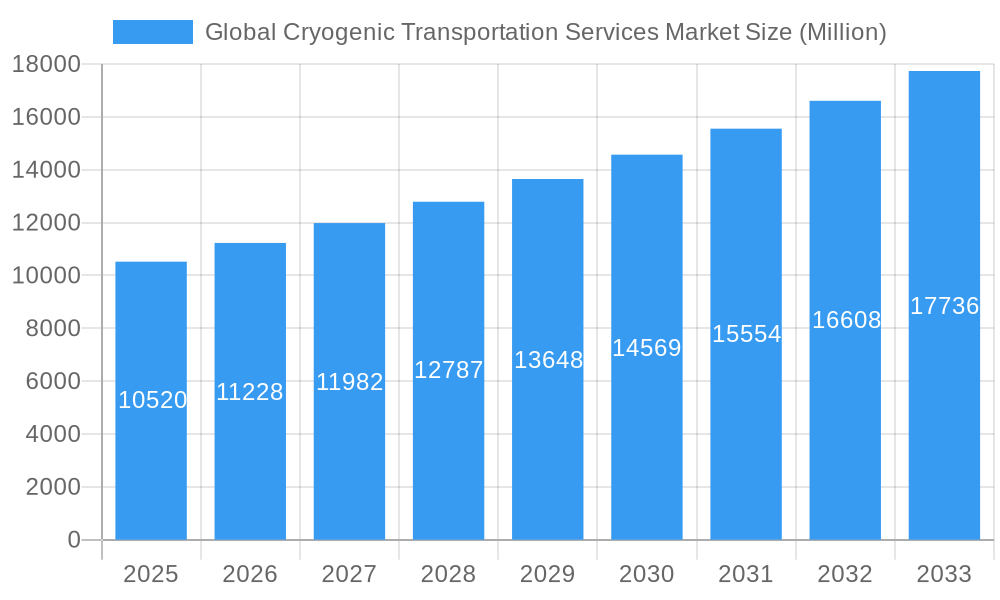
The global cryogenic transportation services market is experiencing robust growth, projected to reach a market size of $10.52 billion in 2025 and maintain a Compound Annual Growth Rate (CAGR) of 6.75% from 2025 to 2033. This expansion is driven by the increasing demand for temperature-sensitive pharmaceuticals, biological specimens, and industrial gases across diverse sectors like healthcare, biotechnology, and manufacturing. The rising prevalence of chronic diseases necessitates the efficient and reliable transportation of life-saving medications, fueling the market's growth. Furthermore, advancements in cryogenic transportation technology, including improved insulation techniques and container designs, are enhancing efficiency and safety, encouraging wider adoption. The market is segmented by transportation mode (trailer and truck) and application (chemicals, drugs, biological specimens, industrial gases, and other applications), with the pharmaceutical and healthcare segments expected to dominate due to the stringent temperature requirements for drug efficacy and patient safety. Geographical expansion is also a key driver; regions like Asia-Pacific are exhibiting significant growth potential due to expanding healthcare infrastructure and rising disposable incomes.
Global Cryogenic Transportation Services Market Market Size (In Billion)
However, challenges remain. Stringent regulatory frameworks governing the transportation of hazardous materials, coupled with the high capital expenditure required for specialized equipment and infrastructure, may hinder market growth to some extent. Fluctuations in fuel prices also pose a risk to operational costs. Nevertheless, the overall outlook for the cryogenic transportation services market remains positive, driven by increasing demand for temperature-sensitive products and ongoing technological advancements. The market is characterized by a mix of large established players and smaller specialized firms, leading to a competitive landscape with opportunities for both consolidation and innovation. Further growth is anticipated through strategic partnerships and investments aimed at expanding capacity and service offerings to meet the evolving needs of various industries.
Global Cryogenic Transportation Services Market Company Market Share
Global Cryogenic Transportation Services Market Report: 2019-2033
This comprehensive report provides a detailed analysis of the global cryogenic transportation services market, offering invaluable insights for businesses, investors, and researchers. The study period covers 2019-2033, with a base year of 2025 and a forecast period of 2025-2033. The report leverages extensive data analysis to project market size exceeding xx Million by 2033, presenting a compelling overview of market trends, opportunities, and challenges. This dynamic report is meticulously crafted to enhance search engine rankings and engagement within the industry.
Global Cryogenic Transportation Services Market Market Structure & Competitive Landscape
The global cryogenic transportation services market exhibits a moderately concentrated structure, with several major players holding significant market share. The Herfindahl-Hirschman Index (HHI) is estimated at xx, indicating a moderately competitive landscape. Innovation drivers include advancements in cryogenic tank technology, improved temperature control systems, and the development of specialized transportation solutions for sensitive materials. Regulatory impacts, particularly those concerning the safe transportation of hazardous materials (like industrial gases and biological specimens), significantly influence market operations. Product substitutes are limited, primarily due to the specialized nature of cryogenic transportation. The market is segmented by end-user industries, primarily Chemicals, Drugs, Biological Specimens, Industrial Gases, and Other Applications. Mergers and acquisitions (M&A) activity has been moderate in recent years, with xx M&A deals recorded between 2019 and 2024. Key M&A trends include consolidation among smaller players and strategic acquisitions by larger companies seeking to expand their geographic reach or service offerings.
- Market Concentration: Moderately concentrated, HHI estimated at xx.
- Innovation Drivers: Advancements in cryogenic tank technology, temperature control systems.
- Regulatory Impacts: Stringent regulations for hazardous material transportation.
- Product Substitutes: Limited due to specialized nature of cryogenic transportation.
- End-User Segmentation: Chemicals, Drugs, Biological Specimens, Industrial Gases, Other Applications.
- M&A Trends: Moderate activity, xx deals between 2019-2024, driven by consolidation and expansion.
Global Cryogenic Transportation Services Market Market Trends & Opportunities
The global cryogenic transportation services market is experiencing significant growth, driven by increasing demand for temperature-sensitive products across various industries. The market size is projected to reach xx Million by 2033, exhibiting a Compound Annual Growth Rate (CAGR) of xx% during the forecast period (2025-2033). This growth is fueled by technological advancements that enhance the efficiency and safety of cryogenic transportation, such as improved insulation materials and real-time temperature monitoring systems. Changing consumer preferences towards high-quality, temperature-sensitive products further boost market demand. Intense competition among market players is driving innovation and efficiency improvements, benefiting both businesses and consumers. Market penetration rates vary significantly across different regions and applications, with higher penetration observed in developed economies and industries with high demand for cryogenic transportation.
Dominant Markets & Segments in Global Cryogenic Transportation Services Market
North America currently dominates the global cryogenic transportation services market, driven by factors such as well-established infrastructure, stringent regulatory frameworks, and high demand from the pharmaceutical and healthcare sectors. Within the segment breakdown:
- By Type: Truck transportation holds a larger market share compared to trailer transportation due to its flexibility and accessibility.
- By Application: The pharmaceutical segment is the leading application area, followed by the industrial gases segment.
Key Growth Drivers:
- North America: Strong pharmaceutical industry, well-developed infrastructure, stringent regulations.
- Europe: Growing demand for cryogenic transportation of biological specimens and pharmaceuticals.
- Asia-Pacific: Rapid economic growth, increasing investments in healthcare and industrial sectors.
Global Cryogenic Transportation Services Market Product Analysis
The cryogenic transportation services market showcases continuous innovation in tank design, temperature control systems, and monitoring technologies. Advancements include the use of advanced insulation materials to minimize energy consumption and maintain optimal temperatures during transit. Real-time tracking and monitoring systems ensure the safety and integrity of transported goods. The market fit for these innovations is strong, driven by the increasing demand for secure and reliable transportation of temperature-sensitive goods.
Key Drivers, Barriers & Challenges in Global Cryogenic Transportation Services Market
Key Drivers: Growing demand for temperature-sensitive products across diverse industries (pharmaceuticals, healthcare, industrial gases), technological advancements in cryogenic tank technology and monitoring systems, and supportive government regulations promoting efficient and safe transportation of hazardous materials.
Challenges: Stringent regulations related to hazardous material transportation impose significant operational costs and compliance challenges. Supply chain disruptions can impact transportation efficiency and costs, and intense competition among market players can put downward pressure on pricing.
Growth Drivers in the Global Cryogenic Transportation Services Market Market
The market's growth is fueled by the rising demand for temperature-sensitive goods in healthcare, pharmaceuticals, and industrial sectors. Technological improvements in cryogenic transportation, such as advanced insulation and real-time monitoring, further boost efficiency and safety. Supportive government regulations, encouraging the safe transport of hazardous materials, create a favorable environment for market expansion.
Challenges Impacting Global Cryogenic Transportation Services Market Growth
Regulatory complexities and compliance costs associated with hazardous material transport pose significant challenges. Supply chain disruptions, such as those caused by geopolitical instability or natural disasters, can severely impact transportation efficiency. Furthermore, intense competition can lead to price wars and reduced profit margins, hindering growth.
Key Players Shaping the Global Cryogenic Transportation Services Market Market
- Core Cryolab
- New England Cryogenic Center
- COREX Logistics
- GetCryo
- LGT Transport
- Applied Cryo Technologies
- US Cryo Carriers
- McCollister's
- Legacy Cryogenic
- KAG
- Texas Gas Transport
- 7 3 Other Companies
- Hingham Moving
- Champion Moving
Significant Global Cryogenic Transportation Services Market Industry Milestones
- September 2023: Core Cryolab opened a second state-of-the-art facility, enhancing its capacity and reinforcing its commitment to sample safety.
- October 2023: COREX Logistics joined the Irish Pharmaceutical Health Association, strengthening its position within the pharmaceutical industry and influencing regulatory landscape.
Future Outlook for Global Cryogenic Transportation Services Market Market
The global cryogenic transportation services market is poised for continued growth, driven by the expanding demand for temperature-sensitive products and ongoing technological advancements. Strategic investments in innovative solutions and expansion into new geographical markets present significant opportunities for market players. The market's future is bright, with substantial potential for expansion and innovation.
Global Cryogenic Transportation Services Market Segmentation
-
1. Type
- 1.1. Trailer Transportation
- 1.2. Truck Transportation
-
2. Application
- 2.1. Chemicals
- 2.2. Drug
- 2.3. Biological Specimens
- 2.4. Industrial Gases
- 2.5. Other Applications
Global Cryogenic Transportation Services Market Segmentation By Geography
-
1. North America
- 1.1. United States
- 1.2. Canada
- 1.3. Mexico
-
2. Europe
- 2.1. Germany
- 2.2. France
- 2.3. Italy
- 2.4. United Kingdom
- 2.5. Spain
- 2.6. Rest of Europe
-
3. Asia Pacific
- 3.1. China
- 3.2. India
- 3.3. Japan
- 3.4. Australia
- 3.5. Singapore
- 3.6. Indonesia
- 3.7. South Korea
- 3.8. Malaysia
- 3.9. Rest of Asia Pacific
-
4. Middle East and Africa
- 4.1. Saudi Arabia
- 4.2. Qatar
- 4.3. Oman
- 4.4. Rest of Middle East and Africa
-
5. Latin America
- 5.1. Brazil
- 5.2. Argentina
- 5.3. Chile
- 5.4. Rest of Latin America
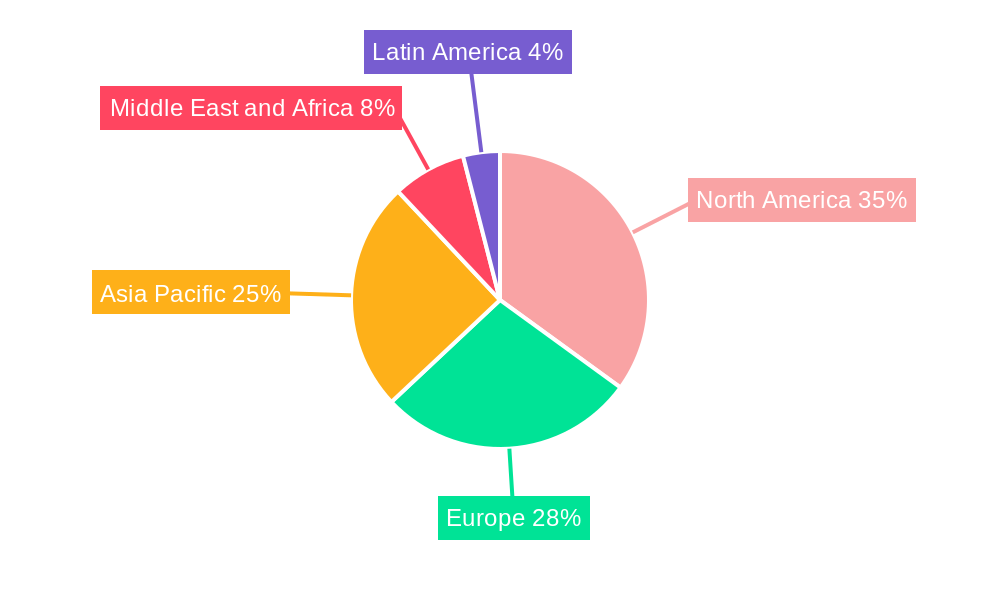
Global Cryogenic Transportation Services Market Regional Market Share
Geographic Coverage of Global Cryogenic Transportation Services Market
Global Cryogenic Transportation Services Market REPORT HIGHLIGHTS
| Aspects | Details |
|---|---|
| Study Period | 2020-2034 |
| Base Year | 2025 |
| Estimated Year | 2026 |
| Forecast Period | 2026-2034 |
| Historical Period | 2020-2025 |
| Growth Rate | CAGR of 6.75% from 2020-2034 |
| Segmentation |
|
Table of Contents
- 1. Introduction
- 1.1. Research Scope
- 1.2. Market Segmentation
- 1.3. Research Objective
- 1.4. Definitions and Assumptions
- 2. Executive Summary
- 2.1. Market Snapshot
- 3. Market Dynamics
- 3.1. Market Drivers
- 3.2. Market Restrains
- 3.3. Market Trends
- 3.4. Market Opportunities
- 4. Market Factor Analysis
- 4.1. Porters Five Forces
- 4.1.1. Bargaining Power of Suppliers
- 4.1.2. Bargaining Power of Buyers
- 4.1.3. Threat of New Entrants
- 4.1.4. Threat of Substitutes
- 4.1.5. Competitive Rivalry
- 4.2. PESTEL analysis
- 4.3. BCG Analysis
- 4.3.1. Stars (High Growth, High Market Share)
- 4.3.2. Cash Cows (Low Growth, High Market Share)
- 4.3.3. Question Mark (High Growth, Low Market Share)
- 4.3.4. Dogs (Low Growth, Low Market Share)
- 4.4. Ansoff Matrix Analysis
- 4.5. Supply Chain Analysis
- 4.6. Regulatory Landscape
- 4.7. Current Market Potential and Opportunity Assessment (TAM–SAM–SOM Framework)
- 4.8. TIR Analyst Note
- 4.1. Porters Five Forces
- 5. Market Analysis, Insights and Forecast 2021-2033
- 5.1. Market Analysis, Insights and Forecast - by Type
- 5.1.1. Trailer Transportation
- 5.1.2. Truck Transportation
- 5.2. Market Analysis, Insights and Forecast - by Application
- 5.2.1. Chemicals
- 5.2.2. Drug
- 5.2.3. Biological Specimens
- 5.2.4. Industrial Gases
- 5.2.5. Other Applications
- 5.3. Market Analysis, Insights and Forecast - by Region
- 5.3.1. North America
- 5.3.2. Europe
- 5.3.3. Asia Pacific
- 5.3.4. Middle East and Africa
- 5.3.5. Latin America
- 5.1. Market Analysis, Insights and Forecast - by Type
- 6. Global Cryogenic Transportation Services Market Analysis, Insights and Forecast, 2021-2033
- 6.1. Market Analysis, Insights and Forecast - by Type
- 6.1.1. Trailer Transportation
- 6.1.2. Truck Transportation
- 6.2. Market Analysis, Insights and Forecast - by Application
- 6.2.1. Chemicals
- 6.2.2. Drug
- 6.2.3. Biological Specimens
- 6.2.4. Industrial Gases
- 6.2.5. Other Applications
- 6.1. Market Analysis, Insights and Forecast - by Type
- 7. North America Global Cryogenic Transportation Services Market Analysis, Insights and Forecast, 2020-2032
- 7.1. Market Analysis, Insights and Forecast - by Type
- 7.1.1. Trailer Transportation
- 7.1.2. Truck Transportation
- 7.2. Market Analysis, Insights and Forecast - by Application
- 7.2.1. Chemicals
- 7.2.2. Drug
- 7.2.3. Biological Specimens
- 7.2.4. Industrial Gases
- 7.2.5. Other Applications
- 7.1. Market Analysis, Insights and Forecast - by Type
- 8. Europe Global Cryogenic Transportation Services Market Analysis, Insights and Forecast, 2020-2032
- 8.1. Market Analysis, Insights and Forecast - by Type
- 8.1.1. Trailer Transportation
- 8.1.2. Truck Transportation
- 8.2. Market Analysis, Insights and Forecast - by Application
- 8.2.1. Chemicals
- 8.2.2. Drug
- 8.2.3. Biological Specimens
- 8.2.4. Industrial Gases
- 8.2.5. Other Applications
- 8.1. Market Analysis, Insights and Forecast - by Type
- 9. Asia Pacific Global Cryogenic Transportation Services Market Analysis, Insights and Forecast, 2020-2032
- 9.1. Market Analysis, Insights and Forecast - by Type
- 9.1.1. Trailer Transportation
- 9.1.2. Truck Transportation
- 9.2. Market Analysis, Insights and Forecast - by Application
- 9.2.1. Chemicals
- 9.2.2. Drug
- 9.2.3. Biological Specimens
- 9.2.4. Industrial Gases
- 9.2.5. Other Applications
- 9.1. Market Analysis, Insights and Forecast - by Type
- 10. Middle East and Africa Global Cryogenic Transportation Services Market Analysis, Insights and Forecast, 2020-2032
- 10.1. Market Analysis, Insights and Forecast - by Type
- 10.1.1. Trailer Transportation
- 10.1.2. Truck Transportation
- 10.2. Market Analysis, Insights and Forecast - by Application
- 10.2.1. Chemicals
- 10.2.2. Drug
- 10.2.3. Biological Specimens
- 10.2.4. Industrial Gases
- 10.2.5. Other Applications
- 10.1. Market Analysis, Insights and Forecast - by Type
- 11. Latin America Global Cryogenic Transportation Services Market Analysis, Insights and Forecast, 2020-2032
- 11.1. Market Analysis, Insights and Forecast - by Type
- 11.1.1. Trailer Transportation
- 11.1.2. Truck Transportation
- 11.2. Market Analysis, Insights and Forecast - by Application
- 11.2.1. Chemicals
- 11.2.2. Drug
- 11.2.3. Biological Specimens
- 11.2.4. Industrial Gases
- 11.2.5. Other Applications
- 11.1. Market Analysis, Insights and Forecast - by Type
- 12. Competitive Analysis
- 12.1. Company Profiles
- 12.1.1 Core Cryolab
- 12.1.1.1. Company Overview
- 12.1.1.2. Products
- 12.1.1.3. Company Financials
- 12.1.1.4. SWOT Analysis
- 12.1.2 New England Cryogenic Center
- 12.1.2.1. Company Overview
- 12.1.2.2. Products
- 12.1.2.3. Company Financials
- 12.1.2.4. SWOT Analysis
- 12.1.3 COREX Logistics
- 12.1.3.1. Company Overview
- 12.1.3.2. Products
- 12.1.3.3. Company Financials
- 12.1.3.4. SWOT Analysis
- 12.1.4 GetCryo
- 12.1.4.1. Company Overview
- 12.1.4.2. Products
- 12.1.4.3. Company Financials
- 12.1.4.4. SWOT Analysis
- 12.1.5 LGT Transport
- 12.1.5.1. Company Overview
- 12.1.5.2. Products
- 12.1.5.3. Company Financials
- 12.1.5.4. SWOT Analysis
- 12.1.6 Applied Cryo Technologies
- 12.1.6.1. Company Overview
- 12.1.6.2. Products
- 12.1.6.3. Company Financials
- 12.1.6.4. SWOT Analysis
- 12.1.7 US Cryo Carriers
- 12.1.7.1. Company Overview
- 12.1.7.2. Products
- 12.1.7.3. Company Financials
- 12.1.7.4. SWOT Analysis
- 12.1.8 McCollister's
- 12.1.8.1. Company Overview
- 12.1.8.2. Products
- 12.1.8.3. Company Financials
- 12.1.8.4. SWOT Analysis
- 12.1.9 Legacy Cryogenic
- 12.1.9.1. Company Overview
- 12.1.9.2. Products
- 12.1.9.3. Company Financials
- 12.1.9.4. SWOT Analysis
- 12.1.10 KAG
- 12.1.10.1. Company Overview
- 12.1.10.2. Products
- 12.1.10.3. Company Financials
- 12.1.10.4. SWOT Analysis
- 12.1.11 Texas Gas Transport*7 3 Other Companie
- 12.1.11.1. Company Overview
- 12.1.11.2. Products
- 12.1.11.3. Company Financials
- 12.1.11.4. SWOT Analysis
- 12.1.12 Hingham Moving
- 12.1.12.1. Company Overview
- 12.1.12.2. Products
- 12.1.12.3. Company Financials
- 12.1.12.4. SWOT Analysis
- 12.1.13 Champion Moving
- 12.1.13.1. Company Overview
- 12.1.13.2. Products
- 12.1.13.3. Company Financials
- 12.1.13.4. SWOT Analysis
- 12.1.1 Core Cryolab
- 12.2. Market Entropy
- 12.2.1 Company's Key Areas Served
- 12.2.2 Recent Developments
- 12.3. Company Market Share Analysis 2025
- 12.3.1 Top 5 Companies Market Share Analysis
- 12.3.2 Top 3 Companies Market Share Analysis
- 12.4. List of Potential Customers
- 13. Research Methodology
List of Figures
- Figure 1: Global Global Cryogenic Transportation Services Market Revenue Breakdown (Million, %) by Region 2025 & 2033
- Figure 2: North America Global Cryogenic Transportation Services Market Revenue (Million), by Type 2025 & 2033
- Figure 3: North America Global Cryogenic Transportation Services Market Revenue Share (%), by Type 2025 & 2033
- Figure 4: North America Global Cryogenic Transportation Services Market Revenue (Million), by Application 2025 & 2033
- Figure 5: North America Global Cryogenic Transportation Services Market Revenue Share (%), by Application 2025 & 2033
- Figure 6: North America Global Cryogenic Transportation Services Market Revenue (Million), by Country 2025 & 2033
- Figure 7: North America Global Cryogenic Transportation Services Market Revenue Share (%), by Country 2025 & 2033
- Figure 8: Europe Global Cryogenic Transportation Services Market Revenue (Million), by Type 2025 & 2033
- Figure 9: Europe Global Cryogenic Transportation Services Market Revenue Share (%), by Type 2025 & 2033
- Figure 10: Europe Global Cryogenic Transportation Services Market Revenue (Million), by Application 2025 & 2033
- Figure 11: Europe Global Cryogenic Transportation Services Market Revenue Share (%), by Application 2025 & 2033
- Figure 12: Europe Global Cryogenic Transportation Services Market Revenue (Million), by Country 2025 & 2033
- Figure 13: Europe Global Cryogenic Transportation Services Market Revenue Share (%), by Country 2025 & 2033
- Figure 14: Asia Pacific Global Cryogenic Transportation Services Market Revenue (Million), by Type 2025 & 2033
- Figure 15: Asia Pacific Global Cryogenic Transportation Services Market Revenue Share (%), by Type 2025 & 2033
- Figure 16: Asia Pacific Global Cryogenic Transportation Services Market Revenue (Million), by Application 2025 & 2033
- Figure 17: Asia Pacific Global Cryogenic Transportation Services Market Revenue Share (%), by Application 2025 & 2033
- Figure 18: Asia Pacific Global Cryogenic Transportation Services Market Revenue (Million), by Country 2025 & 2033
- Figure 19: Asia Pacific Global Cryogenic Transportation Services Market Revenue Share (%), by Country 2025 & 2033
- Figure 20: Middle East and Africa Global Cryogenic Transportation Services Market Revenue (Million), by Type 2025 & 2033
- Figure 21: Middle East and Africa Global Cryogenic Transportation Services Market Revenue Share (%), by Type 2025 & 2033
- Figure 22: Middle East and Africa Global Cryogenic Transportation Services Market Revenue (Million), by Application 2025 & 2033
- Figure 23: Middle East and Africa Global Cryogenic Transportation Services Market Revenue Share (%), by Application 2025 & 2033
- Figure 24: Middle East and Africa Global Cryogenic Transportation Services Market Revenue (Million), by Country 2025 & 2033
- Figure 25: Middle East and Africa Global Cryogenic Transportation Services Market Revenue Share (%), by Country 2025 & 2033
- Figure 26: Latin America Global Cryogenic Transportation Services Market Revenue (Million), by Type 2025 & 2033
- Figure 27: Latin America Global Cryogenic Transportation Services Market Revenue Share (%), by Type 2025 & 2033
- Figure 28: Latin America Global Cryogenic Transportation Services Market Revenue (Million), by Application 2025 & 2033
- Figure 29: Latin America Global Cryogenic Transportation Services Market Revenue Share (%), by Application 2025 & 2033
- Figure 30: Latin America Global Cryogenic Transportation Services Market Revenue (Million), by Country 2025 & 2033
- Figure 31: Latin America Global Cryogenic Transportation Services Market Revenue Share (%), by Country 2025 & 2033
List of Tables
- Table 1: Global Cryogenic Transportation Services Market Revenue Million Forecast, by Type 2020 & 2033
- Table 2: Global Cryogenic Transportation Services Market Revenue Million Forecast, by Application 2020 & 2033
- Table 3: Global Cryogenic Transportation Services Market Revenue Million Forecast, by Region 2020 & 2033
- Table 4: Global Cryogenic Transportation Services Market Revenue Million Forecast, by Type 2020 & 2033
- Table 5: Global Cryogenic Transportation Services Market Revenue Million Forecast, by Application 2020 & 2033
- Table 6: Global Cryogenic Transportation Services Market Revenue Million Forecast, by Country 2020 & 2033
- Table 7: United States Global Cryogenic Transportation Services Market Revenue (Million) Forecast, by Application 2020 & 2033
- Table 8: Canada Global Cryogenic Transportation Services Market Revenue (Million) Forecast, by Application 2020 & 2033
- Table 9: Mexico Global Cryogenic Transportation Services Market Revenue (Million) Forecast, by Application 2020 & 2033
- Table 10: Global Cryogenic Transportation Services Market Revenue Million Forecast, by Type 2020 & 2033
- Table 11: Global Cryogenic Transportation Services Market Revenue Million Forecast, by Application 2020 & 2033
- Table 12: Global Cryogenic Transportation Services Market Revenue Million Forecast, by Country 2020 & 2033
- Table 13: Germany Global Cryogenic Transportation Services Market Revenue (Million) Forecast, by Application 2020 & 2033
- Table 14: France Global Cryogenic Transportation Services Market Revenue (Million) Forecast, by Application 2020 & 2033
- Table 15: Italy Global Cryogenic Transportation Services Market Revenue (Million) Forecast, by Application 2020 & 2033
- Table 16: United Kingdom Global Cryogenic Transportation Services Market Revenue (Million) Forecast, by Application 2020 & 2033
- Table 17: Spain Global Cryogenic Transportation Services Market Revenue (Million) Forecast, by Application 2020 & 2033
- Table 18: Rest of Europe Global Cryogenic Transportation Services Market Revenue (Million) Forecast, by Application 2020 & 2033
- Table 19: Global Cryogenic Transportation Services Market Revenue Million Forecast, by Type 2020 & 2033
- Table 20: Global Cryogenic Transportation Services Market Revenue Million Forecast, by Application 2020 & 2033
- Table 21: Global Cryogenic Transportation Services Market Revenue Million Forecast, by Country 2020 & 2033
- Table 22: China Global Cryogenic Transportation Services Market Revenue (Million) Forecast, by Application 2020 & 2033
- Table 23: India Global Cryogenic Transportation Services Market Revenue (Million) Forecast, by Application 2020 & 2033
- Table 24: Japan Global Cryogenic Transportation Services Market Revenue (Million) Forecast, by Application 2020 & 2033
- Table 25: Australia Global Cryogenic Transportation Services Market Revenue (Million) Forecast, by Application 2020 & 2033
- Table 26: Singapore Global Cryogenic Transportation Services Market Revenue (Million) Forecast, by Application 2020 & 2033
- Table 27: Indonesia Global Cryogenic Transportation Services Market Revenue (Million) Forecast, by Application 2020 & 2033
- Table 28: South Korea Global Cryogenic Transportation Services Market Revenue (Million) Forecast, by Application 2020 & 2033
- Table 29: Malaysia Global Cryogenic Transportation Services Market Revenue (Million) Forecast, by Application 2020 & 2033
- Table 30: Rest of Asia Pacific Global Cryogenic Transportation Services Market Revenue (Million) Forecast, by Application 2020 & 2033
- Table 31: Global Cryogenic Transportation Services Market Revenue Million Forecast, by Type 2020 & 2033
- Table 32: Global Cryogenic Transportation Services Market Revenue Million Forecast, by Application 2020 & 2033
- Table 33: Global Cryogenic Transportation Services Market Revenue Million Forecast, by Country 2020 & 2033
- Table 34: Saudi Arabia Global Cryogenic Transportation Services Market Revenue (Million) Forecast, by Application 2020 & 2033
- Table 35: Qatar Global Cryogenic Transportation Services Market Revenue (Million) Forecast, by Application 2020 & 2033
- Table 36: Oman Global Cryogenic Transportation Services Market Revenue (Million) Forecast, by Application 2020 & 2033
- Table 37: Rest of Middle East and Africa Global Cryogenic Transportation Services Market Revenue (Million) Forecast, by Application 2020 & 2033
- Table 38: Global Cryogenic Transportation Services Market Revenue Million Forecast, by Type 2020 & 2033
- Table 39: Global Cryogenic Transportation Services Market Revenue Million Forecast, by Application 2020 & 2033
- Table 40: Global Cryogenic Transportation Services Market Revenue Million Forecast, by Country 2020 & 2033
- Table 41: Brazil Global Cryogenic Transportation Services Market Revenue (Million) Forecast, by Application 2020 & 2033
- Table 42: Argentina Global Cryogenic Transportation Services Market Revenue (Million) Forecast, by Application 2020 & 2033
- Table 43: Chile Global Cryogenic Transportation Services Market Revenue (Million) Forecast, by Application 2020 & 2033
- Table 44: Rest of Latin America Global Cryogenic Transportation Services Market Revenue (Million) Forecast, by Application 2020 & 2033
Frequently Asked Questions
1. What is the projected Compound Annual Growth Rate (CAGR) of the Global Cryogenic Transportation Services Market?
The projected CAGR is approximately 6.75%.
2. Which companies are prominent players in the Global Cryogenic Transportation Services Market?
Key companies in the market include Core Cryolab, New England Cryogenic Center, COREX Logistics, GetCryo, LGT Transport, Applied Cryo Technologies, US Cryo Carriers, McCollister's, Legacy Cryogenic, KAG, Texas Gas Transport*7 3 Other Companie, Hingham Moving, Champion Moving.
3. What are the main segments of the Global Cryogenic Transportation Services Market?
The market segments include Type, Application.
4. Can you provide details about the market size?
The market size is estimated to be USD 10.52 Million as of 2022.
5. What are some drivers contributing to market growth?
Growth of Life Sciences and Healthcare; Expanding Food and Beverage Industry; Growing Focus on Renewable Energy.
6. What are the notable trends driving market growth?
North America Dominates the Global Market Share in the Coming Years.
7. Are there any restraints impacting market growth?
High Initial Investment Costs; Skilled Workforce Shortage; Infrastructure.
8. Can you provide examples of recent developments in the market?
October 2023: COREX Logistics has officially become a member of the Irish Pharmaceutical Health Association, joining industry giants such as Bayer, GlaxoSmithKline, and Eli Lilly in representing the international research-based pharmaceutical industry in Ireland. The members take an active part in strategy development and implementation, helping to shape policy and public debate across areas such as regulation, access, pricing, and health promotion.
9. What pricing options are available for accessing the report?
Pricing options include single-user, multi-user, and enterprise licenses priced at USD 4750, USD 5250, and USD 8750 respectively.
10. Is the market size provided in terms of value or volume?
The market size is provided in terms of value, measured in Million.
11. Are there any specific market keywords associated with the report?
Yes, the market keyword associated with the report is "Global Cryogenic Transportation Services Market," which aids in identifying and referencing the specific market segment covered.
12. How do I determine which pricing option suits my needs best?
The pricing options vary based on user requirements and access needs. Individual users may opt for single-user licenses, while businesses requiring broader access may choose multi-user or enterprise licenses for cost-effective access to the report.
13. Are there any additional resources or data provided in the Global Cryogenic Transportation Services Market report?
While the report offers comprehensive insights, it's advisable to review the specific contents or supplementary materials provided to ascertain if additional resources or data are available.
14. How can I stay updated on further developments or reports in the Global Cryogenic Transportation Services Market?
To stay informed about further developments, trends, and reports in the Global Cryogenic Transportation Services Market, consider subscribing to industry newsletters, following relevant companies and organizations, or regularly checking reputable industry news sources and publications.
Methodology
Step 1 - Identification of Relevant Samples Size from Population Database


Step 2 - Approaches for Defining Global Market Size (Value, Volume* & Price*)

Note*: In applicable scenarios
Step 3 - Data Sources
Primary Research
- Web Analytics
- Survey Reports
- Research Institute
- Latest Research Reports
- Opinion Leaders
Secondary Research
- Annual Reports
- White Paper
- Latest Press Release
- Industry Association
- Paid Database
- Investor Presentations

Step 4 - Data Triangulation
Involves using different sources of information in order to increase the validity of a study
These sources are likely to be stakeholders in a program - participants, other researchers, program staff, other community members, and so on.
Then we put all data in single framework & apply various statistical tools to find out the dynamic on the market.
During the analysis stage, feedback from the stakeholder groups would be compared to determine areas of agreement as well as areas of divergence