

Key Insights
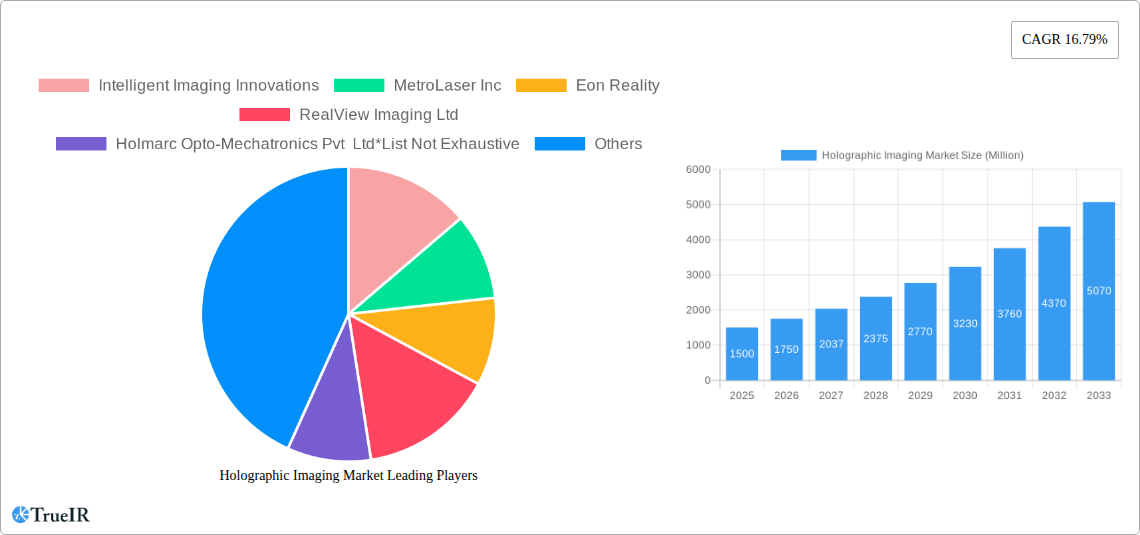
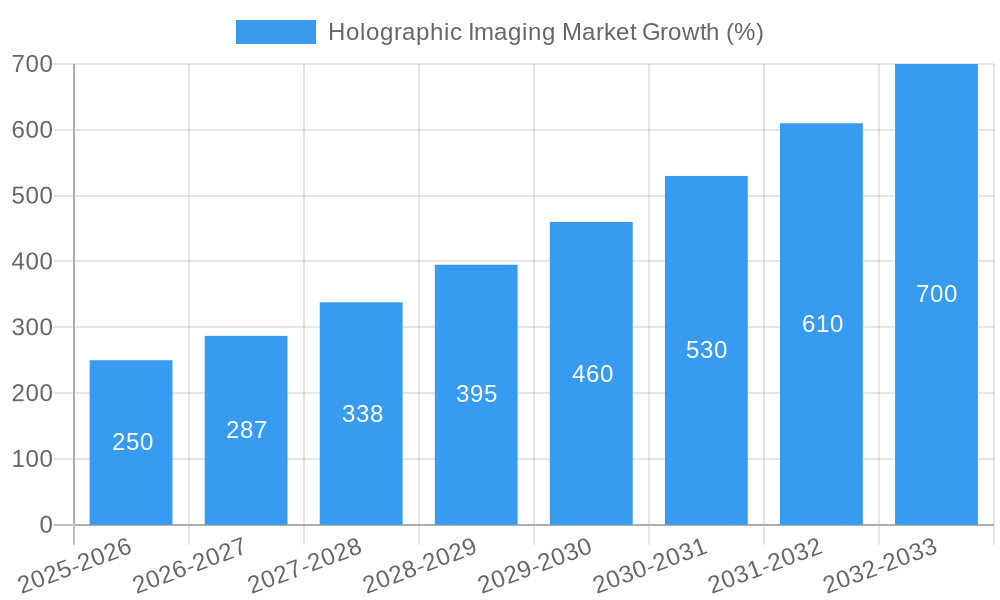
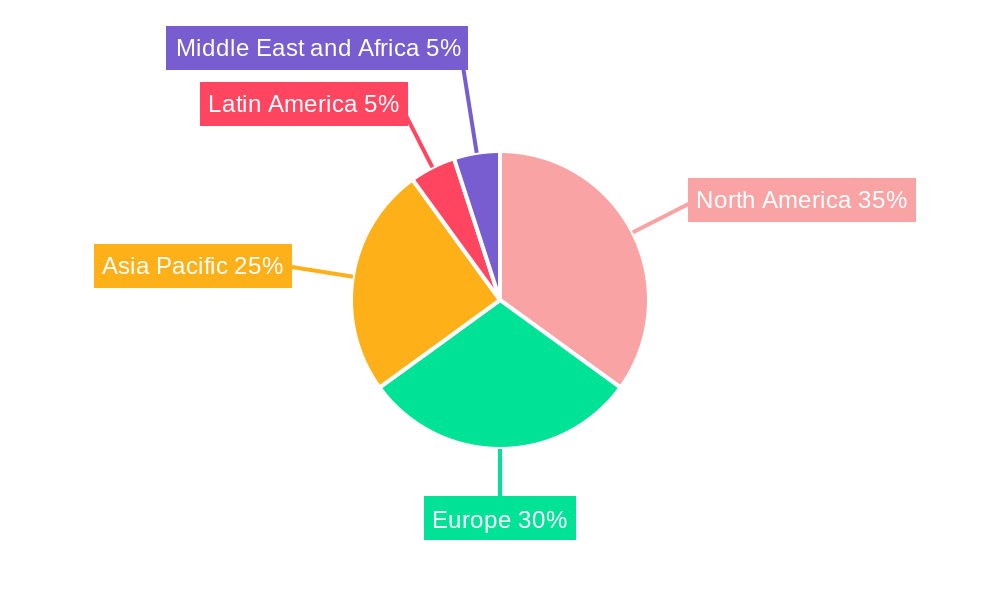
The holographic imaging market is experiencing robust growth, projected to reach a substantial size by 2033. A compound annual growth rate (CAGR) of 16.79% from 2025 to 2033 indicates significant market expansion driven by several key factors. Advancements in laser technology, CCD cameras, and beam splitters are enhancing the quality and affordability of holographic imaging systems. Furthermore, increasing applications across diverse sectors such as medical imaging (for improved diagnostics and minimally invasive surgeries), aerospace and defense (for advanced simulation and training), and commercial sectors (for innovative advertising and entertainment) are fueling market expansion. The rising adoption of digital holographic microscopy and displays in research and development is also a significant growth driver. While challenges remain, such as the high initial investment costs associated with holographic equipment and the need for specialized expertise, the market's overall trajectory remains positive. The integration of holographic technology into augmented and virtual reality applications is further expected to boost market growth significantly in the coming years. The software segment is also anticipated to experience rapid growth due to rising demand for user-friendly software that simplifies image processing and analysis. Geographically, North America and Europe currently dominate the market, but the Asia-Pacific region is projected to witness the fastest growth rate due to increasing investments in research and development and the growing adoption of advanced technologies.
The market segmentation reveals diverse applications. Digital holographic displays are leading the way in entertainment and advertising, leveraging their immersive capabilities. In healthcare, digital holographic microscopy offers precise diagnostic tools, contributing to improved patient care. The aerospace and defense industries utilize holographic imaging for training simulations, enhancing pilot readiness and operational efficiency. Automation sectors utilize this technology for precision control and quality assessment. The competitive landscape includes a range of established companies and innovative startups, continuously developing cutting-edge holographic imaging solutions. Continuous innovation in hardware and software, coupled with expanding applications, positions the holographic imaging market for sustained and substantial growth throughout the forecast period. Government initiatives promoting technological advancements also contribute to the market's overall positive outlook.
Holographic Imaging Market: A Comprehensive Report (2019-2033)
This dynamic report provides an in-depth analysis of the Holographic Imaging Market, projecting robust growth from 2025 to 2033. Leveraging extensive market research and data analysis, this comprehensive study covers market size, segmentation, competitive landscape, technological advancements, and key growth drivers. The report is crucial for businesses, investors, and researchers seeking a comprehensive understanding of this rapidly evolving market poised for significant expansion. The report is based on a study period of 2019-2033, with 2025 as the base and estimated year, and a forecast period of 2025-2033. The historical period analyzed is 2019-2024.
Holographic Imaging Market Market Structure & Competitive Landscape
The Holographic Imaging market exhibits a moderately fragmented structure, with several key players and a growing number of smaller, specialized companies. The market concentration ratio (CR4) is estimated at xx% in 2025, indicating a competitive landscape. Innovation plays a pivotal role, with companies continuously developing advanced hardware and software solutions to improve image quality, resolution, and processing speed. Regulatory factors, particularly concerning safety and data privacy in medical and defense applications, influence market development. Product substitutes, such as advanced 3D printing and augmented reality technologies, present competitive pressure. The market is segmented by end-user verticals (Medical, Aerospace & Defense, Commercial, Education, Automation, Other), offering (Hardware – Beam Splitter, CCD Camera, Laser, and Others; Software), and application (Digital Holographic Displays, Digital Holographic Microscopy, Holographic Telepresence). Mergers and acquisitions (M&A) activity has been moderate, with xx M&A deals recorded in the past five years, primarily focused on consolidating technological capabilities and expanding market reach.
- Market Concentration: CR4 estimated at xx% in 2025.
- Innovation Drivers: Continuous improvement in hardware and software technology.
- Regulatory Impacts: Stringent regulations in healthcare and defense sectors.
- Product Substitutes: Advanced 3D printing and augmented reality technologies.
- End-User Segmentation: Diverse applications across various sectors.
- M&A Trends: Moderate activity, driven by technological consolidation and market expansion.
Holographic Imaging Market Market Trends & Opportunities
The Holographic Imaging market is experiencing significant growth, driven by technological advancements, increasing demand across diverse sectors, and the rising adoption of holographic technologies. The market size is projected to reach xx Million by 2033, exhibiting a CAGR of xx% during the forecast period (2025-2033). This growth is fueled by several key trends: the increasing integration of holographic imaging in medical diagnostics, the growing demand for advanced visualization tools in aerospace and defense, the expanding commercial applications in entertainment and advertising, and the rising adoption of holographic displays in education and training. The market penetration rate for holographic imaging in the medical sector is projected to increase from xx% in 2025 to xx% by 2033. Competitive dynamics are characterized by ongoing innovation, strategic partnerships, and increasing investments in research and development.
Dominant Markets & Segments in Holographic Imaging Market
The Medical end-user vertical represents the largest segment of the Holographic Imaging market, driven by the increasing adoption of holographic microscopy for advanced diagnostic imaging. North America currently holds the largest market share, followed by Europe and Asia-Pacific. The Hardware segment (especially lasers and CCD cameras) dominates the market in terms of revenue generation. Digital Holographic Microscopy is the most widely adopted application, owing to its effectiveness in medical imaging and scientific research.
- Key Growth Drivers in Medical Segment:
- Improved diagnostic capabilities.
- Minimally invasive procedures.
- Increased adoption of advanced imaging techniques.
- Key Growth Drivers in North America:
- Strong technological infrastructure.
- Significant investments in R&D.
- Early adoption of advanced technologies.
- Dominant Offering: Hardware (Lasers and CCD cameras)
- Dominant Application: Digital Holographic Microscopy
Holographic Imaging Market Product Analysis
Recent advancements in holographic imaging technology have resulted in the development of compact, high-resolution systems with improved image quality and faster processing speeds. These advancements have broadened the applications of holographic imaging, leading to increased market adoption across various sectors. Key innovations include improved laser sources, higher-resolution CCD cameras, and advanced image processing algorithms that enhance image clarity and reduce artifacts. The market is witnessing the emergence of more user-friendly and cost-effective systems, making holographic imaging technology more accessible to a wider range of users.
Key Drivers, Barriers & Challenges in Holographic Imaging Market
Key Drivers: Technological advancements driving higher resolution, improved image quality, and reduced costs. Increased demand in healthcare, defense, and commercial sectors. Government funding and research initiatives.
Key Challenges: High initial investment costs for advanced systems. Limited skilled workforce for system operation and maintenance. Complex integration with existing systems in certain applications. The need for robust standardization and regulatory frameworks. Supply chain disruptions can impact the availability of key components like lasers, affecting the production and delivery timelines of the final products. This is estimated to reduce the market size by xx Million in the next two years.
Growth Drivers in the Holographic Imaging Market Market
The key drivers include technological advancements leading to better image resolution and processing speed, increasing demand across various sectors (medical, aerospace, commercial), government funding, and growing research initiatives. Cost reduction in hardware and software components also contributes significantly.
Challenges Impacting Holographic Imaging Market Growth
High initial investment costs, limited skilled workforce, integration complexities with existing systems, and the absence of robust standardization and regulatory frameworks impede market growth. Supply chain disruptions also negatively impact production and timelines.
Key Players Shaping the Holographic Imaging Market Market
- Intelligent Imaging Innovations
- MetroLaser Inc
- Eon Reality
- RealView Imaging Ltd
- Holmarc Opto-Mechatronics Pvt Ltd
- Mit Media Lab
- Lyncee TEC SA
- Jasper Display Corporation
- Leia Inc
- Geola Digital Uab
- Phase Holographic Imaging AB
- Light Logics Holography and Optics
Significant Holographic Imaging Market Industry Milestones
- 2022-Q3: Leia Inc. launched a new holographic display technology.
- 2021-Q4: A major partnership was formed between Intelligent Imaging Innovations and a leading medical device manufacturer.
- 2020-Q1: Significant investment in R&D by several key players in the market.
- (Specific dates for other milestones may require further investigation)
Future Outlook for Holographic Imaging Market Market
The Holographic Imaging market is poised for continued robust growth, driven by ongoing technological advancements, expanding applications, and increased investments in R&D. Strategic partnerships and M&A activity will likely further consolidate the market. New applications in fields such as augmented reality and virtual reality will create additional opportunities. Addressing existing challenges relating to cost, workforce availability, and standardization will be crucial for maximizing market potential.
Holographic Imaging Market Segmentation
-
1. Offering
- 1.1. Hardware
- 1.2. Software
-
2. Application
- 2.1. Digital Holographic Displays
- 2.2. Digital Holographic Microscopy
- 2.3. Holographic Telepresence
-
3. End-user Vertical
- 3.1. Medical
- 3.2. Aerospace and Defense
- 3.3. Commercial
- 3.4. Education
- 3.5. Automation
- 3.6. Other End-user Verticals
Holographic Imaging Market Segmentation By Geography
-
1. North America
- 1.1. United States
- 1.2. Canada
-
2. Europe
- 2.1. Germany
- 2.2. United Kingdom
- 2.3. France
- 2.4. Rest of Europe
-
3. Asia Pacific
- 3.1. India
- 3.2. China
- 3.3. Japan
- 3.4. Rest of Asia Pacific
-
4. Latin America
- 4.1. Brazil
- 4.2. Argentina
- 4.3. Rest of Latin America
-
5. Middle East and Africa
- 5.1. United Arab Emirates
- 5.2. Saudi Arabia
- 5.3. Rest of Middle East and Africa
Holographic Imaging Market REPORT HIGHLIGHTS
| Aspects | Details |
|---|---|
| Study Period | 2019-2033 |
| Base Year | 2024 |
| Estimated Year | 2025 |
| Forecast Period | 2025-2033 |
| Historical Period | 2019-2024 |
| Growth Rate | CAGR of 16.79% from 2019-2033 |
| Segmentation |
|
Table of Contents
- 1. Introduction
- 1.1. Research Scope
- 1.2. Market Segmentation
- 1.3. Research Methodology
- 1.4. Definitions and Assumptions
- 2. Executive Summary
- 2.1. Introduction
- 3. Market Dynamics
- 3.1. Introduction
- 3.2. Market Drivers
- 3.2.1. Increased Demand for GPS Technology in Military Applications; Improving Overall GPRS Infrastructure; Rising Demand for Unmanned Airborne Vehicles and Systems
- 3.3. Market Restrains
- 3.3.1. Complexity in Manufacturing; Interoperability with Existing Systems
- 3.4. Market Trends
- 3.4.1. Digital Holographic Displays to Hold the Significant Market Share
- 4. Market Factor Analysis
- 4.1. Porters Five Forces
- 4.2. Supply/Value Chain
- 4.3. PESTEL analysis
- 4.4. Market Entropy
- 4.5. Patent/Trademark Analysis
- 5. Global Holographic Imaging Market Analysis, Insights and Forecast, 2019-2031
- 5.1. Market Analysis, Insights and Forecast - by Offering
- 5.1.1. Hardware
- 5.1.2. Software
- 5.2. Market Analysis, Insights and Forecast - by Application
- 5.2.1. Digital Holographic Displays
- 5.2.2. Digital Holographic Microscopy
- 5.2.3. Holographic Telepresence
- 5.3. Market Analysis, Insights and Forecast - by End-user Vertical
- 5.3.1. Medical
- 5.3.2. Aerospace and Defense
- 5.3.3. Commercial
- 5.3.4. Education
- 5.3.5. Automation
- 5.3.6. Other End-user Verticals
- 5.4. Market Analysis, Insights and Forecast - by Region
- 5.4.1. North America
- 5.4.2. Europe
- 5.4.3. Asia Pacific
- 5.4.4. Latin America
- 5.4.5. Middle East and Africa
- 5.1. Market Analysis, Insights and Forecast - by Offering
- 6. North America Holographic Imaging Market Analysis, Insights and Forecast, 2019-2031
- 6.1. Market Analysis, Insights and Forecast - by Offering
- 6.1.1. Hardware
- 6.1.2. Software
- 6.2. Market Analysis, Insights and Forecast - by Application
- 6.2.1. Digital Holographic Displays
- 6.2.2. Digital Holographic Microscopy
- 6.2.3. Holographic Telepresence
- 6.3. Market Analysis, Insights and Forecast - by End-user Vertical
- 6.3.1. Medical
- 6.3.2. Aerospace and Defense
- 6.3.3. Commercial
- 6.3.4. Education
- 6.3.5. Automation
- 6.3.6. Other End-user Verticals
- 6.1. Market Analysis, Insights and Forecast - by Offering
- 7. Europe Holographic Imaging Market Analysis, Insights and Forecast, 2019-2031
- 7.1. Market Analysis, Insights and Forecast - by Offering
- 7.1.1. Hardware
- 7.1.2. Software
- 7.2. Market Analysis, Insights and Forecast - by Application
- 7.2.1. Digital Holographic Displays
- 7.2.2. Digital Holographic Microscopy
- 7.2.3. Holographic Telepresence
- 7.3. Market Analysis, Insights and Forecast - by End-user Vertical
- 7.3.1. Medical
- 7.3.2. Aerospace and Defense
- 7.3.3. Commercial
- 7.3.4. Education
- 7.3.5. Automation
- 7.3.6. Other End-user Verticals
- 7.1. Market Analysis, Insights and Forecast - by Offering
- 8. Asia Pacific Holographic Imaging Market Analysis, Insights and Forecast, 2019-2031
- 8.1. Market Analysis, Insights and Forecast - by Offering
- 8.1.1. Hardware
- 8.1.2. Software
- 8.2. Market Analysis, Insights and Forecast - by Application
- 8.2.1. Digital Holographic Displays
- 8.2.2. Digital Holographic Microscopy
- 8.2.3. Holographic Telepresence
- 8.3. Market Analysis, Insights and Forecast - by End-user Vertical
- 8.3.1. Medical
- 8.3.2. Aerospace and Defense
- 8.3.3. Commercial
- 8.3.4. Education
- 8.3.5. Automation
- 8.3.6. Other End-user Verticals
- 8.1. Market Analysis, Insights and Forecast - by Offering
- 9. Latin America Holographic Imaging Market Analysis, Insights and Forecast, 2019-2031
- 9.1. Market Analysis, Insights and Forecast - by Offering
- 9.1.1. Hardware
- 9.1.2. Software
- 9.2. Market Analysis, Insights and Forecast - by Application
- 9.2.1. Digital Holographic Displays
- 9.2.2. Digital Holographic Microscopy
- 9.2.3. Holographic Telepresence
- 9.3. Market Analysis, Insights and Forecast - by End-user Vertical
- 9.3.1. Medical
- 9.3.2. Aerospace and Defense
- 9.3.3. Commercial
- 9.3.4. Education
- 9.3.5. Automation
- 9.3.6. Other End-user Verticals
- 9.1. Market Analysis, Insights and Forecast - by Offering
- 10. Middle East and Africa Holographic Imaging Market Analysis, Insights and Forecast, 2019-2031
- 10.1. Market Analysis, Insights and Forecast - by Offering
- 10.1.1. Hardware
- 10.1.2. Software
- 10.2. Market Analysis, Insights and Forecast - by Application
- 10.2.1. Digital Holographic Displays
- 10.2.2. Digital Holographic Microscopy
- 10.2.3. Holographic Telepresence
- 10.3. Market Analysis, Insights and Forecast - by End-user Vertical
- 10.3.1. Medical
- 10.3.2. Aerospace and Defense
- 10.3.3. Commercial
- 10.3.4. Education
- 10.3.5. Automation
- 10.3.6. Other End-user Verticals
- 10.1. Market Analysis, Insights and Forecast - by Offering
- 11. North America Holographic Imaging Market Analysis, Insights and Forecast, 2019-2031
- 11.1. Market Analysis, Insights and Forecast - By Country/Sub-region
- 11.1.1 United States
- 11.1.2 Canada
- 12. Europe Holographic Imaging Market Analysis, Insights and Forecast, 2019-2031
- 12.1. Market Analysis, Insights and Forecast - By Country/Sub-region
- 12.1.1 Germany
- 12.1.2 United Kingdom
- 12.1.3 France
- 12.1.4 Rest of Europe
- 13. Asia Pacific Holographic Imaging Market Analysis, Insights and Forecast, 2019-2031
- 13.1. Market Analysis, Insights and Forecast - By Country/Sub-region
- 13.1.1 India
- 13.1.2 China
- 13.1.3 Japan
- 13.1.4 Rest of Asia Pacific
- 14. Latin America Holographic Imaging Market Analysis, Insights and Forecast, 2019-2031
- 14.1. Market Analysis, Insights and Forecast - By Country/Sub-region
- 14.1.1 Brazil
- 14.1.2 Argentina
- 14.1.3 Rest of Latin America
- 15. Middle East and Africa Holographic Imaging Market Analysis, Insights and Forecast, 2019-2031
- 15.1. Market Analysis, Insights and Forecast - By Country/Sub-region
- 15.1.1 United Arab Emirates
- 15.1.2 Saudi Arabia
- 15.1.3 Rest of Middle East and Africa
- 16. Competitive Analysis
- 16.1. Global Market Share Analysis 2024
- 16.2. Company Profiles
- 16.2.1 Intelligent Imaging Innovations
- 16.2.1.1. Overview
- 16.2.1.2. Products
- 16.2.1.3. SWOT Analysis
- 16.2.1.4. Recent Developments
- 16.2.1.5. Financials (Based on Availability)
- 16.2.2 MetroLaser Inc
- 16.2.2.1. Overview
- 16.2.2.2. Products
- 16.2.2.3. SWOT Analysis
- 16.2.2.4. Recent Developments
- 16.2.2.5. Financials (Based on Availability)
- 16.2.3 Eon Reality
- 16.2.3.1. Overview
- 16.2.3.2. Products
- 16.2.3.3. SWOT Analysis
- 16.2.3.4. Recent Developments
- 16.2.3.5. Financials (Based on Availability)
- 16.2.4 RealView Imaging Ltd
- 16.2.4.1. Overview
- 16.2.4.2. Products
- 16.2.4.3. SWOT Analysis
- 16.2.4.4. Recent Developments
- 16.2.4.5. Financials (Based on Availability)
- 16.2.5 Holmarc Opto-Mechatronics Pvt Ltd*List Not Exhaustive
- 16.2.5.1. Overview
- 16.2.5.2. Products
- 16.2.5.3. SWOT Analysis
- 16.2.5.4. Recent Developments
- 16.2.5.5. Financials (Based on Availability)
- 16.2.6 Mit Media Lab
- 16.2.6.1. Overview
- 16.2.6.2. Products
- 16.2.6.3. SWOT Analysis
- 16.2.6.4. Recent Developments
- 16.2.6.5. Financials (Based on Availability)
- 16.2.7 Lyncee TEC SA
- 16.2.7.1. Overview
- 16.2.7.2. Products
- 16.2.7.3. SWOT Analysis
- 16.2.7.4. Recent Developments
- 16.2.7.5. Financials (Based on Availability)
- 16.2.8 Jasper Display Corporation
- 16.2.8.1. Overview
- 16.2.8.2. Products
- 16.2.8.3. SWOT Analysis
- 16.2.8.4. Recent Developments
- 16.2.8.5. Financials (Based on Availability)
- 16.2.9 Leia Inc
- 16.2.9.1. Overview
- 16.2.9.2. Products
- 16.2.9.3. SWOT Analysis
- 16.2.9.4. Recent Developments
- 16.2.9.5. Financials (Based on Availability)
- 16.2.10 Geola Digital Uab
- 16.2.10.1. Overview
- 16.2.10.2. Products
- 16.2.10.3. SWOT Analysis
- 16.2.10.4. Recent Developments
- 16.2.10.5. Financials (Based on Availability)
- 16.2.11 Phase Holographic Imaging AB
- 16.2.11.1. Overview
- 16.2.11.2. Products
- 16.2.11.3. SWOT Analysis
- 16.2.11.4. Recent Developments
- 16.2.11.5. Financials (Based on Availability)
- 16.2.12 Light Logics Holography and Optics
- 16.2.12.1. Overview
- 16.2.12.2. Products
- 16.2.12.3. SWOT Analysis
- 16.2.12.4. Recent Developments
- 16.2.12.5. Financials (Based on Availability)
- 16.2.1 Intelligent Imaging Innovations
List of Figures
- Figure 1: Global Holographic Imaging Market Revenue Breakdown (Million, %) by Region 2024 & 2032
- Figure 2: North America Holographic Imaging Market Revenue (Million), by Country 2024 & 2032
- Figure 3: North America Holographic Imaging Market Revenue Share (%), by Country 2024 & 2032
- Figure 4: Europe Holographic Imaging Market Revenue (Million), by Country 2024 & 2032
- Figure 5: Europe Holographic Imaging Market Revenue Share (%), by Country 2024 & 2032
- Figure 6: Asia Pacific Holographic Imaging Market Revenue (Million), by Country 2024 & 2032
- Figure 7: Asia Pacific Holographic Imaging Market Revenue Share (%), by Country 2024 & 2032
- Figure 8: Latin America Holographic Imaging Market Revenue (Million), by Country 2024 & 2032
- Figure 9: Latin America Holographic Imaging Market Revenue Share (%), by Country 2024 & 2032
- Figure 10: Middle East and Africa Holographic Imaging Market Revenue (Million), by Country 2024 & 2032
- Figure 11: Middle East and Africa Holographic Imaging Market Revenue Share (%), by Country 2024 & 2032
- Figure 12: North America Holographic Imaging Market Revenue (Million), by Offering 2024 & 2032
- Figure 13: North America Holographic Imaging Market Revenue Share (%), by Offering 2024 & 2032
- Figure 14: North America Holographic Imaging Market Revenue (Million), by Application 2024 & 2032
- Figure 15: North America Holographic Imaging Market Revenue Share (%), by Application 2024 & 2032
- Figure 16: North America Holographic Imaging Market Revenue (Million), by End-user Vertical 2024 & 2032
- Figure 17: North America Holographic Imaging Market Revenue Share (%), by End-user Vertical 2024 & 2032
- Figure 18: North America Holographic Imaging Market Revenue (Million), by Country 2024 & 2032
- Figure 19: North America Holographic Imaging Market Revenue Share (%), by Country 2024 & 2032
- Figure 20: Europe Holographic Imaging Market Revenue (Million), by Offering 2024 & 2032
- Figure 21: Europe Holographic Imaging Market Revenue Share (%), by Offering 2024 & 2032
- Figure 22: Europe Holographic Imaging Market Revenue (Million), by Application 2024 & 2032
- Figure 23: Europe Holographic Imaging Market Revenue Share (%), by Application 2024 & 2032
- Figure 24: Europe Holographic Imaging Market Revenue (Million), by End-user Vertical 2024 & 2032
- Figure 25: Europe Holographic Imaging Market Revenue Share (%), by End-user Vertical 2024 & 2032
- Figure 26: Europe Holographic Imaging Market Revenue (Million), by Country 2024 & 2032
- Figure 27: Europe Holographic Imaging Market Revenue Share (%), by Country 2024 & 2032
- Figure 28: Asia Pacific Holographic Imaging Market Revenue (Million), by Offering 2024 & 2032
- Figure 29: Asia Pacific Holographic Imaging Market Revenue Share (%), by Offering 2024 & 2032
- Figure 30: Asia Pacific Holographic Imaging Market Revenue (Million), by Application 2024 & 2032
- Figure 31: Asia Pacific Holographic Imaging Market Revenue Share (%), by Application 2024 & 2032
- Figure 32: Asia Pacific Holographic Imaging Market Revenue (Million), by End-user Vertical 2024 & 2032
- Figure 33: Asia Pacific Holographic Imaging Market Revenue Share (%), by End-user Vertical 2024 & 2032
- Figure 34: Asia Pacific Holographic Imaging Market Revenue (Million), by Country 2024 & 2032
- Figure 35: Asia Pacific Holographic Imaging Market Revenue Share (%), by Country 2024 & 2032
- Figure 36: Latin America Holographic Imaging Market Revenue (Million), by Offering 2024 & 2032
- Figure 37: Latin America Holographic Imaging Market Revenue Share (%), by Offering 2024 & 2032
- Figure 38: Latin America Holographic Imaging Market Revenue (Million), by Application 2024 & 2032
- Figure 39: Latin America Holographic Imaging Market Revenue Share (%), by Application 2024 & 2032
- Figure 40: Latin America Holographic Imaging Market Revenue (Million), by End-user Vertical 2024 & 2032
- Figure 41: Latin America Holographic Imaging Market Revenue Share (%), by End-user Vertical 2024 & 2032
- Figure 42: Latin America Holographic Imaging Market Revenue (Million), by Country 2024 & 2032
- Figure 43: Latin America Holographic Imaging Market Revenue Share (%), by Country 2024 & 2032
- Figure 44: Middle East and Africa Holographic Imaging Market Revenue (Million), by Offering 2024 & 2032
- Figure 45: Middle East and Africa Holographic Imaging Market Revenue Share (%), by Offering 2024 & 2032
- Figure 46: Middle East and Africa Holographic Imaging Market Revenue (Million), by Application 2024 & 2032
- Figure 47: Middle East and Africa Holographic Imaging Market Revenue Share (%), by Application 2024 & 2032
- Figure 48: Middle East and Africa Holographic Imaging Market Revenue (Million), by End-user Vertical 2024 & 2032
- Figure 49: Middle East and Africa Holographic Imaging Market Revenue Share (%), by End-user Vertical 2024 & 2032
- Figure 50: Middle East and Africa Holographic Imaging Market Revenue (Million), by Country 2024 & 2032
- Figure 51: Middle East and Africa Holographic Imaging Market Revenue Share (%), by Country 2024 & 2032
List of Tables
- Table 1: Global Holographic Imaging Market Revenue Million Forecast, by Region 2019 & 2032
- Table 2: Global Holographic Imaging Market Revenue Million Forecast, by Offering 2019 & 2032
- Table 3: Global Holographic Imaging Market Revenue Million Forecast, by Application 2019 & 2032
- Table 4: Global Holographic Imaging Market Revenue Million Forecast, by End-user Vertical 2019 & 2032
- Table 5: Global Holographic Imaging Market Revenue Million Forecast, by Region 2019 & 2032
- Table 6: Global Holographic Imaging Market Revenue Million Forecast, by Country 2019 & 2032
- Table 7: United States Holographic Imaging Market Revenue (Million) Forecast, by Application 2019 & 2032
- Table 8: Canada Holographic Imaging Market Revenue (Million) Forecast, by Application 2019 & 2032
- Table 9: Global Holographic Imaging Market Revenue Million Forecast, by Country 2019 & 2032
- Table 10: Germany Holographic Imaging Market Revenue (Million) Forecast, by Application 2019 & 2032
- Table 11: United Kingdom Holographic Imaging Market Revenue (Million) Forecast, by Application 2019 & 2032
- Table 12: France Holographic Imaging Market Revenue (Million) Forecast, by Application 2019 & 2032
- Table 13: Rest of Europe Holographic Imaging Market Revenue (Million) Forecast, by Application 2019 & 2032
- Table 14: Global Holographic Imaging Market Revenue Million Forecast, by Country 2019 & 2032
- Table 15: India Holographic Imaging Market Revenue (Million) Forecast, by Application 2019 & 2032
- Table 16: China Holographic Imaging Market Revenue (Million) Forecast, by Application 2019 & 2032
- Table 17: Japan Holographic Imaging Market Revenue (Million) Forecast, by Application 2019 & 2032
- Table 18: Rest of Asia Pacific Holographic Imaging Market Revenue (Million) Forecast, by Application 2019 & 2032
- Table 19: Global Holographic Imaging Market Revenue Million Forecast, by Country 2019 & 2032
- Table 20: Brazil Holographic Imaging Market Revenue (Million) Forecast, by Application 2019 & 2032
- Table 21: Argentina Holographic Imaging Market Revenue (Million) Forecast, by Application 2019 & 2032
- Table 22: Rest of Latin America Holographic Imaging Market Revenue (Million) Forecast, by Application 2019 & 2032
- Table 23: Global Holographic Imaging Market Revenue Million Forecast, by Country 2019 & 2032
- Table 24: United Arab Emirates Holographic Imaging Market Revenue (Million) Forecast, by Application 2019 & 2032
- Table 25: Saudi Arabia Holographic Imaging Market Revenue (Million) Forecast, by Application 2019 & 2032
- Table 26: Rest of Middle East and Africa Holographic Imaging Market Revenue (Million) Forecast, by Application 2019 & 2032
- Table 27: Global Holographic Imaging Market Revenue Million Forecast, by Offering 2019 & 2032
- Table 28: Global Holographic Imaging Market Revenue Million Forecast, by Application 2019 & 2032
- Table 29: Global Holographic Imaging Market Revenue Million Forecast, by End-user Vertical 2019 & 2032
- Table 30: Global Holographic Imaging Market Revenue Million Forecast, by Country 2019 & 2032
- Table 31: United States Holographic Imaging Market Revenue (Million) Forecast, by Application 2019 & 2032
- Table 32: Canada Holographic Imaging Market Revenue (Million) Forecast, by Application 2019 & 2032
- Table 33: Global Holographic Imaging Market Revenue Million Forecast, by Offering 2019 & 2032
- Table 34: Global Holographic Imaging Market Revenue Million Forecast, by Application 2019 & 2032
- Table 35: Global Holographic Imaging Market Revenue Million Forecast, by End-user Vertical 2019 & 2032
- Table 36: Global Holographic Imaging Market Revenue Million Forecast, by Country 2019 & 2032
- Table 37: Germany Holographic Imaging Market Revenue (Million) Forecast, by Application 2019 & 2032
- Table 38: United Kingdom Holographic Imaging Market Revenue (Million) Forecast, by Application 2019 & 2032
- Table 39: France Holographic Imaging Market Revenue (Million) Forecast, by Application 2019 & 2032
- Table 40: Rest of Europe Holographic Imaging Market Revenue (Million) Forecast, by Application 2019 & 2032
- Table 41: Global Holographic Imaging Market Revenue Million Forecast, by Offering 2019 & 2032
- Table 42: Global Holographic Imaging Market Revenue Million Forecast, by Application 2019 & 2032
- Table 43: Global Holographic Imaging Market Revenue Million Forecast, by End-user Vertical 2019 & 2032
- Table 44: Global Holographic Imaging Market Revenue Million Forecast, by Country 2019 & 2032
- Table 45: India Holographic Imaging Market Revenue (Million) Forecast, by Application 2019 & 2032
- Table 46: China Holographic Imaging Market Revenue (Million) Forecast, by Application 2019 & 2032
- Table 47: Japan Holographic Imaging Market Revenue (Million) Forecast, by Application 2019 & 2032
- Table 48: Rest of Asia Pacific Holographic Imaging Market Revenue (Million) Forecast, by Application 2019 & 2032
- Table 49: Global Holographic Imaging Market Revenue Million Forecast, by Offering 2019 & 2032
- Table 50: Global Holographic Imaging Market Revenue Million Forecast, by Application 2019 & 2032
- Table 51: Global Holographic Imaging Market Revenue Million Forecast, by End-user Vertical 2019 & 2032
- Table 52: Global Holographic Imaging Market Revenue Million Forecast, by Country 2019 & 2032
- Table 53: Brazil Holographic Imaging Market Revenue (Million) Forecast, by Application 2019 & 2032
- Table 54: Argentina Holographic Imaging Market Revenue (Million) Forecast, by Application 2019 & 2032
- Table 55: Rest of Latin America Holographic Imaging Market Revenue (Million) Forecast, by Application 2019 & 2032
- Table 56: Global Holographic Imaging Market Revenue Million Forecast, by Offering 2019 & 2032
- Table 57: Global Holographic Imaging Market Revenue Million Forecast, by Application 2019 & 2032
- Table 58: Global Holographic Imaging Market Revenue Million Forecast, by End-user Vertical 2019 & 2032
- Table 59: Global Holographic Imaging Market Revenue Million Forecast, by Country 2019 & 2032
- Table 60: United Arab Emirates Holographic Imaging Market Revenue (Million) Forecast, by Application 2019 & 2032
- Table 61: Saudi Arabia Holographic Imaging Market Revenue (Million) Forecast, by Application 2019 & 2032
- Table 62: Rest of Middle East and Africa Holographic Imaging Market Revenue (Million) Forecast, by Application 2019 & 2032
Frequently Asked Questions
1. What is the projected Compound Annual Growth Rate (CAGR) of the Holographic Imaging Market?
The projected CAGR is approximately 16.79%.
2. Which companies are prominent players in the Holographic Imaging Market?
Key companies in the market include Intelligent Imaging Innovations, MetroLaser Inc, Eon Reality, RealView Imaging Ltd, Holmarc Opto-Mechatronics Pvt Ltd*List Not Exhaustive, Mit Media Lab, Lyncee TEC SA, Jasper Display Corporation, Leia Inc, Geola Digital Uab, Phase Holographic Imaging AB, Light Logics Holography and Optics.
3. What are the main segments of the Holographic Imaging Market?
The market segments include Offering, Application, End-user Vertical.
4. Can you provide details about the market size?
The market size is estimated to be USD XX Million as of 2022.
5. What are some drivers contributing to market growth?
Increased Demand for GPS Technology in Military Applications; Improving Overall GPRS Infrastructure; Rising Demand for Unmanned Airborne Vehicles and Systems.
6. What are the notable trends driving market growth?
Digital Holographic Displays to Hold the Significant Market Share.
7. Are there any restraints impacting market growth?
Complexity in Manufacturing; Interoperability with Existing Systems.
8. Can you provide examples of recent developments in the market?
N/A
9. What pricing options are available for accessing the report?
Pricing options include single-user, multi-user, and enterprise licenses priced at USD 4750, USD 5250, and USD 8750 respectively.
10. Is the market size provided in terms of value or volume?
The market size is provided in terms of value, measured in Million.
11. Are there any specific market keywords associated with the report?
Yes, the market keyword associated with the report is "Holographic Imaging Market," which aids in identifying and referencing the specific market segment covered.
12. How do I determine which pricing option suits my needs best?
The pricing options vary based on user requirements and access needs. Individual users may opt for single-user licenses, while businesses requiring broader access may choose multi-user or enterprise licenses for cost-effective access to the report.
13. Are there any additional resources or data provided in the Holographic Imaging Market report?
While the report offers comprehensive insights, it's advisable to review the specific contents or supplementary materials provided to ascertain if additional resources or data are available.
14. How can I stay updated on further developments or reports in the Holographic Imaging Market?
To stay informed about further developments, trends, and reports in the Holographic Imaging Market, consider subscribing to industry newsletters, following relevant companies and organizations, or regularly checking reputable industry news sources and publications.
Methodology
Step 1 - Identification of Relevant Samples Size from Population Database


Step 2 - Approaches for Defining Global Market Size (Value, Volume* & Price*)

Note*: In applicable scenarios
Step 3 - Data Sources
Primary Research
- Web Analytics
- Survey Reports
- Research Institute
- Latest Research Reports
- Opinion Leaders
Secondary Research
- Annual Reports
- White Paper
- Latest Press Release
- Industry Association
- Paid Database
- Investor Presentations

Step 4 - Data Triangulation
Involves using different sources of information in order to increase the validity of a study
These sources are likely to be stakeholders in a program - participants, other researchers, program staff, other community members, and so on.
Then we put all data in single framework & apply various statistical tools to find out the dynamic on the market.
During the analysis stage, feedback from the stakeholder groups would be compared to determine areas of agreement as well as areas of divergence
