

Key Insights
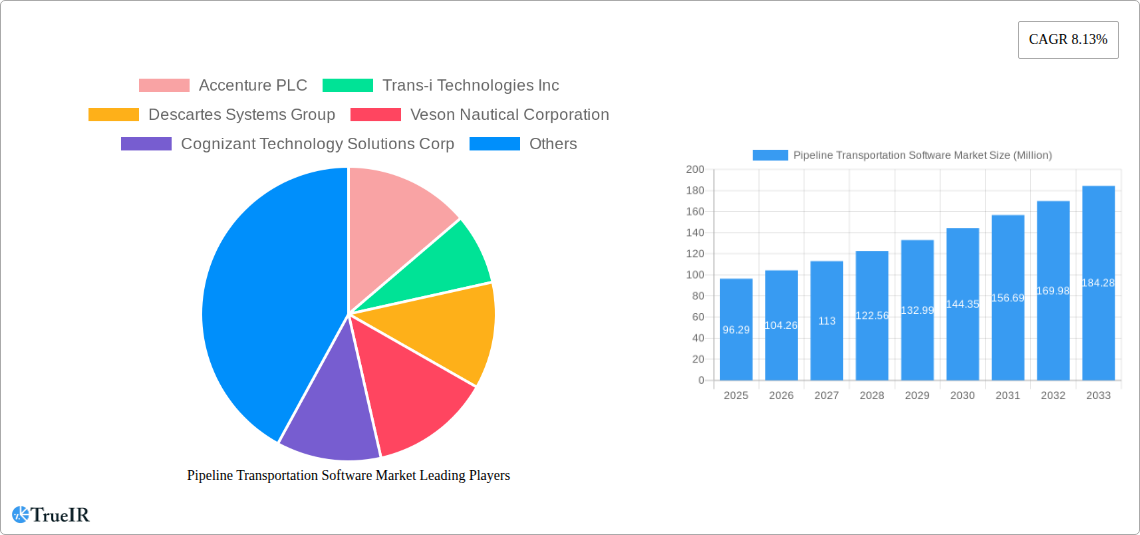
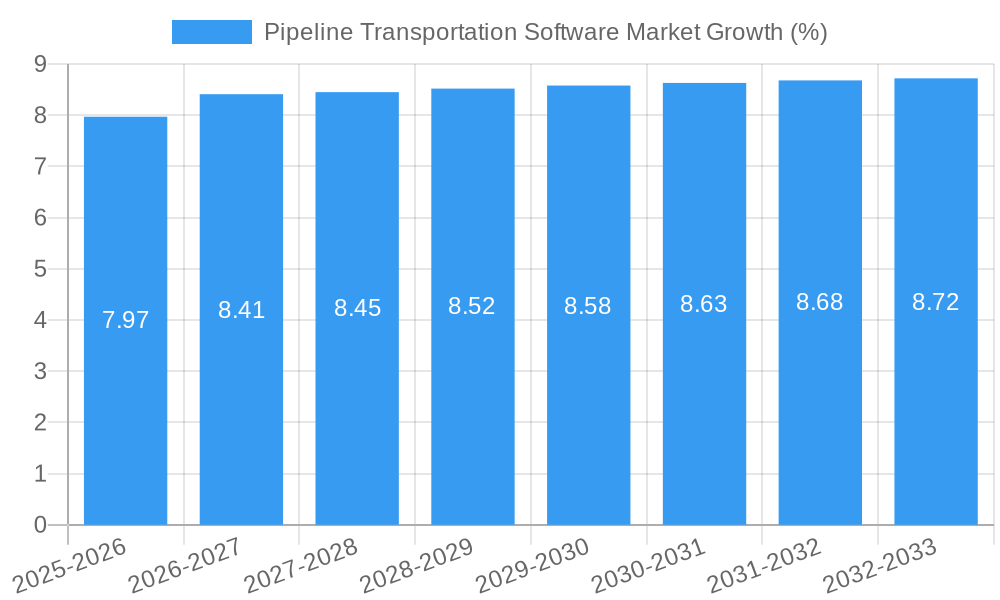
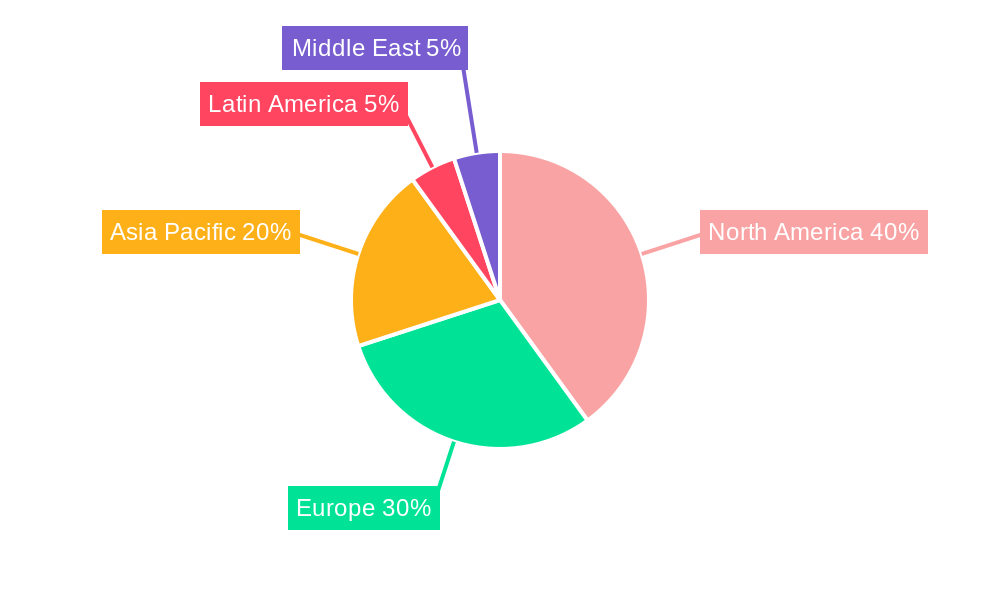
The Pipeline Transportation Software market, valued at $96.29 million in 2025, is projected to experience robust growth, driven by increasing demand for efficient and secure pipeline management solutions across various sectors. The market's Compound Annual Growth Rate (CAGR) of 8.13% from 2025 to 2033 indicates a significant expansion, fueled by several key factors. The rising adoption of cloud-based solutions offers enhanced scalability, accessibility, and cost-effectiveness, attracting a wider range of users. Furthermore, stringent regulatory compliance requirements and the need to minimize operational risks are pushing organizations to invest in advanced software capable of real-time monitoring, data analysis, and predictive maintenance. The diverse end-user verticals, including oil and gas, chemicals, manufacturing, and retail, contribute to the market's expansion. While the on-premise deployment model continues to hold a substantial market share, the cloud deployment segment is anticipated to witness faster growth due to its inherent flexibility and adaptability. Specific geographic regions like North America and Europe, with their established pipeline infrastructure and technological advancements, currently represent major market segments, but significant growth potential exists in the Asia-Pacific region due to increasing infrastructure development and industrialization.
The competitive landscape is marked by a mix of established players and emerging companies. Accenture, Descartes Systems Group, and Cognizant are among the prominent players leveraging their expertise in consulting, logistics, and technology to offer comprehensive pipeline management solutions. The presence of specialized software providers like Trans-i Technologies and Veson Nautical further diversifies the market offerings. However, challenges remain. High initial investment costs for implementing sophisticated software and the need for skilled professionals to manage and maintain these systems can hinder adoption, particularly for smaller companies. Furthermore, cybersecurity concerns related to data breaches and operational disruptions pose a significant risk to the industry. Despite these challenges, the long-term outlook for the Pipeline Transportation Software market remains positive, with continued growth driven by technological advancements, regulatory pressures, and the increasing focus on operational efficiency within the pipeline transportation sector.
Pipeline Transportation Software Market: A Comprehensive Report (2019-2033)
This dynamic report provides a deep dive into the Pipeline Transportation Software Market, offering invaluable insights for stakeholders across the industry. With a comprehensive analysis spanning the period 2019-2033, this report leverages extensive data and expert analysis to illuminate market trends, opportunities, and challenges. The study period covers the historical period (2019-2024), the base year (2025), the estimated year (2025), and the forecast period (2025-2033). The market is valued at xx Million in 2025 and is projected to reach xx Million by 2033, exhibiting a robust CAGR of xx%.
Pipeline Transportation Software Market Market Structure & Competitive Landscape
The Pipeline Transportation Software Market exhibits a moderately consolidated structure, with several key players dominating significant market share. The Herfindahl-Hirschman Index (HHI) is estimated at xx, indicating a moderately concentrated market. However, the market is witnessing increased competition from new entrants and established players expanding their offerings, driving innovation and potentially reducing concentration in the coming years.
Key Market Dynamics:
- Innovation Drivers: The market is driven by advancements in data analytics, IoT integration, cloud computing, and AI-powered optimization solutions. These technologies enhance pipeline efficiency, safety, and operational visibility.
- Regulatory Impacts: Stringent government regulations concerning pipeline safety and environmental compliance are shaping the demand for sophisticated software solutions that ensure adherence to standards.
- Product Substitutes: Limited readily available substitutes exist, enhancing the market's growth trajectory. The specialized nature of pipeline management software creates a high barrier to entry for alternative solutions.
- End-User Segmentation: Key end-user verticals include Oil and Gas, Manufacturing and Industrial, Chemical, and Retail, with each sector exhibiting unique software needs. The Oil and Gas sector, in particular, is a major driver due to the critical role of efficient pipeline management in hydrocarbon production and distribution.
- M&A Trends: The market has witnessed xx mergers and acquisitions in the past five years, demonstrating consolidation and strategic expansion by major players. This trend is projected to continue, fostering further market concentration.
Pipeline Transportation Software Market Market Trends & Opportunities
The Pipeline Transportation Software Market is experiencing significant growth, driven by several factors. Increasing global energy demand, coupled with the need for efficient and safe pipeline operations, fuels the demand for advanced software solutions. The shift towards cloud-based deployments is also a key trend, offering scalability, cost-effectiveness, and enhanced accessibility. Furthermore, the integration of IoT sensors and AI/ML algorithms is enhancing predictive maintenance, optimizing pipeline performance, and improving overall safety.
The market's growth is further bolstered by:
- Rising investments in pipeline infrastructure: Government initiatives and private investments in pipeline modernization and expansion are key drivers. Examples include the USD 30.6 million investment by Serbia's government and the USD 131 million loan secured by NSFTPL in India.
- Growing focus on operational efficiency and cost optimization: Companies are increasingly adopting pipeline transportation software to optimize operational processes and reduce costs.
- Strengthening cybersecurity concerns: The need to protect pipeline infrastructure from cyberattacks is driving the adoption of robust security features in pipeline software solutions.
Dominant Markets & Segments in Pipeline Transportation Software Market
The Oil and Gas sector is the dominant end-user vertical, accounting for approximately xx% of the market share in 2025. This dominance is due to the critical role of pipeline transportation in the oil and gas industry and the growing need for sophisticated software solutions to manage large-scale pipeline networks. The cloud deployment model is gaining traction, projected to hold xx% market share by 2033, driven by its scalability, accessibility and cost-effectiveness.
Key Growth Drivers:
- Stringent safety regulations: Governments worldwide are implementing stricter regulations on pipeline safety, driving demand for software solutions that help meet these requirements.
- Infrastructure development: Significant investments in new pipeline infrastructure are fueling market growth, especially in regions with rapidly developing economies.
- Technological advancements: Innovations in areas such as AI, IoT, and cloud computing are providing opportunities for improved pipeline management and efficiency.
Regional Dominance: North America currently holds the largest market share, followed by Europe and Asia-Pacific. However, rapidly developing economies in Asia-Pacific are expected to show significant growth during the forecast period.
Pipeline Transportation Software Market Product Analysis
Pipeline transportation software solutions encompass a wide range of functionalities, including pipeline monitoring and control, SCADA integration, leak detection, and predictive maintenance. The integration of advanced analytics and AI/ML algorithms is driving product innovation, providing deeper insights into pipeline operations and optimizing performance. Competitive advantages are primarily based on functionalities, ease of use, scalability, and the robustness of security features.
Key Drivers, Barriers & Challenges in Pipeline Transportation Software Market
Key Drivers:
- Increased demand for efficient pipeline operations, driven by growth in the oil and gas, chemical, and manufacturing industries.
- Stringent government regulations mandating improved pipeline safety and environmental protection.
- Technological advancements enabling enhanced data analysis, predictive maintenance, and optimized resource allocation.
Challenges and Restraints:
- High initial investment costs associated with implementing new software solutions can be a barrier for smaller companies.
- Integration challenges with existing pipeline infrastructure can create implementation difficulties.
- Cybersecurity concerns related to protecting sensitive pipeline data present a significant challenge. A recent study indicated xx% of pipeline operators experienced at least one significant cybersecurity incident in the past year, resulting in xx Million in losses.
Growth Drivers in the Pipeline Transportation Software Market Market
Key drivers include increasing investments in pipeline infrastructure, stringent safety regulations, and technological advancements in data analytics, IoT, and AI. The growth in the Oil and Gas sector and the increasing adoption of cloud-based solutions further accelerate market expansion.
Challenges Impacting Pipeline Transportation Software Market Growth
High initial investment costs, integration complexity, cybersecurity risks, and the need for skilled personnel to operate and maintain these systems represent major challenges. The fragmented nature of the industry and competition from established players also present obstacles to market growth.
Key Players Shaping the Pipeline Transportation Software Market Market
- Accenture PLC
- Trans-i Technologies Inc
- Descartes Systems Group
- Veson Nautical Corporation
- Cognizant Technology Solutions Corp
- HighJump Software Inc
- Bass Software Ltd
- SAP SE
- DNV GL (GL Maritime Software GmbH)
- Aljex Software Inc
Significant Pipeline Transportation Software Market Industry Milestones
- April 2023: Serbia's government announces a EUR 28 million (USD 30.6 million) investment in river transport infrastructure development under the "Sail Through Serbia" initiative, boosting market opportunities.
- January 2023: NSFTPL and ADB sign a USD 131 million loan agreement to upgrade the Jawaharlal Nehru Port Container Terminal in India, creating further expansion opportunities in the logistics sector.
Future Outlook for Pipeline Transportation Software Market Market
The Pipeline Transportation Software Market is poised for continued growth, driven by ongoing investments in pipeline infrastructure, stringent safety regulations, and the increasing adoption of advanced technologies. Strategic partnerships, product innovations, and expansion into emerging markets will further shape the market's future. The market is projected to experience significant growth across all segments, with the cloud-based segment leading the way.
Pipeline Transportation Software Market Segmentation
-
1. Deployment
- 1.1. On-premise
- 1.2. Cloud
- 1.3. Hybrid
-
2. End-user Vertical
- 2.1. Retail
- 2.2. Oil and Gas
- 2.3. Manufacturing and Industrial
- 2.4. Aerospace and Defense
- 2.5. Chemical
- 2.6. Construction
- 2.7. Healthcare
- 2.8. Food and Beverage
- 2.9. Other End-user Verticals
Pipeline Transportation Software Market Segmentation By Geography
- 1. North America
- 2. Europe
- 3. Asia Pacific
- 4. Latin America
- 5. Middle East
Pipeline Transportation Software Market REPORT HIGHLIGHTS
| Aspects | Details |
|---|---|
| Study Period | 2019-2033 |
| Base Year | 2024 |
| Estimated Year | 2025 |
| Forecast Period | 2025-2033 |
| Historical Period | 2019-2024 |
| Growth Rate | CAGR of 8.13% from 2019-2033 |
| Segmentation |
|
Table of Contents
- 1. Introduction
- 1.1. Research Scope
- 1.2. Market Segmentation
- 1.3. Research Methodology
- 1.4. Definitions and Assumptions
- 2. Executive Summary
- 2.1. Introduction
- 3. Market Dynamics
- 3.1. Introduction
- 3.2. Market Drivers
- 3.2.1. Increasing Volume of Cargo; Establishment of New Ports in Developing Countries
- 3.3. Market Restrains
- 3.3.1. Stringent Emission Laws and Policies
- 3.4. Market Trends
- 3.4.1. Establishment of New Ports in Developing Countries is Expected to Drive the Market
- 4. Market Factor Analysis
- 4.1. Porters Five Forces
- 4.2. Supply/Value Chain
- 4.3. PESTEL analysis
- 4.4. Market Entropy
- 4.5. Patent/Trademark Analysis
- 5. Global Pipeline Transportation Software Market Analysis, Insights and Forecast, 2019-2031
- 5.1. Market Analysis, Insights and Forecast - by Deployment
- 5.1.1. On-premise
- 5.1.2. Cloud
- 5.1.3. Hybrid
- 5.2. Market Analysis, Insights and Forecast - by End-user Vertical
- 5.2.1. Retail
- 5.2.2. Oil and Gas
- 5.2.3. Manufacturing and Industrial
- 5.2.4. Aerospace and Defense
- 5.2.5. Chemical
- 5.2.6. Construction
- 5.2.7. Healthcare
- 5.2.8. Food and Beverage
- 5.2.9. Other End-user Verticals
- 5.3. Market Analysis, Insights and Forecast - by Region
- 5.3.1. North America
- 5.3.2. Europe
- 5.3.3. Asia Pacific
- 5.3.4. Latin America
- 5.3.5. Middle East
- 5.1. Market Analysis, Insights and Forecast - by Deployment
- 6. North America Pipeline Transportation Software Market Analysis, Insights and Forecast, 2019-2031
- 6.1. Market Analysis, Insights and Forecast - by Deployment
- 6.1.1. On-premise
- 6.1.2. Cloud
- 6.1.3. Hybrid
- 6.2. Market Analysis, Insights and Forecast - by End-user Vertical
- 6.2.1. Retail
- 6.2.2. Oil and Gas
- 6.2.3. Manufacturing and Industrial
- 6.2.4. Aerospace and Defense
- 6.2.5. Chemical
- 6.2.6. Construction
- 6.2.7. Healthcare
- 6.2.8. Food and Beverage
- 6.2.9. Other End-user Verticals
- 6.1. Market Analysis, Insights and Forecast - by Deployment
- 7. Europe Pipeline Transportation Software Market Analysis, Insights and Forecast, 2019-2031
- 7.1. Market Analysis, Insights and Forecast - by Deployment
- 7.1.1. On-premise
- 7.1.2. Cloud
- 7.1.3. Hybrid
- 7.2. Market Analysis, Insights and Forecast - by End-user Vertical
- 7.2.1. Retail
- 7.2.2. Oil and Gas
- 7.2.3. Manufacturing and Industrial
- 7.2.4. Aerospace and Defense
- 7.2.5. Chemical
- 7.2.6. Construction
- 7.2.7. Healthcare
- 7.2.8. Food and Beverage
- 7.2.9. Other End-user Verticals
- 7.1. Market Analysis, Insights and Forecast - by Deployment
- 8. Asia Pacific Pipeline Transportation Software Market Analysis, Insights and Forecast, 2019-2031
- 8.1. Market Analysis, Insights and Forecast - by Deployment
- 8.1.1. On-premise
- 8.1.2. Cloud
- 8.1.3. Hybrid
- 8.2. Market Analysis, Insights and Forecast - by End-user Vertical
- 8.2.1. Retail
- 8.2.2. Oil and Gas
- 8.2.3. Manufacturing and Industrial
- 8.2.4. Aerospace and Defense
- 8.2.5. Chemical
- 8.2.6. Construction
- 8.2.7. Healthcare
- 8.2.8. Food and Beverage
- 8.2.9. Other End-user Verticals
- 8.1. Market Analysis, Insights and Forecast - by Deployment
- 9. Latin America Pipeline Transportation Software Market Analysis, Insights and Forecast, 2019-2031
- 9.1. Market Analysis, Insights and Forecast - by Deployment
- 9.1.1. On-premise
- 9.1.2. Cloud
- 9.1.3. Hybrid
- 9.2. Market Analysis, Insights and Forecast - by End-user Vertical
- 9.2.1. Retail
- 9.2.2. Oil and Gas
- 9.2.3. Manufacturing and Industrial
- 9.2.4. Aerospace and Defense
- 9.2.5. Chemical
- 9.2.6. Construction
- 9.2.7. Healthcare
- 9.2.8. Food and Beverage
- 9.2.9. Other End-user Verticals
- 9.1. Market Analysis, Insights and Forecast - by Deployment
- 10. Middle East Pipeline Transportation Software Market Analysis, Insights and Forecast, 2019-2031
- 10.1. Market Analysis, Insights and Forecast - by Deployment
- 10.1.1. On-premise
- 10.1.2. Cloud
- 10.1.3. Hybrid
- 10.2. Market Analysis, Insights and Forecast - by End-user Vertical
- 10.2.1. Retail
- 10.2.2. Oil and Gas
- 10.2.3. Manufacturing and Industrial
- 10.2.4. Aerospace and Defense
- 10.2.5. Chemical
- 10.2.6. Construction
- 10.2.7. Healthcare
- 10.2.8. Food and Beverage
- 10.2.9. Other End-user Verticals
- 10.1. Market Analysis, Insights and Forecast - by Deployment
- 11. North America Pipeline Transportation Software Market Analysis, Insights and Forecast, 2019-2031
- 11.1. Market Analysis, Insights and Forecast - By Country/Sub-region
- 11.1.1.
- 12. Europe Pipeline Transportation Software Market Analysis, Insights and Forecast, 2019-2031
- 12.1. Market Analysis, Insights and Forecast - By Country/Sub-region
- 12.1.1.
- 13. Asia Pacific Pipeline Transportation Software Market Analysis, Insights and Forecast, 2019-2031
- 13.1. Market Analysis, Insights and Forecast - By Country/Sub-region
- 13.1.1.
- 14. Latin America Pipeline Transportation Software Market Analysis, Insights and Forecast, 2019-2031
- 14.1. Market Analysis, Insights and Forecast - By Country/Sub-region
- 14.1.1.
- 15. Middle East Pipeline Transportation Software Market Analysis, Insights and Forecast, 2019-2031
- 15.1. Market Analysis, Insights and Forecast - By Country/Sub-region
- 15.1.1.
- 16. Competitive Analysis
- 16.1. Global Market Share Analysis 2024
- 16.2. Company Profiles
- 16.2.1 Accenture PLC
- 16.2.1.1. Overview
- 16.2.1.2. Products
- 16.2.1.3. SWOT Analysis
- 16.2.1.4. Recent Developments
- 16.2.1.5. Financials (Based on Availability)
- 16.2.2 Trans-i Technologies Inc
- 16.2.2.1. Overview
- 16.2.2.2. Products
- 16.2.2.3. SWOT Analysis
- 16.2.2.4. Recent Developments
- 16.2.2.5. Financials (Based on Availability)
- 16.2.3 Descartes Systems Group
- 16.2.3.1. Overview
- 16.2.3.2. Products
- 16.2.3.3. SWOT Analysis
- 16.2.3.4. Recent Developments
- 16.2.3.5. Financials (Based on Availability)
- 16.2.4 Veson Nautical Corporation
- 16.2.4.1. Overview
- 16.2.4.2. Products
- 16.2.4.3. SWOT Analysis
- 16.2.4.4. Recent Developments
- 16.2.4.5. Financials (Based on Availability)
- 16.2.5 Cognizant Technology Solutions Corp
- 16.2.5.1. Overview
- 16.2.5.2. Products
- 16.2.5.3. SWOT Analysis
- 16.2.5.4. Recent Developments
- 16.2.5.5. Financials (Based on Availability)
- 16.2.6 HighJump Software Inc
- 16.2.6.1. Overview
- 16.2.6.2. Products
- 16.2.6.3. SWOT Analysis
- 16.2.6.4. Recent Developments
- 16.2.6.5. Financials (Based on Availability)
- 16.2.7 Bass Software Ltd *List Not Exhaustive
- 16.2.7.1. Overview
- 16.2.7.2. Products
- 16.2.7.3. SWOT Analysis
- 16.2.7.4. Recent Developments
- 16.2.7.5. Financials (Based on Availability)
- 16.2.8 SAP SE
- 16.2.8.1. Overview
- 16.2.8.2. Products
- 16.2.8.3. SWOT Analysis
- 16.2.8.4. Recent Developments
- 16.2.8.5. Financials (Based on Availability)
- 16.2.9 DNV GL (GL Maritime Software GmbH
- 16.2.9.1. Overview
- 16.2.9.2. Products
- 16.2.9.3. SWOT Analysis
- 16.2.9.4. Recent Developments
- 16.2.9.5. Financials (Based on Availability)
- 16.2.10 Aljex Software Inc
- 16.2.10.1. Overview
- 16.2.10.2. Products
- 16.2.10.3. SWOT Analysis
- 16.2.10.4. Recent Developments
- 16.2.10.5. Financials (Based on Availability)
- 16.2.1 Accenture PLC
List of Figures
- Figure 1: Global Pipeline Transportation Software Market Revenue Breakdown (Million, %) by Region 2024 & 2032
- Figure 2: North America Pipeline Transportation Software Market Revenue (Million), by Country 2024 & 2032
- Figure 3: North America Pipeline Transportation Software Market Revenue Share (%), by Country 2024 & 2032
- Figure 4: Europe Pipeline Transportation Software Market Revenue (Million), by Country 2024 & 2032
- Figure 5: Europe Pipeline Transportation Software Market Revenue Share (%), by Country 2024 & 2032
- Figure 6: Asia Pacific Pipeline Transportation Software Market Revenue (Million), by Country 2024 & 2032
- Figure 7: Asia Pacific Pipeline Transportation Software Market Revenue Share (%), by Country 2024 & 2032
- Figure 8: Latin America Pipeline Transportation Software Market Revenue (Million), by Country 2024 & 2032
- Figure 9: Latin America Pipeline Transportation Software Market Revenue Share (%), by Country 2024 & 2032
- Figure 10: Middle East Pipeline Transportation Software Market Revenue (Million), by Country 2024 & 2032
- Figure 11: Middle East Pipeline Transportation Software Market Revenue Share (%), by Country 2024 & 2032
- Figure 12: North America Pipeline Transportation Software Market Revenue (Million), by Deployment 2024 & 2032
- Figure 13: North America Pipeline Transportation Software Market Revenue Share (%), by Deployment 2024 & 2032
- Figure 14: North America Pipeline Transportation Software Market Revenue (Million), by End-user Vertical 2024 & 2032
- Figure 15: North America Pipeline Transportation Software Market Revenue Share (%), by End-user Vertical 2024 & 2032
- Figure 16: North America Pipeline Transportation Software Market Revenue (Million), by Country 2024 & 2032
- Figure 17: North America Pipeline Transportation Software Market Revenue Share (%), by Country 2024 & 2032
- Figure 18: Europe Pipeline Transportation Software Market Revenue (Million), by Deployment 2024 & 2032
- Figure 19: Europe Pipeline Transportation Software Market Revenue Share (%), by Deployment 2024 & 2032
- Figure 20: Europe Pipeline Transportation Software Market Revenue (Million), by End-user Vertical 2024 & 2032
- Figure 21: Europe Pipeline Transportation Software Market Revenue Share (%), by End-user Vertical 2024 & 2032
- Figure 22: Europe Pipeline Transportation Software Market Revenue (Million), by Country 2024 & 2032
- Figure 23: Europe Pipeline Transportation Software Market Revenue Share (%), by Country 2024 & 2032
- Figure 24: Asia Pacific Pipeline Transportation Software Market Revenue (Million), by Deployment 2024 & 2032
- Figure 25: Asia Pacific Pipeline Transportation Software Market Revenue Share (%), by Deployment 2024 & 2032
- Figure 26: Asia Pacific Pipeline Transportation Software Market Revenue (Million), by End-user Vertical 2024 & 2032
- Figure 27: Asia Pacific Pipeline Transportation Software Market Revenue Share (%), by End-user Vertical 2024 & 2032
- Figure 28: Asia Pacific Pipeline Transportation Software Market Revenue (Million), by Country 2024 & 2032
- Figure 29: Asia Pacific Pipeline Transportation Software Market Revenue Share (%), by Country 2024 & 2032
- Figure 30: Latin America Pipeline Transportation Software Market Revenue (Million), by Deployment 2024 & 2032
- Figure 31: Latin America Pipeline Transportation Software Market Revenue Share (%), by Deployment 2024 & 2032
- Figure 32: Latin America Pipeline Transportation Software Market Revenue (Million), by End-user Vertical 2024 & 2032
- Figure 33: Latin America Pipeline Transportation Software Market Revenue Share (%), by End-user Vertical 2024 & 2032
- Figure 34: Latin America Pipeline Transportation Software Market Revenue (Million), by Country 2024 & 2032
- Figure 35: Latin America Pipeline Transportation Software Market Revenue Share (%), by Country 2024 & 2032
- Figure 36: Middle East Pipeline Transportation Software Market Revenue (Million), by Deployment 2024 & 2032
- Figure 37: Middle East Pipeline Transportation Software Market Revenue Share (%), by Deployment 2024 & 2032
- Figure 38: Middle East Pipeline Transportation Software Market Revenue (Million), by End-user Vertical 2024 & 2032
- Figure 39: Middle East Pipeline Transportation Software Market Revenue Share (%), by End-user Vertical 2024 & 2032
- Figure 40: Middle East Pipeline Transportation Software Market Revenue (Million), by Country 2024 & 2032
- Figure 41: Middle East Pipeline Transportation Software Market Revenue Share (%), by Country 2024 & 2032
List of Tables
- Table 1: Global Pipeline Transportation Software Market Revenue Million Forecast, by Region 2019 & 2032
- Table 2: Global Pipeline Transportation Software Market Revenue Million Forecast, by Deployment 2019 & 2032
- Table 3: Global Pipeline Transportation Software Market Revenue Million Forecast, by End-user Vertical 2019 & 2032
- Table 4: Global Pipeline Transportation Software Market Revenue Million Forecast, by Region 2019 & 2032
- Table 5: Global Pipeline Transportation Software Market Revenue Million Forecast, by Country 2019 & 2032
- Table 6: Pipeline Transportation Software Market Revenue (Million) Forecast, by Application 2019 & 2032
- Table 7: Global Pipeline Transportation Software Market Revenue Million Forecast, by Country 2019 & 2032
- Table 8: Pipeline Transportation Software Market Revenue (Million) Forecast, by Application 2019 & 2032
- Table 9: Global Pipeline Transportation Software Market Revenue Million Forecast, by Country 2019 & 2032
- Table 10: Pipeline Transportation Software Market Revenue (Million) Forecast, by Application 2019 & 2032
- Table 11: Global Pipeline Transportation Software Market Revenue Million Forecast, by Country 2019 & 2032
- Table 12: Pipeline Transportation Software Market Revenue (Million) Forecast, by Application 2019 & 2032
- Table 13: Global Pipeline Transportation Software Market Revenue Million Forecast, by Country 2019 & 2032
- Table 14: Pipeline Transportation Software Market Revenue (Million) Forecast, by Application 2019 & 2032
- Table 15: Global Pipeline Transportation Software Market Revenue Million Forecast, by Deployment 2019 & 2032
- Table 16: Global Pipeline Transportation Software Market Revenue Million Forecast, by End-user Vertical 2019 & 2032
- Table 17: Global Pipeline Transportation Software Market Revenue Million Forecast, by Country 2019 & 2032
- Table 18: Global Pipeline Transportation Software Market Revenue Million Forecast, by Deployment 2019 & 2032
- Table 19: Global Pipeline Transportation Software Market Revenue Million Forecast, by End-user Vertical 2019 & 2032
- Table 20: Global Pipeline Transportation Software Market Revenue Million Forecast, by Country 2019 & 2032
- Table 21: Global Pipeline Transportation Software Market Revenue Million Forecast, by Deployment 2019 & 2032
- Table 22: Global Pipeline Transportation Software Market Revenue Million Forecast, by End-user Vertical 2019 & 2032
- Table 23: Global Pipeline Transportation Software Market Revenue Million Forecast, by Country 2019 & 2032
- Table 24: Global Pipeline Transportation Software Market Revenue Million Forecast, by Deployment 2019 & 2032
- Table 25: Global Pipeline Transportation Software Market Revenue Million Forecast, by End-user Vertical 2019 & 2032
- Table 26: Global Pipeline Transportation Software Market Revenue Million Forecast, by Country 2019 & 2032
- Table 27: Global Pipeline Transportation Software Market Revenue Million Forecast, by Deployment 2019 & 2032
- Table 28: Global Pipeline Transportation Software Market Revenue Million Forecast, by End-user Vertical 2019 & 2032
- Table 29: Global Pipeline Transportation Software Market Revenue Million Forecast, by Country 2019 & 2032
Frequently Asked Questions
1. What is the projected Compound Annual Growth Rate (CAGR) of the Pipeline Transportation Software Market?
The projected CAGR is approximately 8.13%.
2. Which companies are prominent players in the Pipeline Transportation Software Market?
Key companies in the market include Accenture PLC, Trans-i Technologies Inc, Descartes Systems Group, Veson Nautical Corporation, Cognizant Technology Solutions Corp, HighJump Software Inc, Bass Software Ltd *List Not Exhaustive, SAP SE, DNV GL (GL Maritime Software GmbH, Aljex Software Inc.
3. What are the main segments of the Pipeline Transportation Software Market?
The market segments include Deployment, End-user Vertical.
4. Can you provide details about the market size?
The market size is estimated to be USD 96.29 Million as of 2022.
5. What are some drivers contributing to market growth?
Increasing Volume of Cargo; Establishment of New Ports in Developing Countries.
6. What are the notable trends driving market growth?
Establishment of New Ports in Developing Countries is Expected to Drive the Market.
7. Are there any restraints impacting market growth?
Stringent Emission Laws and Policies.
8. Can you provide examples of recent developments in the market?
April 2023: Serbia's government announced to invest EUR 28 million (USD 30.6 million) in the overall development of river transport infrastructure all over the country as a crucial part of the Sail Through Serbia government initiative. The Sail Through Serbia initiative envisages the construction of new piers, marinas, and the increasing volume of river traffic throughout the country, thereby facilitating the market's growth opportunities.
9. What pricing options are available for accessing the report?
Pricing options include single-user, multi-user, and enterprise licenses priced at USD 4750, USD 5250, and USD 8750 respectively.
10. Is the market size provided in terms of value or volume?
The market size is provided in terms of value, measured in Million.
11. Are there any specific market keywords associated with the report?
Yes, the market keyword associated with the report is "Pipeline Transportation Software Market," which aids in identifying and referencing the specific market segment covered.
12. How do I determine which pricing option suits my needs best?
The pricing options vary based on user requirements and access needs. Individual users may opt for single-user licenses, while businesses requiring broader access may choose multi-user or enterprise licenses for cost-effective access to the report.
13. Are there any additional resources or data provided in the Pipeline Transportation Software Market report?
While the report offers comprehensive insights, it's advisable to review the specific contents or supplementary materials provided to ascertain if additional resources or data are available.
14. How can I stay updated on further developments or reports in the Pipeline Transportation Software Market?
To stay informed about further developments, trends, and reports in the Pipeline Transportation Software Market, consider subscribing to industry newsletters, following relevant companies and organizations, or regularly checking reputable industry news sources and publications.
Methodology
Step 1 - Identification of Relevant Samples Size from Population Database


Step 2 - Approaches for Defining Global Market Size (Value, Volume* & Price*)

Note*: In applicable scenarios
Step 3 - Data Sources
Primary Research
- Web Analytics
- Survey Reports
- Research Institute
- Latest Research Reports
- Opinion Leaders
Secondary Research
- Annual Reports
- White Paper
- Latest Press Release
- Industry Association
- Paid Database
- Investor Presentations

Step 4 - Data Triangulation
Involves using different sources of information in order to increase the validity of a study
These sources are likely to be stakeholders in a program - participants, other researchers, program staff, other community members, and so on.
Then we put all data in single framework & apply various statistical tools to find out the dynamic on the market.
During the analysis stage, feedback from the stakeholder groups would be compared to determine areas of agreement as well as areas of divergence
