

Key Insights
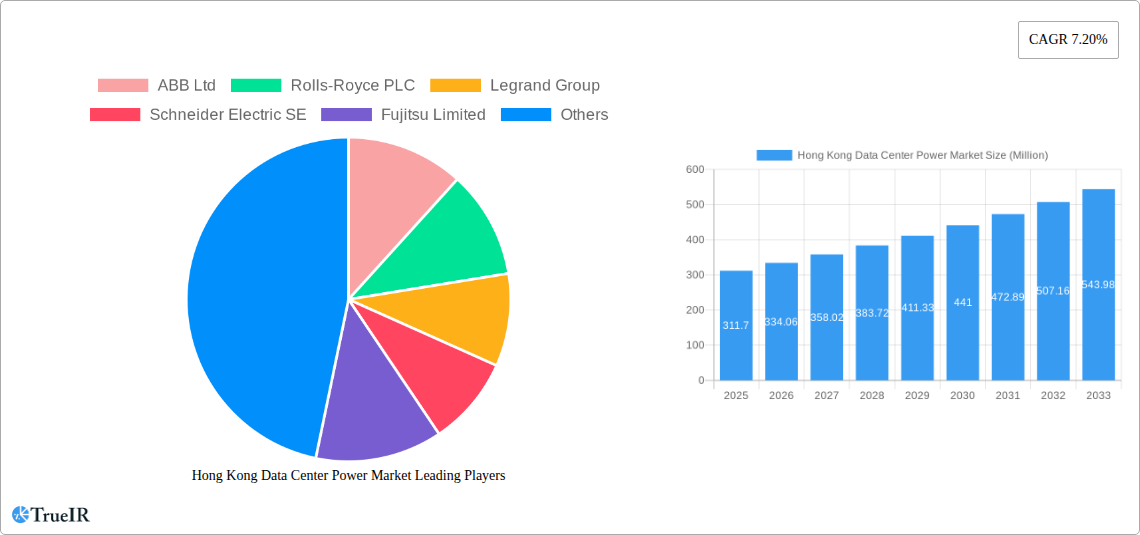
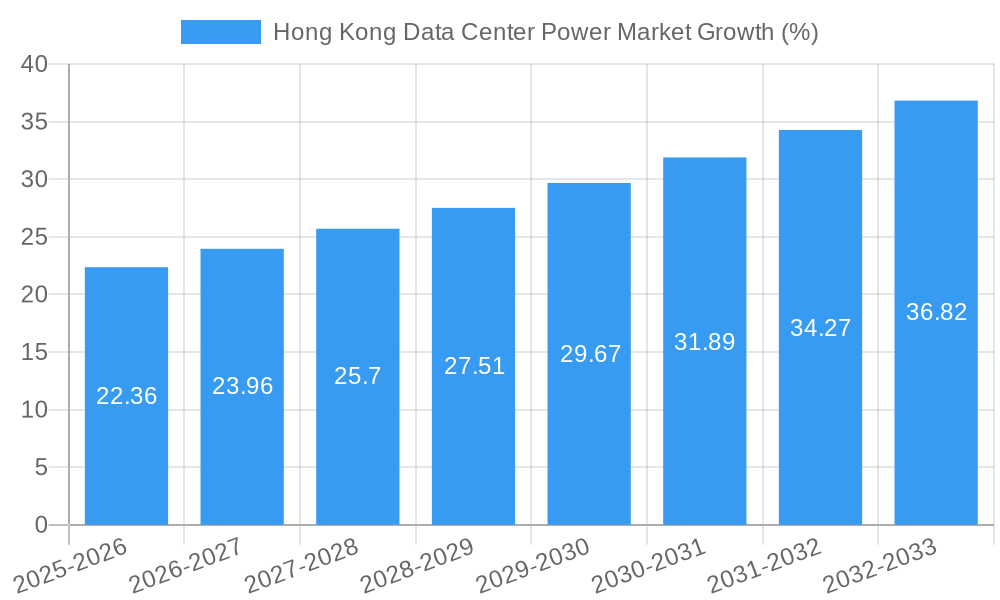
The Hong Kong data center power market, valued at $311.70 million in 2025, is projected to experience robust growth, driven by the burgeoning IT and telecommunication sectors, increasing cloud adoption, and the government's digital transformation initiatives. The market's compound annual growth rate (CAGR) of 7.20% from 2025 to 2033 indicates a significant expansion in demand for power distribution solutions, including PDUs, switchgear, and critical power infrastructure. This growth is fueled by the rising need for reliable and resilient power to support the ever-increasing computational power and data storage requirements of data centers. Key market segments include Power Distribution Solutions (PDU, Switchgear, Critical Power Distribution, Transfer Switches, Remote Power Panels), services related to these solutions, and diverse end-users, notably IT & Telecommunication, BFSI (Banking, Financial Services, and Insurance), and Government sectors. Leading vendors like ABB, Schneider Electric, and Vertiv are well-positioned to benefit from this expansion, leveraging their expertise in delivering advanced power management technologies. However, challenges such as land scarcity and potential regulatory hurdles in Hong Kong might somewhat constrain the market's growth trajectory.
The consistent growth projection of 7.20% CAGR suggests the market will surpass $500 million by 2030 and potentially reach close to $700 million by 2033. This growth is further supported by the expected rise in data center construction across Hong Kong as companies seek to increase their digital footprint and capitalise on the region’s strategic location. Factors like increasing energy efficiency requirements and the adoption of sustainable power solutions will also play a significant role in shaping the market's future. Competition will intensify among established players and emerging technology providers, leading to innovation and potentially pricing pressure. Therefore, strategic partnerships and technological advancements will be crucial for sustained success in this dynamic market.
Hong Kong Data Center Power Market: A Comprehensive Report (2019-2033)
This dynamic report delivers an in-depth analysis of the Hong Kong data center power market, providing crucial insights for investors, industry professionals, and strategic decision-makers. With a focus on market size, segmentation, key players, and future trends, this study offers a comprehensive understanding of this rapidly evolving sector. The report covers the period from 2019 to 2033, with a base year of 2025 and a forecast period spanning 2025-2033. Expect detailed analysis, quantifiable data, and actionable intelligence to navigate the complexities of this high-growth market.
Hong Kong Data Center Power Market Market Structure & Competitive Landscape
The Hong Kong data center power market exhibits a moderately concentrated structure, with a Herfindahl-Hirschman Index (HHI) estimated at xx in 2024. Key players such as ABB Ltd, Rolls-Royce PLC, Legrand Group, Schneider Electric SE, and Eaton Corporation hold significant market share, driving innovation and shaping competitive dynamics. The market is characterized by intense competition, fueled by continuous product innovation and a focus on energy efficiency. Regulatory frameworks, particularly those related to sustainability and data security, significantly impact market players. The increasing adoption of renewable energy sources is creating opportunities for new entrants and prompting mergers and acquisitions (M&A) activity. Over the historical period (2019-2024), M&A volume in the sector totalled approximately xx Million USD, with a notable increase in activity during 2022-2024.
- Market Concentration: HHI of xx in 2024 indicates moderate concentration.
- Innovation Drivers: Energy efficiency, sustainability, and advanced automation.
- Regulatory Impacts: Stringent environmental regulations and data security standards.
- Product Substitutes: Renewable energy sources and alternative backup power systems.
- End-User Segmentation: IT & Telecommunication, BFSI, Government, Media & Entertainment.
- M&A Trends: Growing consolidation and strategic partnerships, driven by technological advancements.
Hong Kong Data Center Power Market Market Trends & Opportunities
The Hong Kong data center power market is experiencing robust growth, driven by increasing data center deployments and the rising demand for reliable power infrastructure. The market size is projected to reach xx Million USD by 2025, exhibiting a Compound Annual Growth Rate (CAGR) of xx% during the forecast period (2025-2033). Technological advancements, such as the adoption of AI-powered power management systems and the growing popularity of hydrogen fuel cells as backup power sources, are reshaping the market landscape. Consumer preferences are shifting towards sustainable and resilient power solutions, creating lucrative opportunities for environmentally friendly technologies. The competitive dynamics are marked by intense competition, with leading players focusing on innovation, partnerships, and strategic acquisitions to expand their market footprint and capture greater market share. Market penetration of advanced power distribution solutions is projected to increase from xx% in 2024 to xx% by 2033.
Dominant Markets & Segments in Hong Kong Data Center Power Market
The IT & Telecommunication segment represents the largest end-user market for data center power solutions in Hong Kong, driven by the rapid growth of cloud computing and digital transformation initiatives. The Electrical Solution segment within power infrastructure dominates, reflecting the high demand for reliable and efficient power distribution systems.
Key Growth Drivers:
- Rapid growth of cloud computing and data centers.
- Increasing demand for high-availability power systems.
- Stringent government regulations promoting energy efficiency.
- Investments in 5G infrastructure and digital transformation initiatives.
Market Dominance Analysis: The IT & Telecommunication sector's dominance is fueled by the rapid expansion of data centers and the increasing adoption of cloud-based services in Hong Kong. This high demand necessitates reliable and efficient power systems, making electrical solutions a crucial component within the data center infrastructure.
Hong Kong Data Center Power Market Product Analysis
The market offers a diverse range of products, including Power Distribution Units (PDUs), switchgear, critical power distribution systems, transfer switches, remote power panels, and various services. Technological advancements focus on improving energy efficiency, enhancing reliability, and integrating advanced monitoring and control features. Products with enhanced sustainability features and reduced carbon footprint are gaining traction, aligning with growing environmental concerns. The competitive advantage lies in offering customized solutions tailored to specific data center needs and providing comprehensive service and support.
Key Drivers, Barriers & Challenges in Hong Kong Data Center Power Market
Key Drivers: The burgeoning IT sector, government initiatives promoting digitalization, rising demand for data storage, and the increasing adoption of cloud computing are driving significant growth in the market. Technological advancements in energy-efficient power solutions further accelerate this trend.
Key Challenges: Supply chain disruptions, increasing raw material costs, and regulatory hurdles related to environmental compliance pose significant challenges to market growth. Furthermore, intense competition among established players and the emergence of new market entrants create a dynamic and competitive environment. These factors could potentially constrain market expansion, necessitating strategic adaptations by market participants. Limited skilled labor is also a challenge.
Growth Drivers in the Hong Kong Data Center Power Market Market
The growth of the Hong Kong data center power market is largely fueled by the expansion of the IT and telecommunications sector, the increasing adoption of cloud computing services, and the government's initiatives supporting digital infrastructure development. Technological advancements in power management solutions and the rising demand for energy-efficient data centers are also significant drivers. Furthermore, the growing focus on ensuring data center resilience and disaster recovery adds momentum to market growth.
Challenges Impacting Hong Kong Data Center Power Market Growth
Supply chain vulnerabilities, particularly for critical components, represent a key challenge. Regulatory compliance requirements and environmental regulations can add complexity and cost to operations. The intense competition from established players and the entry of new businesses further intensify the pressure on profit margins and market share.
Key Players Shaping the Hong Kong Data Center Power Market Market
- ABB Ltd
- Rolls-Royce PLC
- Legrand Group
- Schneider Electric SE
- Fujitsu Limited
- Caterpillar Inc
- Rittal GmbH & Co KG
- Cisco Systems Inc
- Cummins Inc
- Vertiv Group Corp
- Eaton Corporation
Significant Hong Kong Data Center Power Market Industry Milestones
- January 2024: Caterpillar Inc. partnered with Microsoft and Ballard Power Systems to test hydrogen fuel cells for data center backup power, signifying a shift towards sustainable energy solutions.
- March 2024: Schneider Electric expanded its US manufacturing facilities for electrical switchgear and medium-voltage power distribution products, indicating a commitment to supporting the growing data center infrastructure globally.
Future Outlook for Hong Kong Data Center Power Market Market
The Hong Kong data center power market is poised for sustained growth, driven by continued expansion in the IT sector and the rising demand for reliable and efficient power solutions. Strategic investments in renewable energy technologies and the increasing adoption of smart power management systems will further shape the market landscape. Opportunities abound for companies offering innovative, sustainable, and cost-effective solutions that cater to the evolving needs of data center operators. The market's future is bright, with ample opportunities for innovation and growth.
Hong Kong Data Center Power Market Segmentation
-
1. Power Infrastructure
-
1.1. Electrical Solution
- 1.1.1. UPS Systems
- 1.1.2. Generators
-
1.1.3. Power Distribution Solutions
- 1.1.3.1. PDU
- 1.1.3.2. Switchgear
- 1.1.3.3. Critical Power Distribution
- 1.1.3.4. Transfer Switches
- 1.1.3.5. Remote Power Panels
- 1.1.3.6. Other Power Distribution Solutions
- 1.2. Service
-
1.1. Electrical Solution
-
2. End User
- 2.1. IT & Telecommunication
- 2.2. BFSI
- 2.3. Government
- 2.4. Media & Entertainment
- 2.5. Other End Users
Hong Kong Data Center Power Market Segmentation By Geography
-
1. North America
- 1.1. United States
- 1.2. Canada
- 1.3. Mexico
-
2. South America
- 2.1. Brazil
- 2.2. Argentina
- 2.3. Rest of South America
-
3. Europe
- 3.1. United Kingdom
- 3.2. Germany
- 3.3. France
- 3.4. Italy
- 3.5. Spain
- 3.6. Russia
- 3.7. Benelux
- 3.8. Nordics
- 3.9. Rest of Europe
-
4. Middle East & Africa
- 4.1. Turkey
- 4.2. Israel
- 4.3. GCC
- 4.4. North Africa
- 4.5. South Africa
- 4.6. Rest of Middle East & Africa
-
5. Asia Pacific
- 5.1. China
- 5.2. India
- 5.3. Japan
- 5.4. South Korea
- 5.5. ASEAN
- 5.6. Oceania
- 5.7. Rest of Asia Pacific
Hong Kong Data Center Power Market REPORT HIGHLIGHTS
| Aspects | Details |
|---|---|
| Study Period | 2019-2033 |
| Base Year | 2024 |
| Estimated Year | 2025 |
| Forecast Period | 2025-2033 |
| Historical Period | 2019-2024 |
| Growth Rate | CAGR of 7.20% from 2019-2033 |
| Segmentation |
|
Table of Contents
- 1. Introduction
- 1.1. Research Scope
- 1.2. Market Segmentation
- 1.3. Research Methodology
- 1.4. Definitions and Assumptions
- 2. Executive Summary
- 2.1. Introduction
- 3. Market Dynamics
- 3.1. Introduction
- 3.2. Market Drivers
- 3.2.1. Rising Adoption of Mega Data Centers and Cloud Computing; Increasing Demand to Reduce Operational Costs
- 3.3. Market Restrains
- 3.3.1. High Cost of Installation and Maintenance
- 3.4. Market Trends
- 3.4.1. IT & Telecommunication Segment to Hold Major Share in the Market
- 4. Market Factor Analysis
- 4.1. Porters Five Forces
- 4.2. Supply/Value Chain
- 4.3. PESTEL analysis
- 4.4. Market Entropy
- 4.5. Patent/Trademark Analysis
- 5. Global Hong Kong Data Center Power Market Analysis, Insights and Forecast, 2019-2031
- 5.1. Market Analysis, Insights and Forecast - by Power Infrastructure
- 5.1.1. Electrical Solution
- 5.1.1.1. UPS Systems
- 5.1.1.2. Generators
- 5.1.1.3. Power Distribution Solutions
- 5.1.1.3.1. PDU
- 5.1.1.3.2. Switchgear
- 5.1.1.3.3. Critical Power Distribution
- 5.1.1.3.4. Transfer Switches
- 5.1.1.3.5. Remote Power Panels
- 5.1.1.3.6. Other Power Distribution Solutions
- 5.1.2. Service
- 5.1.1. Electrical Solution
- 5.2. Market Analysis, Insights and Forecast - by End User
- 5.2.1. IT & Telecommunication
- 5.2.2. BFSI
- 5.2.3. Government
- 5.2.4. Media & Entertainment
- 5.2.5. Other End Users
- 5.3. Market Analysis, Insights and Forecast - by Region
- 5.3.1. North America
- 5.3.2. South America
- 5.3.3. Europe
- 5.3.4. Middle East & Africa
- 5.3.5. Asia Pacific
- 5.1. Market Analysis, Insights and Forecast - by Power Infrastructure
- 6. North America Hong Kong Data Center Power Market Analysis, Insights and Forecast, 2019-2031
- 6.1. Market Analysis, Insights and Forecast - by Power Infrastructure
- 6.1.1. Electrical Solution
- 6.1.1.1. UPS Systems
- 6.1.1.2. Generators
- 6.1.1.3. Power Distribution Solutions
- 6.1.1.3.1. PDU
- 6.1.1.3.2. Switchgear
- 6.1.1.3.3. Critical Power Distribution
- 6.1.1.3.4. Transfer Switches
- 6.1.1.3.5. Remote Power Panels
- 6.1.1.3.6. Other Power Distribution Solutions
- 6.1.2. Service
- 6.1.1. Electrical Solution
- 6.2. Market Analysis, Insights and Forecast - by End User
- 6.2.1. IT & Telecommunication
- 6.2.2. BFSI
- 6.2.3. Government
- 6.2.4. Media & Entertainment
- 6.2.5. Other End Users
- 6.1. Market Analysis, Insights and Forecast - by Power Infrastructure
- 7. South America Hong Kong Data Center Power Market Analysis, Insights and Forecast, 2019-2031
- 7.1. Market Analysis, Insights and Forecast - by Power Infrastructure
- 7.1.1. Electrical Solution
- 7.1.1.1. UPS Systems
- 7.1.1.2. Generators
- 7.1.1.3. Power Distribution Solutions
- 7.1.1.3.1. PDU
- 7.1.1.3.2. Switchgear
- 7.1.1.3.3. Critical Power Distribution
- 7.1.1.3.4. Transfer Switches
- 7.1.1.3.5. Remote Power Panels
- 7.1.1.3.6. Other Power Distribution Solutions
- 7.1.2. Service
- 7.1.1. Electrical Solution
- 7.2. Market Analysis, Insights and Forecast - by End User
- 7.2.1. IT & Telecommunication
- 7.2.2. BFSI
- 7.2.3. Government
- 7.2.4. Media & Entertainment
- 7.2.5. Other End Users
- 7.1. Market Analysis, Insights and Forecast - by Power Infrastructure
- 8. Europe Hong Kong Data Center Power Market Analysis, Insights and Forecast, 2019-2031
- 8.1. Market Analysis, Insights and Forecast - by Power Infrastructure
- 8.1.1. Electrical Solution
- 8.1.1.1. UPS Systems
- 8.1.1.2. Generators
- 8.1.1.3. Power Distribution Solutions
- 8.1.1.3.1. PDU
- 8.1.1.3.2. Switchgear
- 8.1.1.3.3. Critical Power Distribution
- 8.1.1.3.4. Transfer Switches
- 8.1.1.3.5. Remote Power Panels
- 8.1.1.3.6. Other Power Distribution Solutions
- 8.1.2. Service
- 8.1.1. Electrical Solution
- 8.2. Market Analysis, Insights and Forecast - by End User
- 8.2.1. IT & Telecommunication
- 8.2.2. BFSI
- 8.2.3. Government
- 8.2.4. Media & Entertainment
- 8.2.5. Other End Users
- 8.1. Market Analysis, Insights and Forecast - by Power Infrastructure
- 9. Middle East & Africa Hong Kong Data Center Power Market Analysis, Insights and Forecast, 2019-2031
- 9.1. Market Analysis, Insights and Forecast - by Power Infrastructure
- 9.1.1. Electrical Solution
- 9.1.1.1. UPS Systems
- 9.1.1.2. Generators
- 9.1.1.3. Power Distribution Solutions
- 9.1.1.3.1. PDU
- 9.1.1.3.2. Switchgear
- 9.1.1.3.3. Critical Power Distribution
- 9.1.1.3.4. Transfer Switches
- 9.1.1.3.5. Remote Power Panels
- 9.1.1.3.6. Other Power Distribution Solutions
- 9.1.2. Service
- 9.1.1. Electrical Solution
- 9.2. Market Analysis, Insights and Forecast - by End User
- 9.2.1. IT & Telecommunication
- 9.2.2. BFSI
- 9.2.3. Government
- 9.2.4. Media & Entertainment
- 9.2.5. Other End Users
- 9.1. Market Analysis, Insights and Forecast - by Power Infrastructure
- 10. Asia Pacific Hong Kong Data Center Power Market Analysis, Insights and Forecast, 2019-2031
- 10.1. Market Analysis, Insights and Forecast - by Power Infrastructure
- 10.1.1. Electrical Solution
- 10.1.1.1. UPS Systems
- 10.1.1.2. Generators
- 10.1.1.3. Power Distribution Solutions
- 10.1.1.3.1. PDU
- 10.1.1.3.2. Switchgear
- 10.1.1.3.3. Critical Power Distribution
- 10.1.1.3.4. Transfer Switches
- 10.1.1.3.5. Remote Power Panels
- 10.1.1.3.6. Other Power Distribution Solutions
- 10.1.2. Service
- 10.1.1. Electrical Solution
- 10.2. Market Analysis, Insights and Forecast - by End User
- 10.2.1. IT & Telecommunication
- 10.2.2. BFSI
- 10.2.3. Government
- 10.2.4. Media & Entertainment
- 10.2.5. Other End Users
- 10.1. Market Analysis, Insights and Forecast - by Power Infrastructure
- 11. Competitive Analysis
- 11.1. Global Market Share Analysis 2024
- 11.2. Company Profiles
- 11.2.1 ABB Ltd
- 11.2.1.1. Overview
- 11.2.1.2. Products
- 11.2.1.3. SWOT Analysis
- 11.2.1.4. Recent Developments
- 11.2.1.5. Financials (Based on Availability)
- 11.2.2 Rolls-Royce PLC
- 11.2.2.1. Overview
- 11.2.2.2. Products
- 11.2.2.3. SWOT Analysis
- 11.2.2.4. Recent Developments
- 11.2.2.5. Financials (Based on Availability)
- 11.2.3 Legrand Group
- 11.2.3.1. Overview
- 11.2.3.2. Products
- 11.2.3.3. SWOT Analysis
- 11.2.3.4. Recent Developments
- 11.2.3.5. Financials (Based on Availability)
- 11.2.4 Schneider Electric SE
- 11.2.4.1. Overview
- 11.2.4.2. Products
- 11.2.4.3. SWOT Analysis
- 11.2.4.4. Recent Developments
- 11.2.4.5. Financials (Based on Availability)
- 11.2.5 Fujitsu Limited
- 11.2.5.1. Overview
- 11.2.5.2. Products
- 11.2.5.3. SWOT Analysis
- 11.2.5.4. Recent Developments
- 11.2.5.5. Financials (Based on Availability)
- 11.2.6 Caterpillar Inc
- 11.2.6.1. Overview
- 11.2.6.2. Products
- 11.2.6.3. SWOT Analysis
- 11.2.6.4. Recent Developments
- 11.2.6.5. Financials (Based on Availability)
- 11.2.7 Rittal GmbH & Co KG
- 11.2.7.1. Overview
- 11.2.7.2. Products
- 11.2.7.3. SWOT Analysis
- 11.2.7.4. Recent Developments
- 11.2.7.5. Financials (Based on Availability)
- 11.2.8 Cisco Systems Inc *List Not Exhaustive
- 11.2.8.1. Overview
- 11.2.8.2. Products
- 11.2.8.3. SWOT Analysis
- 11.2.8.4. Recent Developments
- 11.2.8.5. Financials (Based on Availability)
- 11.2.9 Cummins Inc
- 11.2.9.1. Overview
- 11.2.9.2. Products
- 11.2.9.3. SWOT Analysis
- 11.2.9.4. Recent Developments
- 11.2.9.5. Financials (Based on Availability)
- 11.2.10 Vertiv Group Corp
- 11.2.10.1. Overview
- 11.2.10.2. Products
- 11.2.10.3. SWOT Analysis
- 11.2.10.4. Recent Developments
- 11.2.10.5. Financials (Based on Availability)
- 11.2.11 Eaton Corporation
- 11.2.11.1. Overview
- 11.2.11.2. Products
- 11.2.11.3. SWOT Analysis
- 11.2.11.4. Recent Developments
- 11.2.11.5. Financials (Based on Availability)
- 11.2.1 ABB Ltd
List of Figures
- Figure 1: Global Hong Kong Data Center Power Market Revenue Breakdown (Million, %) by Region 2024 & 2032
- Figure 2: Hong Kong Hong Kong Data Center Power Market Revenue (Million), by Country 2024 & 2032
- Figure 3: Hong Kong Hong Kong Data Center Power Market Revenue Share (%), by Country 2024 & 2032
- Figure 4: North America Hong Kong Data Center Power Market Revenue (Million), by Power Infrastructure 2024 & 2032
- Figure 5: North America Hong Kong Data Center Power Market Revenue Share (%), by Power Infrastructure 2024 & 2032
- Figure 6: North America Hong Kong Data Center Power Market Revenue (Million), by End User 2024 & 2032
- Figure 7: North America Hong Kong Data Center Power Market Revenue Share (%), by End User 2024 & 2032
- Figure 8: North America Hong Kong Data Center Power Market Revenue (Million), by Country 2024 & 2032
- Figure 9: North America Hong Kong Data Center Power Market Revenue Share (%), by Country 2024 & 2032
- Figure 10: South America Hong Kong Data Center Power Market Revenue (Million), by Power Infrastructure 2024 & 2032
- Figure 11: South America Hong Kong Data Center Power Market Revenue Share (%), by Power Infrastructure 2024 & 2032
- Figure 12: South America Hong Kong Data Center Power Market Revenue (Million), by End User 2024 & 2032
- Figure 13: South America Hong Kong Data Center Power Market Revenue Share (%), by End User 2024 & 2032
- Figure 14: South America Hong Kong Data Center Power Market Revenue (Million), by Country 2024 & 2032
- Figure 15: South America Hong Kong Data Center Power Market Revenue Share (%), by Country 2024 & 2032
- Figure 16: Europe Hong Kong Data Center Power Market Revenue (Million), by Power Infrastructure 2024 & 2032
- Figure 17: Europe Hong Kong Data Center Power Market Revenue Share (%), by Power Infrastructure 2024 & 2032
- Figure 18: Europe Hong Kong Data Center Power Market Revenue (Million), by End User 2024 & 2032
- Figure 19: Europe Hong Kong Data Center Power Market Revenue Share (%), by End User 2024 & 2032
- Figure 20: Europe Hong Kong Data Center Power Market Revenue (Million), by Country 2024 & 2032
- Figure 21: Europe Hong Kong Data Center Power Market Revenue Share (%), by Country 2024 & 2032
- Figure 22: Middle East & Africa Hong Kong Data Center Power Market Revenue (Million), by Power Infrastructure 2024 & 2032
- Figure 23: Middle East & Africa Hong Kong Data Center Power Market Revenue Share (%), by Power Infrastructure 2024 & 2032
- Figure 24: Middle East & Africa Hong Kong Data Center Power Market Revenue (Million), by End User 2024 & 2032
- Figure 25: Middle East & Africa Hong Kong Data Center Power Market Revenue Share (%), by End User 2024 & 2032
- Figure 26: Middle East & Africa Hong Kong Data Center Power Market Revenue (Million), by Country 2024 & 2032
- Figure 27: Middle East & Africa Hong Kong Data Center Power Market Revenue Share (%), by Country 2024 & 2032
- Figure 28: Asia Pacific Hong Kong Data Center Power Market Revenue (Million), by Power Infrastructure 2024 & 2032
- Figure 29: Asia Pacific Hong Kong Data Center Power Market Revenue Share (%), by Power Infrastructure 2024 & 2032
- Figure 30: Asia Pacific Hong Kong Data Center Power Market Revenue (Million), by End User 2024 & 2032
- Figure 31: Asia Pacific Hong Kong Data Center Power Market Revenue Share (%), by End User 2024 & 2032
- Figure 32: Asia Pacific Hong Kong Data Center Power Market Revenue (Million), by Country 2024 & 2032
- Figure 33: Asia Pacific Hong Kong Data Center Power Market Revenue Share (%), by Country 2024 & 2032
List of Tables
- Table 1: Global Hong Kong Data Center Power Market Revenue Million Forecast, by Region 2019 & 2032
- Table 2: Global Hong Kong Data Center Power Market Revenue Million Forecast, by Power Infrastructure 2019 & 2032
- Table 3: Global Hong Kong Data Center Power Market Revenue Million Forecast, by End User 2019 & 2032
- Table 4: Global Hong Kong Data Center Power Market Revenue Million Forecast, by Region 2019 & 2032
- Table 5: Global Hong Kong Data Center Power Market Revenue Million Forecast, by Country 2019 & 2032
- Table 6: Global Hong Kong Data Center Power Market Revenue Million Forecast, by Power Infrastructure 2019 & 2032
- Table 7: Global Hong Kong Data Center Power Market Revenue Million Forecast, by End User 2019 & 2032
- Table 8: Global Hong Kong Data Center Power Market Revenue Million Forecast, by Country 2019 & 2032
- Table 9: United States Hong Kong Data Center Power Market Revenue (Million) Forecast, by Application 2019 & 2032
- Table 10: Canada Hong Kong Data Center Power Market Revenue (Million) Forecast, by Application 2019 & 2032
- Table 11: Mexico Hong Kong Data Center Power Market Revenue (Million) Forecast, by Application 2019 & 2032
- Table 12: Global Hong Kong Data Center Power Market Revenue Million Forecast, by Power Infrastructure 2019 & 2032
- Table 13: Global Hong Kong Data Center Power Market Revenue Million Forecast, by End User 2019 & 2032
- Table 14: Global Hong Kong Data Center Power Market Revenue Million Forecast, by Country 2019 & 2032
- Table 15: Brazil Hong Kong Data Center Power Market Revenue (Million) Forecast, by Application 2019 & 2032
- Table 16: Argentina Hong Kong Data Center Power Market Revenue (Million) Forecast, by Application 2019 & 2032
- Table 17: Rest of South America Hong Kong Data Center Power Market Revenue (Million) Forecast, by Application 2019 & 2032
- Table 18: Global Hong Kong Data Center Power Market Revenue Million Forecast, by Power Infrastructure 2019 & 2032
- Table 19: Global Hong Kong Data Center Power Market Revenue Million Forecast, by End User 2019 & 2032
- Table 20: Global Hong Kong Data Center Power Market Revenue Million Forecast, by Country 2019 & 2032
- Table 21: United Kingdom Hong Kong Data Center Power Market Revenue (Million) Forecast, by Application 2019 & 2032
- Table 22: Germany Hong Kong Data Center Power Market Revenue (Million) Forecast, by Application 2019 & 2032
- Table 23: France Hong Kong Data Center Power Market Revenue (Million) Forecast, by Application 2019 & 2032
- Table 24: Italy Hong Kong Data Center Power Market Revenue (Million) Forecast, by Application 2019 & 2032
- Table 25: Spain Hong Kong Data Center Power Market Revenue (Million) Forecast, by Application 2019 & 2032
- Table 26: Russia Hong Kong Data Center Power Market Revenue (Million) Forecast, by Application 2019 & 2032
- Table 27: Benelux Hong Kong Data Center Power Market Revenue (Million) Forecast, by Application 2019 & 2032
- Table 28: Nordics Hong Kong Data Center Power Market Revenue (Million) Forecast, by Application 2019 & 2032
- Table 29: Rest of Europe Hong Kong Data Center Power Market Revenue (Million) Forecast, by Application 2019 & 2032
- Table 30: Global Hong Kong Data Center Power Market Revenue Million Forecast, by Power Infrastructure 2019 & 2032
- Table 31: Global Hong Kong Data Center Power Market Revenue Million Forecast, by End User 2019 & 2032
- Table 32: Global Hong Kong Data Center Power Market Revenue Million Forecast, by Country 2019 & 2032
- Table 33: Turkey Hong Kong Data Center Power Market Revenue (Million) Forecast, by Application 2019 & 2032
- Table 34: Israel Hong Kong Data Center Power Market Revenue (Million) Forecast, by Application 2019 & 2032
- Table 35: GCC Hong Kong Data Center Power Market Revenue (Million) Forecast, by Application 2019 & 2032
- Table 36: North Africa Hong Kong Data Center Power Market Revenue (Million) Forecast, by Application 2019 & 2032
- Table 37: South Africa Hong Kong Data Center Power Market Revenue (Million) Forecast, by Application 2019 & 2032
- Table 38: Rest of Middle East & Africa Hong Kong Data Center Power Market Revenue (Million) Forecast, by Application 2019 & 2032
- Table 39: Global Hong Kong Data Center Power Market Revenue Million Forecast, by Power Infrastructure 2019 & 2032
- Table 40: Global Hong Kong Data Center Power Market Revenue Million Forecast, by End User 2019 & 2032
- Table 41: Global Hong Kong Data Center Power Market Revenue Million Forecast, by Country 2019 & 2032
- Table 42: China Hong Kong Data Center Power Market Revenue (Million) Forecast, by Application 2019 & 2032
- Table 43: India Hong Kong Data Center Power Market Revenue (Million) Forecast, by Application 2019 & 2032
- Table 44: Japan Hong Kong Data Center Power Market Revenue (Million) Forecast, by Application 2019 & 2032
- Table 45: South Korea Hong Kong Data Center Power Market Revenue (Million) Forecast, by Application 2019 & 2032
- Table 46: ASEAN Hong Kong Data Center Power Market Revenue (Million) Forecast, by Application 2019 & 2032
- Table 47: Oceania Hong Kong Data Center Power Market Revenue (Million) Forecast, by Application 2019 & 2032
- Table 48: Rest of Asia Pacific Hong Kong Data Center Power Market Revenue (Million) Forecast, by Application 2019 & 2032
Frequently Asked Questions
1. What is the projected Compound Annual Growth Rate (CAGR) of the Hong Kong Data Center Power Market?
The projected CAGR is approximately 7.20%.
2. Which companies are prominent players in the Hong Kong Data Center Power Market?
Key companies in the market include ABB Ltd, Rolls-Royce PLC, Legrand Group, Schneider Electric SE, Fujitsu Limited, Caterpillar Inc, Rittal GmbH & Co KG, Cisco Systems Inc *List Not Exhaustive, Cummins Inc, Vertiv Group Corp, Eaton Corporation.
3. What are the main segments of the Hong Kong Data Center Power Market?
The market segments include Power Infrastructure, End User.
4. Can you provide details about the market size?
The market size is estimated to be USD 311.70 Million as of 2022.
5. What are some drivers contributing to market growth?
Rising Adoption of Mega Data Centers and Cloud Computing; Increasing Demand to Reduce Operational Costs.
6. What are the notable trends driving market growth?
IT & Telecommunication Segment to Hold Major Share in the Market.
7. Are there any restraints impacting market growth?
High Cost of Installation and Maintenance.
8. Can you provide examples of recent developments in the market?
January 2024: Caterpillar Inc. partnered with Microsoft and Ballard Power Systems to test the use of large-format hydrogen fuel cells as a reliable and eco-friendly backup power source for multi-megawatt data centers. Hydrogen fuel cells are seen as a possible low-carbon alternative to diesel backup generators, which is expected to drive the growth of DC generators.
9. What pricing options are available for accessing the report?
Pricing options include single-user, multi-user, and enterprise licenses priced at USD 3800, USD 4500, and USD 5800 respectively.
10. Is the market size provided in terms of value or volume?
The market size is provided in terms of value, measured in Million.
11. Are there any specific market keywords associated with the report?
Yes, the market keyword associated with the report is "Hong Kong Data Center Power Market," which aids in identifying and referencing the specific market segment covered.
12. How do I determine which pricing option suits my needs best?
The pricing options vary based on user requirements and access needs. Individual users may opt for single-user licenses, while businesses requiring broader access may choose multi-user or enterprise licenses for cost-effective access to the report.
13. Are there any additional resources or data provided in the Hong Kong Data Center Power Market report?
While the report offers comprehensive insights, it's advisable to review the specific contents or supplementary materials provided to ascertain if additional resources or data are available.
14. How can I stay updated on further developments or reports in the Hong Kong Data Center Power Market?
To stay informed about further developments, trends, and reports in the Hong Kong Data Center Power Market, consider subscribing to industry newsletters, following relevant companies and organizations, or regularly checking reputable industry news sources and publications.
Methodology
Step 1 - Identification of Relevant Samples Size from Population Database


Step 2 - Approaches for Defining Global Market Size (Value, Volume* & Price*)

Note*: In applicable scenarios
Step 3 - Data Sources
Primary Research
- Web Analytics
- Survey Reports
- Research Institute
- Latest Research Reports
- Opinion Leaders
Secondary Research
- Annual Reports
- White Paper
- Latest Press Release
- Industry Association
- Paid Database
- Investor Presentations

Step 4 - Data Triangulation
Involves using different sources of information in order to increase the validity of a study
These sources are likely to be stakeholders in a program - participants, other researchers, program staff, other community members, and so on.
Then we put all data in single framework & apply various statistical tools to find out the dynamic on the market.
During the analysis stage, feedback from the stakeholder groups would be compared to determine areas of agreement as well as areas of divergence
