

Key Insights
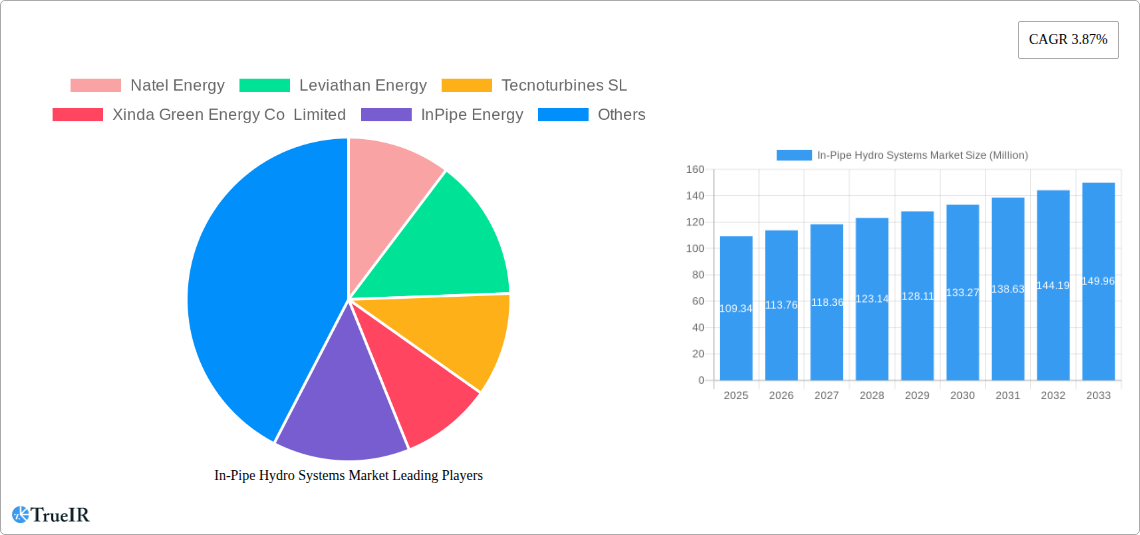
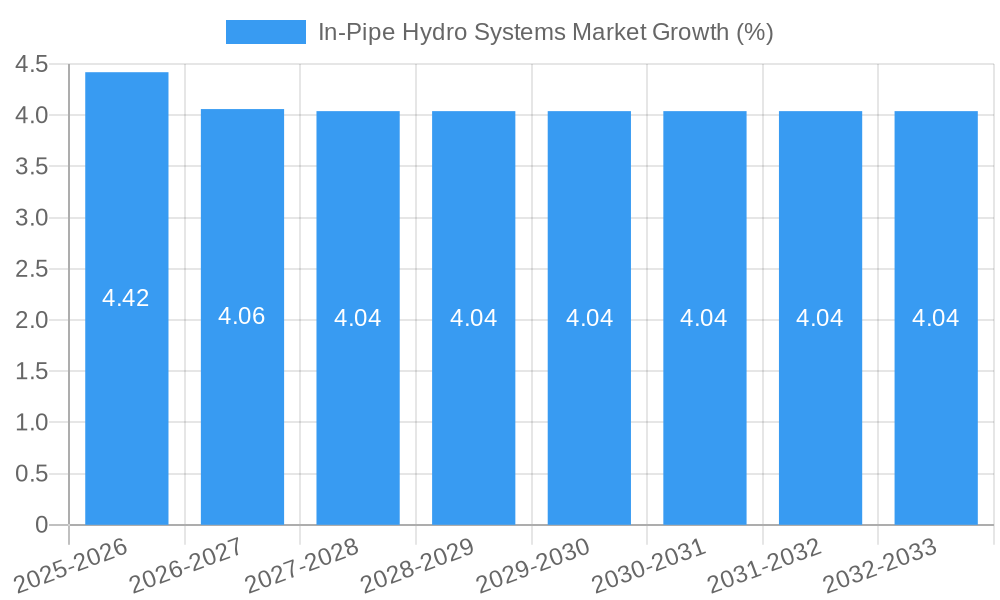
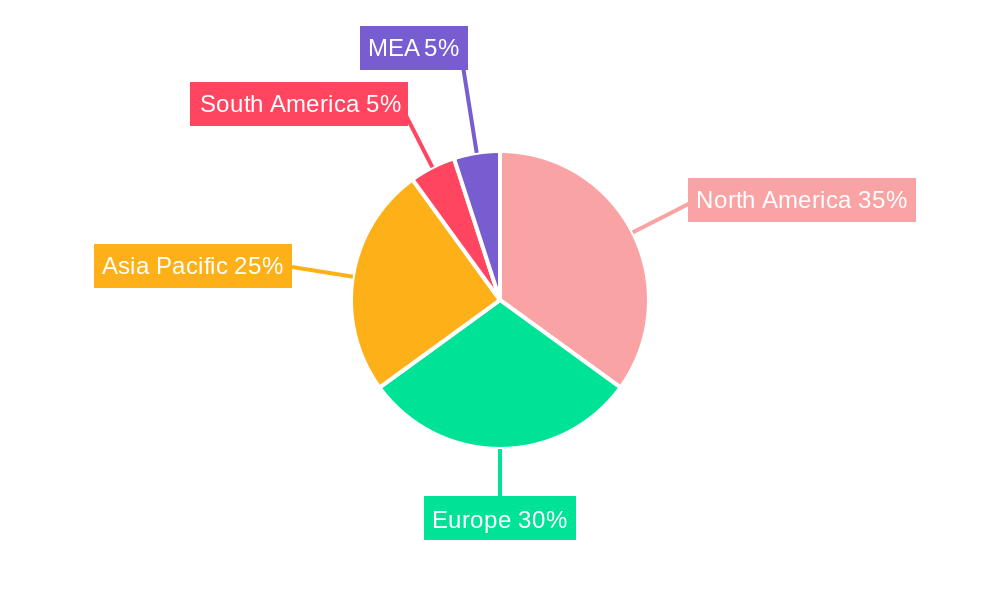
The In-Pipe Hydro Systems market, valued at $109.34 million in 2025, is projected to experience steady growth, driven by increasing demand for sustainable energy solutions and the need for decentralized power generation. The market's Compound Annual Growth Rate (CAGR) of 3.87% from 2025 to 2033 indicates a robust expansion, primarily fueled by the adoption of in-pipe hydro systems in municipal water and wastewater treatment facilities, industrial water systems, and irrigation networks. The increasing focus on reducing carbon emissions and reliance on fossil fuels is a major catalyst, making in-pipe hydro a compelling alternative for environmentally conscious businesses and municipalities. Further growth will be driven by technological advancements leading to increased efficiency and reduced installation costs, making this technology accessible to a broader range of applications. The segmentation by capacity (pico-hydro, micro-hydro, mini-hydro) reflects the adaptability of the technology to various needs and locations. While challenges such as regulatory hurdles and the need for site-specific engineering might constrain market growth in certain regions, the overall positive trend towards sustainable energy and water management positions the in-pipe hydro systems market for significant expansion in the coming years. Companies like Natel Energy, Leviathan Energy, and others are playing a key role in shaping this market through innovation and market penetration. The geographic distribution of the market reflects the diverse global needs for sustainable energy solutions, with North America, Europe, and Asia Pacific expected to dominate, driven by robust infrastructure development and environmental regulations.
The market's growth will likely be influenced by government policies supporting renewable energy initiatives and investments in water infrastructure upgrades. Expansion in developing economies with growing populations and urbanization presents significant growth opportunities, especially in regions with suitable water flow characteristics. Competitive dynamics will likely intensify as new players enter the market and existing companies strive for market share through product differentiation and technological innovation. The long-term outlook for the in-pipe hydro systems market is positive, with substantial potential for growth driven by ongoing technological improvements, a growing awareness of sustainability, and the increasing need for efficient and renewable energy sources. Continued research and development efforts focused on enhancing system efficiency and reducing installation costs will be crucial in unlocking the full market potential.
In-Pipe Hydro Systems Market Report: 2019-2033
This comprehensive report provides a detailed analysis of the In-Pipe Hydro Systems market, covering market size, growth drivers, competitive landscape, and future outlook from 2019 to 2033. The study period encompasses historical data (2019-2024), the base year (2025), and a forecast period (2025-2033), providing a complete understanding of this rapidly evolving sector. This report is invaluable for investors, industry professionals, and anyone seeking to understand the potential of in-pipe hydro systems as a clean energy source.
In-Pipe Hydro Systems Market Structure & Competitive Landscape
The In-Pipe Hydro Systems market is characterized by a moderately concentrated landscape with a few key players driving innovation and market expansion. The market's structure is influenced by several factors, including regulatory frameworks promoting renewable energy, the increasing need for sustainable energy solutions, and technological advancements improving efficiency and scalability. Several key players dominate the market, though the exact concentration ratio is xx% in 2025, indicating room for expansion and new entrants.
- Market Concentration: The Herfindahl-Hirschman Index (HHI) for the market is estimated at xx in 2025, suggesting a moderately concentrated market.
- Innovation Drivers: Continuous R&D efforts by leading companies are resulting in improved turbine designs, enhanced energy conversion efficiency, and reduced installation costs. The development of smart grids and advanced energy storage solutions are further boosting market growth.
- Regulatory Impacts: Government incentives and subsidies aimed at promoting renewable energy are creating a favorable regulatory environment, attracting investment and driving market expansion. Stringent environmental regulations are also pushing for sustainable energy solutions.
- Product Substitutes: Traditional hydroelectric power plants and other renewable energy sources (solar, wind) represent some level of competition; however, in-pipe hydro's unique application in existing infrastructure provides a distinct advantage.
- End-User Segmentation: The market is segmented by application (Municipal Water or Wastewater Systems, Industrial Water Systems, Other Applications), and capacity (Pico-hydro, Micro-hydro, Mini-hydro). The Municipal Water or Wastewater Systems segment currently holds the largest market share.
- M&A Trends: The past five years have seen xx mergers and acquisitions within the In-Pipe Hydro Systems market, indicating consolidation and strategic expansion by major players. The total deal value for these transactions reached approximately $xx Million.
In-Pipe Hydro Systems Market Trends & Opportunities
The global In-Pipe Hydro Systems market is experiencing significant growth, driven by rising energy demands, stringent environmental regulations, and increasing awareness of climate change. The market size is projected to reach $xx Million by 2033, exhibiting a CAGR of xx% during the forecast period (2025-2033). Technological advancements, like the HydroXS by InPipe Energy, are increasing efficiency and reducing installation costs. The increasing adoption of smart water management systems is further boosting market penetration. A shift towards decentralized energy generation and the incorporation of in-pipe hydro systems into smart cities are key trends. This growth is supported by increasing consumer preferences for sustainable and environmentally friendly energy solutions.
Dominant Markets & Segments in In-Pipe Hydro Systems Market
The North American region currently holds the largest market share within the In-Pipe Hydro Systems market, driven by substantial investments in infrastructure upgrades and supportive government policies. The Municipal Water or Wastewater Systems segment dominates the application segment due to its extensive existing pipeline infrastructure and readily available water flow. Within capacity, the micro-hydro segment (Up To 100kW) showcases the fastest growth rate due to the increasing feasibility and cost-effectiveness of these systems.
- Key Growth Drivers:
- Expanding Infrastructure: Investments in upgrading water and wastewater infrastructure present significant opportunities for in-pipe hydro system deployments.
- Favorable Government Policies: Incentives, subsidies, and regulatory frameworks promoting renewable energy are significantly accelerating market adoption.
- Technological Advancements: Innovations in turbine design, energy conversion efficiency, and system integration are enhancing the attractiveness of in-pipe hydro systems.
- Rising Energy Costs: The increasing cost of traditional energy sources makes in-pipe hydro a more economically viable alternative.
The market dominance of North America is attributed to factors such as proactive government support for renewable energy initiatives, substantial investments in water infrastructure modernization, and the presence of key market players. Europe follows closely, showcasing a robust market driven by its strong focus on sustainable development and stringent environmental regulations.
In-Pipe Hydro Systems Market Product Analysis
Recent innovations in In-Pipe Hydro Systems are focused on enhancing energy conversion efficiency, reducing system costs, and improving overall reliability. The HydroXS system, for example, demonstrates advancements in pressure management and energy generation within a single unit. These improvements enable seamless integration into existing water infrastructure, thus minimizing disruption and maximizing market fit. The competitive landscape is characterized by continuous product development, leading to improved system performance, enhanced durability, and reduced operational costs.
Key Drivers, Barriers & Challenges in In-Pipe Hydro Systems Market
Key Drivers:
- Technological advancements in turbine design and efficiency.
- Growing demand for renewable energy sources to combat climate change.
- Government incentives and subsidies promoting renewable energy adoption.
- Increasing energy costs and the need for cost-effective solutions.
Challenges & Restraints:
- High initial capital investment costs can deter some potential adopters.
- The need for site-specific engineering and installation can present implementation hurdles.
- Regulatory complexities and permitting processes can sometimes slow down project deployment. This accounts for a xx% delay in project completion in some regions.
Growth Drivers in the In-Pipe Hydro Systems Market
The market’s growth is primarily driven by a confluence of factors, including technological advancements resulting in higher efficiency and lower costs, increasing government support for renewable energy through subsidies and favorable regulations, and a rising awareness of climate change amongst consumers and businesses. This combination creates a compelling economic and environmental case for in-pipe hydro systems.
Challenges Impacting In-Pipe Hydro Systems Market Growth
Despite significant potential, challenges remain for market growth. High initial investment costs can act as a barrier to entry for smaller municipalities or businesses. Furthermore, the site-specific nature of installations requires detailed engineering and planning, potentially increasing project timelines and costs. Regulatory hurdles and bureaucratic processes can also create delays, impacting overall market penetration.
Key Players Shaping the In-Pipe Hydro Systems Market
- Natel Energy
- Leviathan Energy
- Tecnoturbines SL
- Xinda Green Energy Co Limited
- InPipe Energy
- HS Dynamic Energy Co Ltd
- GS-Hydro
- Rentricity Inc
- Lucid Energy Inc
Significant In-Pipe Hydro Systems Market Industry Milestones
- December 2023: The East Bay Municipal Utility District (EBMUD) partnered with InPipe Energy, marking the first installation of InPipe technology in California. This signifies a significant step towards wider market adoption in the US.
- July 2022: InPipe Energy launched the HydroXS, a new generation of micro-hydro energy recovery technology, showcasing continuous innovation within the sector and enhancing the product offerings.
Future Outlook for In-Pipe Hydro Systems Market
The future of the In-Pipe Hydro Systems market appears bright, driven by sustained technological advancements, increasing government support, and growing environmental concerns. Strategic partnerships, focused R&D efforts, and expansion into new geographical markets are expected to contribute to significant market expansion over the forecast period. The market potential is substantial, particularly in regions with robust water infrastructure and a strong commitment to renewable energy targets.
In-Pipe Hydro Systems Market Segmentation
-
1. Application
- 1.1. Municipal Water or Wastewater Systems
- 1.2. Industrial Water Systems
- 1.3. Other Ap
-
2. Capacity
- 2.1. Pico-hydro (Up To 5kW)
- 2.2. Micro-hydro (Up To 100kW)
- 2.3. Mini-hydro (100kW and Above)
In-Pipe Hydro Systems Market Segmentation By Geography
-
1. North America
- 1.1. United States
- 1.2. Canada
- 1.3. Rest of North America
-
2. Asia Pacific
- 2.1. China
- 2.2. Japan
- 2.3. South Korea
- 2.4. India
- 2.5. Malaysia
- 2.6. Thailand
- 2.7. Indonesia
- 2.8. Vietnam
- 2.9. Rest of Asia Pacific
-
3. Europe
- 3.1. United Kingdom
- 3.2. Germany
- 3.3. France
- 3.4. Italy
- 3.5. Spain
- 3.6. Nordic Countries
- 3.7. Turkey
- 3.8. Russia
- 3.9. Rest of Europe
-
4. South America
- 4.1. Brazil
- 4.2. Argentina
- 4.3. Colombia
- 4.4. Rest of South America
-
5. Middle East and Africa
- 5.1. Saudi Arabia
- 5.2. United Arab Emirates
- 5.3. Nigeria
- 5.4. Qatar
- 5.5. Egypt
- 5.6. Rest of Middle East and Africa
In-Pipe Hydro Systems Market REPORT HIGHLIGHTS
| Aspects | Details |
|---|---|
| Study Period | 2019-2033 |
| Base Year | 2024 |
| Estimated Year | 2025 |
| Forecast Period | 2025-2033 |
| Historical Period | 2019-2024 |
| Growth Rate | CAGR of 3.87% from 2019-2033 |
| Segmentation |
|
Table of Contents
- 1. Introduction
- 1.1. Research Scope
- 1.2. Market Segmentation
- 1.3. Research Methodology
- 1.4. Definitions and Assumptions
- 2. Executive Summary
- 2.1. Introduction
- 3. Market Dynamics
- 3.1. Introduction
- 3.2. Market Drivers
- 3.2.1. Increased Focus on Renewable Power Generation4.; Rising Need for Efficient Power Generation
- 3.3. Market Restrains
- 3.3.1. High Initial Capital Investment
- 3.4. Market Trends
- 3.4.1. Industrial Water Systems to Witness Significant Demand
- 4. Market Factor Analysis
- 4.1. Porters Five Forces
- 4.2. Supply/Value Chain
- 4.3. PESTEL analysis
- 4.4. Market Entropy
- 4.5. Patent/Trademark Analysis
- 5. Global In-Pipe Hydro Systems Market Analysis, Insights and Forecast, 2019-2031
- 5.1. Market Analysis, Insights and Forecast - by Application
- 5.1.1. Municipal Water or Wastewater Systems
- 5.1.2. Industrial Water Systems
- 5.1.3. Other Ap
- 5.2. Market Analysis, Insights and Forecast - by Capacity
- 5.2.1. Pico-hydro (Up To 5kW)
- 5.2.2. Micro-hydro (Up To 100kW)
- 5.2.3. Mini-hydro (100kW and Above)
- 5.3. Market Analysis, Insights and Forecast - by Region
- 5.3.1. North America
- 5.3.2. Asia Pacific
- 5.3.3. Europe
- 5.3.4. South America
- 5.3.5. Middle East and Africa
- 5.1. Market Analysis, Insights and Forecast - by Application
- 6. North America In-Pipe Hydro Systems Market Analysis, Insights and Forecast, 2019-2031
- 6.1. Market Analysis, Insights and Forecast - by Application
- 6.1.1. Municipal Water or Wastewater Systems
- 6.1.2. Industrial Water Systems
- 6.1.3. Other Ap
- 6.2. Market Analysis, Insights and Forecast - by Capacity
- 6.2.1. Pico-hydro (Up To 5kW)
- 6.2.2. Micro-hydro (Up To 100kW)
- 6.2.3. Mini-hydro (100kW and Above)
- 6.1. Market Analysis, Insights and Forecast - by Application
- 7. Asia Pacific In-Pipe Hydro Systems Market Analysis, Insights and Forecast, 2019-2031
- 7.1. Market Analysis, Insights and Forecast - by Application
- 7.1.1. Municipal Water or Wastewater Systems
- 7.1.2. Industrial Water Systems
- 7.1.3. Other Ap
- 7.2. Market Analysis, Insights and Forecast - by Capacity
- 7.2.1. Pico-hydro (Up To 5kW)
- 7.2.2. Micro-hydro (Up To 100kW)
- 7.2.3. Mini-hydro (100kW and Above)
- 7.1. Market Analysis, Insights and Forecast - by Application
- 8. Europe In-Pipe Hydro Systems Market Analysis, Insights and Forecast, 2019-2031
- 8.1. Market Analysis, Insights and Forecast - by Application
- 8.1.1. Municipal Water or Wastewater Systems
- 8.1.2. Industrial Water Systems
- 8.1.3. Other Ap
- 8.2. Market Analysis, Insights and Forecast - by Capacity
- 8.2.1. Pico-hydro (Up To 5kW)
- 8.2.2. Micro-hydro (Up To 100kW)
- 8.2.3. Mini-hydro (100kW and Above)
- 8.1. Market Analysis, Insights and Forecast - by Application
- 9. South America In-Pipe Hydro Systems Market Analysis, Insights and Forecast, 2019-2031
- 9.1. Market Analysis, Insights and Forecast - by Application
- 9.1.1. Municipal Water or Wastewater Systems
- 9.1.2. Industrial Water Systems
- 9.1.3. Other Ap
- 9.2. Market Analysis, Insights and Forecast - by Capacity
- 9.2.1. Pico-hydro (Up To 5kW)
- 9.2.2. Micro-hydro (Up To 100kW)
- 9.2.3. Mini-hydro (100kW and Above)
- 9.1. Market Analysis, Insights and Forecast - by Application
- 10. Middle East and Africa In-Pipe Hydro Systems Market Analysis, Insights and Forecast, 2019-2031
- 10.1. Market Analysis, Insights and Forecast - by Application
- 10.1.1. Municipal Water or Wastewater Systems
- 10.1.2. Industrial Water Systems
- 10.1.3. Other Ap
- 10.2. Market Analysis, Insights and Forecast - by Capacity
- 10.2.1. Pico-hydro (Up To 5kW)
- 10.2.2. Micro-hydro (Up To 100kW)
- 10.2.3. Mini-hydro (100kW and Above)
- 10.1. Market Analysis, Insights and Forecast - by Application
- 11. North America In-Pipe Hydro Systems Market Analysis, Insights and Forecast, 2019-2031
- 11.1. Market Analysis, Insights and Forecast - By Country/Sub-region
- 11.1.1 United States
- 11.1.2 Canada
- 11.1.3 Mexico
- 12. Europe In-Pipe Hydro Systems Market Analysis, Insights and Forecast, 2019-2031
- 12.1. Market Analysis, Insights and Forecast - By Country/Sub-region
- 12.1.1 Germany
- 12.1.2 United Kingdom
- 12.1.3 France
- 12.1.4 Spain
- 12.1.5 Italy
- 12.1.6 Spain
- 12.1.7 Belgium
- 12.1.8 Netherland
- 12.1.9 Nordics
- 12.1.10 Rest of Europe
- 13. Asia Pacific In-Pipe Hydro Systems Market Analysis, Insights and Forecast, 2019-2031
- 13.1. Market Analysis, Insights and Forecast - By Country/Sub-region
- 13.1.1 China
- 13.1.2 Japan
- 13.1.3 India
- 13.1.4 South Korea
- 13.1.5 Southeast Asia
- 13.1.6 Australia
- 13.1.7 Indonesia
- 13.1.8 Phillipes
- 13.1.9 Singapore
- 13.1.10 Thailandc
- 13.1.11 Rest of Asia Pacific
- 14. South America In-Pipe Hydro Systems Market Analysis, Insights and Forecast, 2019-2031
- 14.1. Market Analysis, Insights and Forecast - By Country/Sub-region
- 14.1.1 Brazil
- 14.1.2 Argentina
- 14.1.3 Peru
- 14.1.4 Chile
- 14.1.5 Colombia
- 14.1.6 Ecuador
- 14.1.7 Venezuela
- 14.1.8 Rest of South America
- 15. MEA In-Pipe Hydro Systems Market Analysis, Insights and Forecast, 2019-2031
- 15.1. Market Analysis, Insights and Forecast - By Country/Sub-region
- 15.1.1 United Arab Emirates
- 15.1.2 Saudi Arabia
- 15.1.3 South Africa
- 15.1.4 Rest of Middle East and Africa
- 16. Competitive Analysis
- 16.1. Global Market Share Analysis 2024
- 16.2. Company Profiles
- 16.2.1 Natel Energy
- 16.2.1.1. Overview
- 16.2.1.2. Products
- 16.2.1.3. SWOT Analysis
- 16.2.1.4. Recent Developments
- 16.2.1.5. Financials (Based on Availability)
- 16.2.2 Leviathan Energy
- 16.2.2.1. Overview
- 16.2.2.2. Products
- 16.2.2.3. SWOT Analysis
- 16.2.2.4. Recent Developments
- 16.2.2.5. Financials (Based on Availability)
- 16.2.3 Tecnoturbines SL
- 16.2.3.1. Overview
- 16.2.3.2. Products
- 16.2.3.3. SWOT Analysis
- 16.2.3.4. Recent Developments
- 16.2.3.5. Financials (Based on Availability)
- 16.2.4 Xinda Green Energy Co Limited
- 16.2.4.1. Overview
- 16.2.4.2. Products
- 16.2.4.3. SWOT Analysis
- 16.2.4.4. Recent Developments
- 16.2.4.5. Financials (Based on Availability)
- 16.2.5 InPipe Energy
- 16.2.5.1. Overview
- 16.2.5.2. Products
- 16.2.5.3. SWOT Analysis
- 16.2.5.4. Recent Developments
- 16.2.5.5. Financials (Based on Availability)
- 16.2.6 HS Dynamic Energy Co Ltd
- 16.2.6.1. Overview
- 16.2.6.2. Products
- 16.2.6.3. SWOT Analysis
- 16.2.6.4. Recent Developments
- 16.2.6.5. Financials (Based on Availability)
- 16.2.7 GS-Hydro
- 16.2.7.1. Overview
- 16.2.7.2. Products
- 16.2.7.3. SWOT Analysis
- 16.2.7.4. Recent Developments
- 16.2.7.5. Financials (Based on Availability)
- 16.2.8 Rentricity Inc
- 16.2.8.1. Overview
- 16.2.8.2. Products
- 16.2.8.3. SWOT Analysis
- 16.2.8.4. Recent Developments
- 16.2.8.5. Financials (Based on Availability)
- 16.2.9 Lucid Energy Inc
- 16.2.9.1. Overview
- 16.2.9.2. Products
- 16.2.9.3. SWOT Analysis
- 16.2.9.4. Recent Developments
- 16.2.9.5. Financials (Based on Availability)
- 16.2.1 Natel Energy
List of Figures
- Figure 1: Global In-Pipe Hydro Systems Market Revenue Breakdown (Million, %) by Region 2024 & 2032
- Figure 2: North America In-Pipe Hydro Systems Market Revenue (Million), by Country 2024 & 2032
- Figure 3: North America In-Pipe Hydro Systems Market Revenue Share (%), by Country 2024 & 2032
- Figure 4: Europe In-Pipe Hydro Systems Market Revenue (Million), by Country 2024 & 2032
- Figure 5: Europe In-Pipe Hydro Systems Market Revenue Share (%), by Country 2024 & 2032
- Figure 6: Asia Pacific In-Pipe Hydro Systems Market Revenue (Million), by Country 2024 & 2032
- Figure 7: Asia Pacific In-Pipe Hydro Systems Market Revenue Share (%), by Country 2024 & 2032
- Figure 8: South America In-Pipe Hydro Systems Market Revenue (Million), by Country 2024 & 2032
- Figure 9: South America In-Pipe Hydro Systems Market Revenue Share (%), by Country 2024 & 2032
- Figure 10: MEA In-Pipe Hydro Systems Market Revenue (Million), by Country 2024 & 2032
- Figure 11: MEA In-Pipe Hydro Systems Market Revenue Share (%), by Country 2024 & 2032
- Figure 12: North America In-Pipe Hydro Systems Market Revenue (Million), by Application 2024 & 2032
- Figure 13: North America In-Pipe Hydro Systems Market Revenue Share (%), by Application 2024 & 2032
- Figure 14: North America In-Pipe Hydro Systems Market Revenue (Million), by Capacity 2024 & 2032
- Figure 15: North America In-Pipe Hydro Systems Market Revenue Share (%), by Capacity 2024 & 2032
- Figure 16: North America In-Pipe Hydro Systems Market Revenue (Million), by Country 2024 & 2032
- Figure 17: North America In-Pipe Hydro Systems Market Revenue Share (%), by Country 2024 & 2032
- Figure 18: Asia Pacific In-Pipe Hydro Systems Market Revenue (Million), by Application 2024 & 2032
- Figure 19: Asia Pacific In-Pipe Hydro Systems Market Revenue Share (%), by Application 2024 & 2032
- Figure 20: Asia Pacific In-Pipe Hydro Systems Market Revenue (Million), by Capacity 2024 & 2032
- Figure 21: Asia Pacific In-Pipe Hydro Systems Market Revenue Share (%), by Capacity 2024 & 2032
- Figure 22: Asia Pacific In-Pipe Hydro Systems Market Revenue (Million), by Country 2024 & 2032
- Figure 23: Asia Pacific In-Pipe Hydro Systems Market Revenue Share (%), by Country 2024 & 2032
- Figure 24: Europe In-Pipe Hydro Systems Market Revenue (Million), by Application 2024 & 2032
- Figure 25: Europe In-Pipe Hydro Systems Market Revenue Share (%), by Application 2024 & 2032
- Figure 26: Europe In-Pipe Hydro Systems Market Revenue (Million), by Capacity 2024 & 2032
- Figure 27: Europe In-Pipe Hydro Systems Market Revenue Share (%), by Capacity 2024 & 2032
- Figure 28: Europe In-Pipe Hydro Systems Market Revenue (Million), by Country 2024 & 2032
- Figure 29: Europe In-Pipe Hydro Systems Market Revenue Share (%), by Country 2024 & 2032
- Figure 30: South America In-Pipe Hydro Systems Market Revenue (Million), by Application 2024 & 2032
- Figure 31: South America In-Pipe Hydro Systems Market Revenue Share (%), by Application 2024 & 2032
- Figure 32: South America In-Pipe Hydro Systems Market Revenue (Million), by Capacity 2024 & 2032
- Figure 33: South America In-Pipe Hydro Systems Market Revenue Share (%), by Capacity 2024 & 2032
- Figure 34: South America In-Pipe Hydro Systems Market Revenue (Million), by Country 2024 & 2032
- Figure 35: South America In-Pipe Hydro Systems Market Revenue Share (%), by Country 2024 & 2032
- Figure 36: Middle East and Africa In-Pipe Hydro Systems Market Revenue (Million), by Application 2024 & 2032
- Figure 37: Middle East and Africa In-Pipe Hydro Systems Market Revenue Share (%), by Application 2024 & 2032
- Figure 38: Middle East and Africa In-Pipe Hydro Systems Market Revenue (Million), by Capacity 2024 & 2032
- Figure 39: Middle East and Africa In-Pipe Hydro Systems Market Revenue Share (%), by Capacity 2024 & 2032
- Figure 40: Middle East and Africa In-Pipe Hydro Systems Market Revenue (Million), by Country 2024 & 2032
- Figure 41: Middle East and Africa In-Pipe Hydro Systems Market Revenue Share (%), by Country 2024 & 2032
List of Tables
- Table 1: Global In-Pipe Hydro Systems Market Revenue Million Forecast, by Region 2019 & 2032
- Table 2: Global In-Pipe Hydro Systems Market Revenue Million Forecast, by Application 2019 & 2032
- Table 3: Global In-Pipe Hydro Systems Market Revenue Million Forecast, by Capacity 2019 & 2032
- Table 4: Global In-Pipe Hydro Systems Market Revenue Million Forecast, by Region 2019 & 2032
- Table 5: Global In-Pipe Hydro Systems Market Revenue Million Forecast, by Country 2019 & 2032
- Table 6: United States In-Pipe Hydro Systems Market Revenue (Million) Forecast, by Application 2019 & 2032
- Table 7: Canada In-Pipe Hydro Systems Market Revenue (Million) Forecast, by Application 2019 & 2032
- Table 8: Mexico In-Pipe Hydro Systems Market Revenue (Million) Forecast, by Application 2019 & 2032
- Table 9: Global In-Pipe Hydro Systems Market Revenue Million Forecast, by Country 2019 & 2032
- Table 10: Germany In-Pipe Hydro Systems Market Revenue (Million) Forecast, by Application 2019 & 2032
- Table 11: United Kingdom In-Pipe Hydro Systems Market Revenue (Million) Forecast, by Application 2019 & 2032
- Table 12: France In-Pipe Hydro Systems Market Revenue (Million) Forecast, by Application 2019 & 2032
- Table 13: Spain In-Pipe Hydro Systems Market Revenue (Million) Forecast, by Application 2019 & 2032
- Table 14: Italy In-Pipe Hydro Systems Market Revenue (Million) Forecast, by Application 2019 & 2032
- Table 15: Spain In-Pipe Hydro Systems Market Revenue (Million) Forecast, by Application 2019 & 2032
- Table 16: Belgium In-Pipe Hydro Systems Market Revenue (Million) Forecast, by Application 2019 & 2032
- Table 17: Netherland In-Pipe Hydro Systems Market Revenue (Million) Forecast, by Application 2019 & 2032
- Table 18: Nordics In-Pipe Hydro Systems Market Revenue (Million) Forecast, by Application 2019 & 2032
- Table 19: Rest of Europe In-Pipe Hydro Systems Market Revenue (Million) Forecast, by Application 2019 & 2032
- Table 20: Global In-Pipe Hydro Systems Market Revenue Million Forecast, by Country 2019 & 2032
- Table 21: China In-Pipe Hydro Systems Market Revenue (Million) Forecast, by Application 2019 & 2032
- Table 22: Japan In-Pipe Hydro Systems Market Revenue (Million) Forecast, by Application 2019 & 2032
- Table 23: India In-Pipe Hydro Systems Market Revenue (Million) Forecast, by Application 2019 & 2032
- Table 24: South Korea In-Pipe Hydro Systems Market Revenue (Million) Forecast, by Application 2019 & 2032
- Table 25: Southeast Asia In-Pipe Hydro Systems Market Revenue (Million) Forecast, by Application 2019 & 2032
- Table 26: Australia In-Pipe Hydro Systems Market Revenue (Million) Forecast, by Application 2019 & 2032
- Table 27: Indonesia In-Pipe Hydro Systems Market Revenue (Million) Forecast, by Application 2019 & 2032
- Table 28: Phillipes In-Pipe Hydro Systems Market Revenue (Million) Forecast, by Application 2019 & 2032
- Table 29: Singapore In-Pipe Hydro Systems Market Revenue (Million) Forecast, by Application 2019 & 2032
- Table 30: Thailandc In-Pipe Hydro Systems Market Revenue (Million) Forecast, by Application 2019 & 2032
- Table 31: Rest of Asia Pacific In-Pipe Hydro Systems Market Revenue (Million) Forecast, by Application 2019 & 2032
- Table 32: Global In-Pipe Hydro Systems Market Revenue Million Forecast, by Country 2019 & 2032
- Table 33: Brazil In-Pipe Hydro Systems Market Revenue (Million) Forecast, by Application 2019 & 2032
- Table 34: Argentina In-Pipe Hydro Systems Market Revenue (Million) Forecast, by Application 2019 & 2032
- Table 35: Peru In-Pipe Hydro Systems Market Revenue (Million) Forecast, by Application 2019 & 2032
- Table 36: Chile In-Pipe Hydro Systems Market Revenue (Million) Forecast, by Application 2019 & 2032
- Table 37: Colombia In-Pipe Hydro Systems Market Revenue (Million) Forecast, by Application 2019 & 2032
- Table 38: Ecuador In-Pipe Hydro Systems Market Revenue (Million) Forecast, by Application 2019 & 2032
- Table 39: Venezuela In-Pipe Hydro Systems Market Revenue (Million) Forecast, by Application 2019 & 2032
- Table 40: Rest of South America In-Pipe Hydro Systems Market Revenue (Million) Forecast, by Application 2019 & 2032
- Table 41: Global In-Pipe Hydro Systems Market Revenue Million Forecast, by Country 2019 & 2032
- Table 42: United Arab Emirates In-Pipe Hydro Systems Market Revenue (Million) Forecast, by Application 2019 & 2032
- Table 43: Saudi Arabia In-Pipe Hydro Systems Market Revenue (Million) Forecast, by Application 2019 & 2032
- Table 44: South Africa In-Pipe Hydro Systems Market Revenue (Million) Forecast, by Application 2019 & 2032
- Table 45: Rest of Middle East and Africa In-Pipe Hydro Systems Market Revenue (Million) Forecast, by Application 2019 & 2032
- Table 46: Global In-Pipe Hydro Systems Market Revenue Million Forecast, by Application 2019 & 2032
- Table 47: Global In-Pipe Hydro Systems Market Revenue Million Forecast, by Capacity 2019 & 2032
- Table 48: Global In-Pipe Hydro Systems Market Revenue Million Forecast, by Country 2019 & 2032
- Table 49: United States In-Pipe Hydro Systems Market Revenue (Million) Forecast, by Application 2019 & 2032
- Table 50: Canada In-Pipe Hydro Systems Market Revenue (Million) Forecast, by Application 2019 & 2032
- Table 51: Rest of North America In-Pipe Hydro Systems Market Revenue (Million) Forecast, by Application 2019 & 2032
- Table 52: Global In-Pipe Hydro Systems Market Revenue Million Forecast, by Application 2019 & 2032
- Table 53: Global In-Pipe Hydro Systems Market Revenue Million Forecast, by Capacity 2019 & 2032
- Table 54: Global In-Pipe Hydro Systems Market Revenue Million Forecast, by Country 2019 & 2032
- Table 55: China In-Pipe Hydro Systems Market Revenue (Million) Forecast, by Application 2019 & 2032
- Table 56: Japan In-Pipe Hydro Systems Market Revenue (Million) Forecast, by Application 2019 & 2032
- Table 57: South Korea In-Pipe Hydro Systems Market Revenue (Million) Forecast, by Application 2019 & 2032
- Table 58: India In-Pipe Hydro Systems Market Revenue (Million) Forecast, by Application 2019 & 2032
- Table 59: Malaysia In-Pipe Hydro Systems Market Revenue (Million) Forecast, by Application 2019 & 2032
- Table 60: Thailand In-Pipe Hydro Systems Market Revenue (Million) Forecast, by Application 2019 & 2032
- Table 61: Indonesia In-Pipe Hydro Systems Market Revenue (Million) Forecast, by Application 2019 & 2032
- Table 62: Vietnam In-Pipe Hydro Systems Market Revenue (Million) Forecast, by Application 2019 & 2032
- Table 63: Rest of Asia Pacific In-Pipe Hydro Systems Market Revenue (Million) Forecast, by Application 2019 & 2032
- Table 64: Global In-Pipe Hydro Systems Market Revenue Million Forecast, by Application 2019 & 2032
- Table 65: Global In-Pipe Hydro Systems Market Revenue Million Forecast, by Capacity 2019 & 2032
- Table 66: Global In-Pipe Hydro Systems Market Revenue Million Forecast, by Country 2019 & 2032
- Table 67: United Kingdom In-Pipe Hydro Systems Market Revenue (Million) Forecast, by Application 2019 & 2032
- Table 68: Germany In-Pipe Hydro Systems Market Revenue (Million) Forecast, by Application 2019 & 2032
- Table 69: France In-Pipe Hydro Systems Market Revenue (Million) Forecast, by Application 2019 & 2032
- Table 70: Italy In-Pipe Hydro Systems Market Revenue (Million) Forecast, by Application 2019 & 2032
- Table 71: Spain In-Pipe Hydro Systems Market Revenue (Million) Forecast, by Application 2019 & 2032
- Table 72: Nordic Countries In-Pipe Hydro Systems Market Revenue (Million) Forecast, by Application 2019 & 2032
- Table 73: Turkey In-Pipe Hydro Systems Market Revenue (Million) Forecast, by Application 2019 & 2032
- Table 74: Russia In-Pipe Hydro Systems Market Revenue (Million) Forecast, by Application 2019 & 2032
- Table 75: Rest of Europe In-Pipe Hydro Systems Market Revenue (Million) Forecast, by Application 2019 & 2032
- Table 76: Global In-Pipe Hydro Systems Market Revenue Million Forecast, by Application 2019 & 2032
- Table 77: Global In-Pipe Hydro Systems Market Revenue Million Forecast, by Capacity 2019 & 2032
- Table 78: Global In-Pipe Hydro Systems Market Revenue Million Forecast, by Country 2019 & 2032
- Table 79: Brazil In-Pipe Hydro Systems Market Revenue (Million) Forecast, by Application 2019 & 2032
- Table 80: Argentina In-Pipe Hydro Systems Market Revenue (Million) Forecast, by Application 2019 & 2032
- Table 81: Colombia In-Pipe Hydro Systems Market Revenue (Million) Forecast, by Application 2019 & 2032
- Table 82: Rest of South America In-Pipe Hydro Systems Market Revenue (Million) Forecast, by Application 2019 & 2032
- Table 83: Global In-Pipe Hydro Systems Market Revenue Million Forecast, by Application 2019 & 2032
- Table 84: Global In-Pipe Hydro Systems Market Revenue Million Forecast, by Capacity 2019 & 2032
- Table 85: Global In-Pipe Hydro Systems Market Revenue Million Forecast, by Country 2019 & 2032
- Table 86: Saudi Arabia In-Pipe Hydro Systems Market Revenue (Million) Forecast, by Application 2019 & 2032
- Table 87: United Arab Emirates In-Pipe Hydro Systems Market Revenue (Million) Forecast, by Application 2019 & 2032
- Table 88: Nigeria In-Pipe Hydro Systems Market Revenue (Million) Forecast, by Application 2019 & 2032
- Table 89: Qatar In-Pipe Hydro Systems Market Revenue (Million) Forecast, by Application 2019 & 2032
- Table 90: Egypt In-Pipe Hydro Systems Market Revenue (Million) Forecast, by Application 2019 & 2032
- Table 91: Rest of Middle East and Africa In-Pipe Hydro Systems Market Revenue (Million) Forecast, by Application 2019 & 2032
Frequently Asked Questions
1. What is the projected Compound Annual Growth Rate (CAGR) of the In-Pipe Hydro Systems Market?
The projected CAGR is approximately 3.87%.
2. Which companies are prominent players in the In-Pipe Hydro Systems Market?
Key companies in the market include Natel Energy, Leviathan Energy, Tecnoturbines SL, Xinda Green Energy Co Limited, InPipe Energy, HS Dynamic Energy Co Ltd, GS-Hydro, Rentricity Inc, Lucid Energy Inc.
3. What are the main segments of the In-Pipe Hydro Systems Market?
The market segments include Application, Capacity.
4. Can you provide details about the market size?
The market size is estimated to be USD 109.34 Million as of 2022.
5. What are some drivers contributing to market growth?
Increased Focus on Renewable Power Generation4.; Rising Need for Efficient Power Generation.
6. What are the notable trends driving market growth?
Industrial Water Systems to Witness Significant Demand.
7. Are there any restraints impacting market growth?
High Initial Capital Investment.
8. Can you provide examples of recent developments in the market?
December 2023: The East Bay Municipal Utility District (EBMUD) partnered with InPipe Energy to generate electricity from the flow of water in its water distribution system. According to a release, this is the first installation of the InPipe technology in California. The new in-conduit hydroelectric system works similarly to traditional pressure-regulating valves in EBMUD’s water distribution system. However, it uses a turbine to reduce water pressure while generating electricity and creating a reliable, clean source of power.
9. What pricing options are available for accessing the report?
Pricing options include single-user, multi-user, and enterprise licenses priced at USD 4750, USD 5250, and USD 8750 respectively.
10. Is the market size provided in terms of value or volume?
The market size is provided in terms of value, measured in Million.
11. Are there any specific market keywords associated with the report?
Yes, the market keyword associated with the report is "In-Pipe Hydro Systems Market," which aids in identifying and referencing the specific market segment covered.
12. How do I determine which pricing option suits my needs best?
The pricing options vary based on user requirements and access needs. Individual users may opt for single-user licenses, while businesses requiring broader access may choose multi-user or enterprise licenses for cost-effective access to the report.
13. Are there any additional resources or data provided in the In-Pipe Hydro Systems Market report?
While the report offers comprehensive insights, it's advisable to review the specific contents or supplementary materials provided to ascertain if additional resources or data are available.
14. How can I stay updated on further developments or reports in the In-Pipe Hydro Systems Market?
To stay informed about further developments, trends, and reports in the In-Pipe Hydro Systems Market, consider subscribing to industry newsletters, following relevant companies and organizations, or regularly checking reputable industry news sources and publications.
Methodology
Step 1 - Identification of Relevant Samples Size from Population Database


Step 2 - Approaches for Defining Global Market Size (Value, Volume* & Price*)

Note*: In applicable scenarios
Step 3 - Data Sources
Primary Research
- Web Analytics
- Survey Reports
- Research Institute
- Latest Research Reports
- Opinion Leaders
Secondary Research
- Annual Reports
- White Paper
- Latest Press Release
- Industry Association
- Paid Database
- Investor Presentations

Step 4 - Data Triangulation
Involves using different sources of information in order to increase the validity of a study
These sources are likely to be stakeholders in a program - participants, other researchers, program staff, other community members, and so on.
Then we put all data in single framework & apply various statistical tools to find out the dynamic on the market.
During the analysis stage, feedback from the stakeholder groups would be compared to determine areas of agreement as well as areas of divergence
