

Key Insights
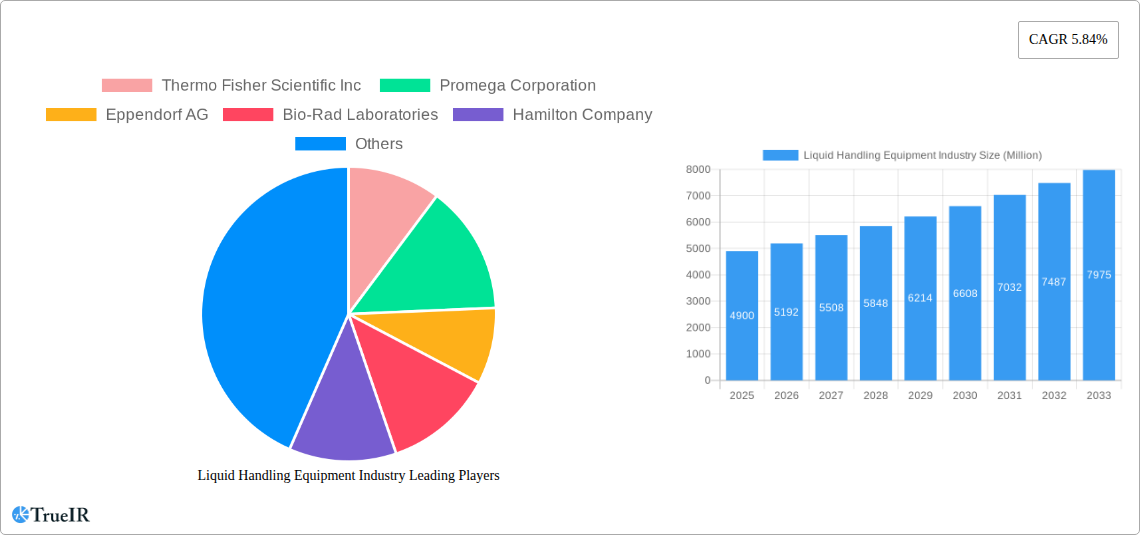
The global liquid handling equipment market, valued at $4.90 billion in 2025, is projected to experience robust growth, driven by the increasing demand for automation in pharmaceutical and biotechnology research, as well as the expanding clinical diagnostics sector. The market's Compound Annual Growth Rate (CAGR) of 5.84% from 2019 to 2024 indicates a consistent upward trajectory, expected to continue through 2033. Key growth drivers include the rising prevalence of chronic diseases fueling drug discovery efforts, the growing adoption of high-throughput screening techniques, and the increasing need for precise and efficient liquid handling in various research settings. Automation in liquid handling is a significant trend, reducing manual errors and increasing throughput, particularly evident in the adoption of automated workstations and liquid handling robots. While the market faces restraints like high initial investment costs for automated systems and the need for skilled personnel, the overall positive outlook remains strong due to continuous technological advancements and increasing research funding. The pharmaceutical and biotechnology industry constitutes the largest end-user segment, followed by contract research organizations and academic institutes. Automated liquid handling systems dominate the market by type, reflecting the industry-wide shift toward efficiency and precision. The drug discovery and cancer research applications represent substantial market segments, reflecting the focus on developing novel therapies and understanding disease mechanisms. Leading companies like Thermo Fisher Scientific, Promega, and Eppendorf are driving innovation and capturing significant market share through product diversification and strategic acquisitions. Geographic expansion, particularly in emerging markets like Asia-Pacific, is expected to further fuel market growth in the coming years.
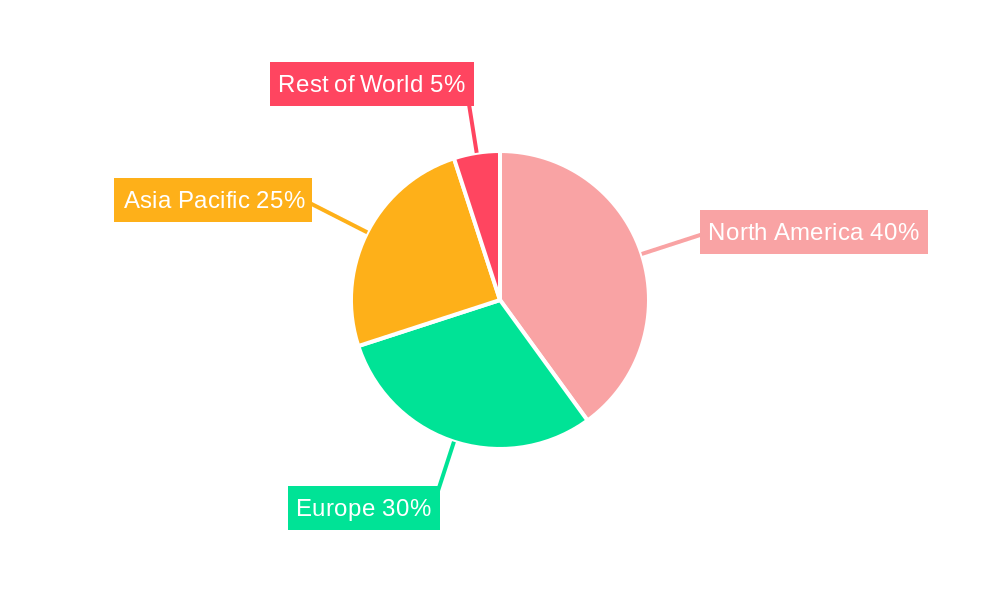
The North American market currently holds a dominant position, fueled by extensive research infrastructure and regulatory support. However, the Asia-Pacific region is predicted to exhibit the fastest growth rate, driven by burgeoning economies, increasing healthcare expenditure, and a growing number of pharmaceutical and biotechnology companies. Europe also holds a substantial market share, with strong research capabilities and a well-established life sciences industry. The market segmentation by product (pipettes, automated workstations, dispensers, etc.) reflects the diverse needs of various research and clinical applications. Future growth will be significantly influenced by factors such as technological advancements in miniaturization, integration of advanced analytics, and the development of more user-friendly and cost-effective liquid handling solutions. Further, increased adoption of liquid handling robotics and AI-powered systems will play a crucial role in shaping the market's future.
Liquid Handling Equipment Market Report: 2019-2033
This comprehensive report provides a detailed analysis of the global liquid handling equipment market, offering valuable insights for stakeholders across the pharmaceutical, biotechnology, and research sectors. With a study period spanning 2019-2033, a base year of 2025, and a forecast period of 2025-2033, this report leverages extensive market research to provide accurate predictions and strategic recommendations. The market is projected to reach xx Million by 2033, exhibiting a CAGR of xx% during the forecast period. This in-depth analysis covers market segmentation by end-user, product type, application, and geographic region, with key players including Thermo Fisher Scientific Inc, Promega Corporation, Eppendorf AG, Bio-Rad Laboratories, Hamilton Company, PerkinElmer Inc, Labcyte Inc, Agilent Technologies, and Corning Incorporated.
Liquid Handling Equipment Industry Market Structure & Competitive Landscape
The global liquid handling equipment market is characterized by a moderately concentrated landscape, with a few major players holding significant market share. The Herfindahl-Hirschman Index (HHI) for 2025 is estimated at xx, indicating a moderately concentrated market. Innovation is a key driver, with companies continuously developing advanced automated systems and incorporating novel technologies like liquid handling robotics and microfluidics. Stringent regulatory requirements, particularly within the pharmaceutical and clinical diagnostic sectors, significantly influence market dynamics. Product substitutes, such as manual pipetting techniques, exist, but automated systems are gaining traction due to improved accuracy, throughput, and reduced human error.
Market segmentation is crucial, with significant demand from the Pharmaceutical and Biotechnology industry (representing xx Million in 2025), followed by Contract Research Organizations (CROs) at xx Million. Academic institutes and other end-users contribute a further xx Million collectively. Mergers and acquisitions (M&A) activity has been moderate in recent years, with approximately xx M&A deals recorded between 2019 and 2024, primarily focused on expanding product portfolios and technological capabilities. Key strategic partnerships and collaborations also play a significant role in shaping the competitive landscape. The increasing demand for high-throughput screening and automation in drug discovery and development is a significant growth driver.
Liquid Handling Equipment Industry Market Trends & Opportunities
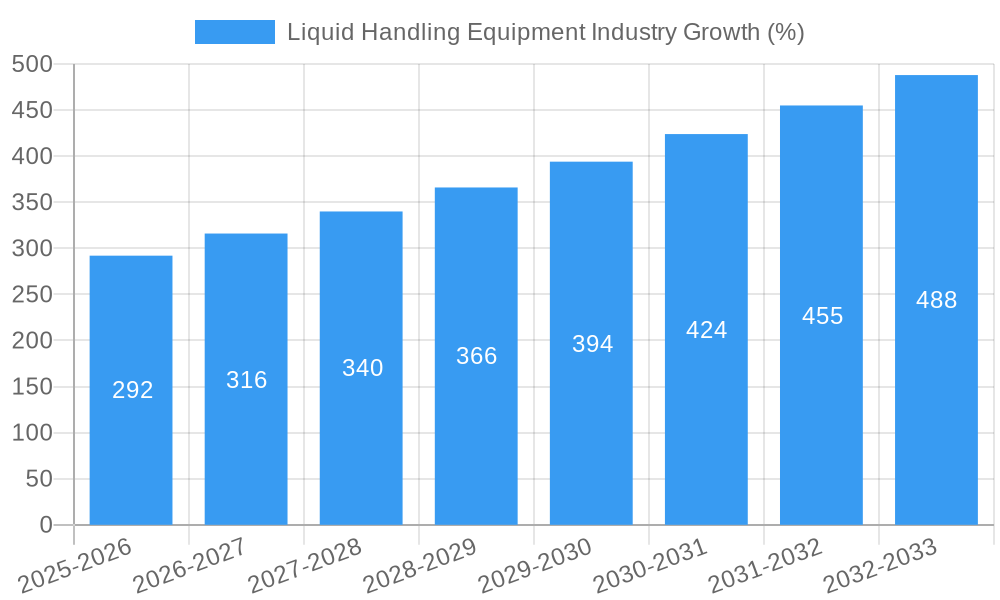
The liquid handling equipment market is experiencing robust growth, driven by several key factors. The market size is projected to reach xx Million by 2033, reflecting a significant expansion compared to the xx Million recorded in 2025. This growth is fueled by several factors including the rising prevalence of chronic diseases, increasing investments in pharmaceutical R&D, technological advancements in automation and miniaturization, and the growing adoption of liquid handling systems in various sectors such as clinical diagnostics and genomics research. The market penetration rate for automated liquid handling systems is steadily increasing, particularly in high-throughput applications. The shift towards personalized medicine is also driving demand for sophisticated liquid handling solutions capable of handling small sample volumes. Technological advancements in areas such as microfluidics, robotics, and AI-driven automation are creating new opportunities for market players. This is enhancing the efficiency and accuracy of liquid handling processes while reducing costs and turnaround times. The growing trend towards outsourcing laboratory services and the increasing demand for contract research organizations (CROs) also contribute significantly to market growth. Competitive dynamics are intense, with companies focusing on product innovation, strategic partnerships, and geographic expansion to gain a competitive edge.
Dominant Markets & Segments in Liquid Handling Equipment Industry
The North American region dominates the liquid handling equipment market, accounting for xx Million in 2025, driven by a strong pharmaceutical and biotechnology industry, significant investment in research and development, and a well-established infrastructure. Within this region, the United States is the leading market.
- Dominant End-User Segments: Pharmaceutical and Biotechnology Industry (xx Million in 2025), Contract Research Organizations (CROs), Academic Institutes.
- Dominant Product Type: Automated Liquid Handling systems (xx Million in 2025) driven by higher throughput and precision compared to manual systems.
- Dominant Application: Drug Discovery (xx Million in 2025) and Cancer and Genomics Research (xx Million in 2025), reflecting the high demand for accurate and efficient liquid handling in these critical research areas.
Key Growth Drivers:
- Strong government funding for research and development in healthcare and life sciences.
- Growing adoption of automation technologies for increased efficiency and accuracy.
- Increasing prevalence of chronic diseases boosting demand for drug development and diagnostic testing.
Liquid Handling Equipment Industry Product Analysis
Significant advancements in liquid handling technology are transforming the industry, with a strong emphasis on automation, miniaturization, and integration of advanced features like robotics and AI. Automated workstations offer high throughput and precision, pipettes are becoming increasingly ergonomic and user-friendly, and dispensers are improving in accuracy and speed. Competition is fierce, with companies focusing on offering differentiated products and services, including superior software integration and after-sales support. The market is witnessing a surge in demand for products tailored to specific applications, such as high-throughput screening, genomics, and proteomics. This trend necessitates continued innovation to meet the evolving needs of end-users.
Key Drivers, Barriers & Challenges in Liquid Handling Equipment Industry
Key Drivers:
- Rising demand for personalized medicine.
- Growing prevalence of chronic diseases, requiring increased drug discovery and development.
- Technological advancements in automation and miniaturization, leading to increased efficiency and throughput.
- Stringent regulatory requirements driving adoption of automated and validated systems.
Challenges:
- High initial investment costs associated with automated liquid handling systems.
- Supply chain disruptions affecting the availability of critical components.
- Intense competition from established and emerging players leading to price pressures. This has resulted in an estimated xx% reduction in average selling prices in the last five years.
- Regulatory hurdles and compliance requirements can present a barrier to market entry for smaller companies.
Growth Drivers in the Liquid Handling Equipment Industry Market
The liquid handling equipment market is propelled by several key growth drivers. Firstly, the increasing prevalence of chronic diseases fuels demand for effective drug discovery and development. Secondly, technological advancements, such as automation and miniaturization, enable higher throughput and precision in liquid handling processes. Thirdly, stringent regulatory compliance in the pharmaceutical and clinical diagnostic sectors necessitate the adoption of automated and validated liquid handling systems. Finally, increasing government investment in healthcare research further supports market growth.
Challenges Impacting Liquid Handling Equipment Industry Growth
The growth of the liquid handling equipment market faces several challenges. Regulatory complexities and compliance requirements, particularly in regulated markets, can significantly impact market entry and product development timelines. Supply chain disruptions, particularly the scarcity of certain electronic components, can constrain production and lead to delays. Intense competition from established and emerging players puts downward pressure on prices and margins.
Key Players Shaping the Liquid Handling Equipment Industry Market
- Thermo Fisher Scientific Inc
- Promega Corporation
- Eppendorf AG
- Bio-Rad Laboratories
- Hamilton Company
- PerkinElmer Inc
- Labcyte Inc
- Agilent Technologies
- Corning Incorporated
Significant Liquid Handling Equipment Industry Milestones
- 2020: Thermo Fisher Scientific launched a new automated liquid handling workstation with enhanced capabilities.
- 2021: Eppendorf acquired a smaller liquid handling company, expanding its product portfolio.
- 2022: Hamilton Company introduced a novel dispensing technology improving accuracy and speed.
- 2023: Increased focus on sustainable and environmentally friendly liquid handling products across multiple companies.
- 2024: Bio-Rad Laboratories released a new line of automated liquid handling systems optimized for high-throughput screening applications.
Future Outlook for Liquid Handling Equipment Industry Market
The future outlook for the liquid handling equipment market remains positive, fueled by continued technological advancements, increasing demand from various sectors, and favorable regulatory support. Strategic opportunities exist in the development of novel liquid handling technologies, expansion into emerging markets, and the creation of integrated solutions addressing specific application needs. The market potential is substantial, particularly in areas such as personalized medicine, genomics, and advanced diagnostics. The incorporation of Artificial Intelligence and Machine Learning is expected to further enhance the capabilities of liquid handling systems leading to higher efficiency and data analysis capabilities.
Liquid Handling Equipment Industry Segmentation
-
1. Type
- 1.1. Manual Liquid Handling
- 1.2. Automated Liquid Handling
- 1.3. Semi-Automated Liquid Handling
-
2. Product
- 2.1. Automated Workstations
- 2.2. Pipettes
- 2.3. Dispensers
- 2.4. Burettes
- 2.5. Others
-
3. Application
- 3.1. Drug Discovery
- 3.2. Cancer and Genomics Research
- 3.3. Clinical Diagnostics
- 3.4. Other Applications
-
4. End User
- 4.1. Pharmaceutical and Biotechnology Industry
- 4.2. Contract Research Organization
- 4.3. Academic Institutes
- 4.4. Others
Liquid Handling Equipment Industry Segmentation By Geography
-
1. North America
- 1.1. United States
- 1.2. Canada
- 1.3. Mexico
-
2. Europe
- 2.1. Germany
- 2.2. United Kingdom
- 2.3. France
- 2.4. Italy
- 2.5. Spain
- 2.6. Rest of Europe
-
3. Asia Pacific
- 3.1. China
- 3.2. Japan
- 3.3. India
- 3.4. Australia
- 3.5. South Korea
- 3.6. Rest of Asia Pacific
-
4. Middle East and Africa
- 4.1. GCC
- 4.2. South Africa
- 4.3. Rest of Middle East and Africa
-
5. South America
- 5.1. Brazil
- 5.2. Argentina
- 5.3. Rest of South America
Liquid Handling Equipment Industry REPORT HIGHLIGHTS
| Aspects | Details |
|---|---|
| Study Period | 2019-2033 |
| Base Year | 2024 |
| Estimated Year | 2025 |
| Forecast Period | 2025-2033 |
| Historical Period | 2019-2024 |
| Growth Rate | CAGR of 5.84% from 2019-2033 |
| Segmentation |
|
Table of Contents
- 1. Introduction
- 1.1. Research Scope
- 1.2. Market Segmentation
- 1.3. Research Methodology
- 1.4. Definitions and Assumptions
- 2. Executive Summary
- 2.1. Introduction
- 3. Market Dynamics
- 3.1. Introduction
- 3.2. Market Drivers
- 3.2.1. ; Rising Investment in Drug Development and Research; Increasing Demand for High-Throughput Screening; Technological Advancements in Automated Liquid Handling Systems
- 3.3. Market Restrains
- 3.3.1. ; Lack of Skilled Labor in Developing Countries; High Cost and Complexity
- 3.4. Market Trends
- 3.4.1. Contract Research Organisation in the End User Segment are Expected to Witness Healthy Growth in Future
- 4. Market Factor Analysis
- 4.1. Porters Five Forces
- 4.2. Supply/Value Chain
- 4.3. PESTEL analysis
- 4.4. Market Entropy
- 4.5. Patent/Trademark Analysis
- 5. Global Liquid Handling Equipment Industry Analysis, Insights and Forecast, 2019-2031
- 5.1. Market Analysis, Insights and Forecast - by Type
- 5.1.1. Manual Liquid Handling
- 5.1.2. Automated Liquid Handling
- 5.1.3. Semi-Automated Liquid Handling
- 5.2. Market Analysis, Insights and Forecast - by Product
- 5.2.1. Automated Workstations
- 5.2.2. Pipettes
- 5.2.3. Dispensers
- 5.2.4. Burettes
- 5.2.5. Others
- 5.3. Market Analysis, Insights and Forecast - by Application
- 5.3.1. Drug Discovery
- 5.3.2. Cancer and Genomics Research
- 5.3.3. Clinical Diagnostics
- 5.3.4. Other Applications
- 5.4. Market Analysis, Insights and Forecast - by End User
- 5.4.1. Pharmaceutical and Biotechnology Industry
- 5.4.2. Contract Research Organization
- 5.4.3. Academic Institutes
- 5.4.4. Others
- 5.5. Market Analysis, Insights and Forecast - by Region
- 5.5.1. North America
- 5.5.2. Europe
- 5.5.3. Asia Pacific
- 5.5.4. Middle East and Africa
- 5.5.5. South America
- 5.1. Market Analysis, Insights and Forecast - by Type
- 6. North America Liquid Handling Equipment Industry Analysis, Insights and Forecast, 2019-2031
- 6.1. Market Analysis, Insights and Forecast - by Type
- 6.1.1. Manual Liquid Handling
- 6.1.2. Automated Liquid Handling
- 6.1.3. Semi-Automated Liquid Handling
- 6.2. Market Analysis, Insights and Forecast - by Product
- 6.2.1. Automated Workstations
- 6.2.2. Pipettes
- 6.2.3. Dispensers
- 6.2.4. Burettes
- 6.2.5. Others
- 6.3. Market Analysis, Insights and Forecast - by Application
- 6.3.1. Drug Discovery
- 6.3.2. Cancer and Genomics Research
- 6.3.3. Clinical Diagnostics
- 6.3.4. Other Applications
- 6.4. Market Analysis, Insights and Forecast - by End User
- 6.4.1. Pharmaceutical and Biotechnology Industry
- 6.4.2. Contract Research Organization
- 6.4.3. Academic Institutes
- 6.4.4. Others
- 6.1. Market Analysis, Insights and Forecast - by Type
- 7. Europe Liquid Handling Equipment Industry Analysis, Insights and Forecast, 2019-2031
- 7.1. Market Analysis, Insights and Forecast - by Type
- 7.1.1. Manual Liquid Handling
- 7.1.2. Automated Liquid Handling
- 7.1.3. Semi-Automated Liquid Handling
- 7.2. Market Analysis, Insights and Forecast - by Product
- 7.2.1. Automated Workstations
- 7.2.2. Pipettes
- 7.2.3. Dispensers
- 7.2.4. Burettes
- 7.2.5. Others
- 7.3. Market Analysis, Insights and Forecast - by Application
- 7.3.1. Drug Discovery
- 7.3.2. Cancer and Genomics Research
- 7.3.3. Clinical Diagnostics
- 7.3.4. Other Applications
- 7.4. Market Analysis, Insights and Forecast - by End User
- 7.4.1. Pharmaceutical and Biotechnology Industry
- 7.4.2. Contract Research Organization
- 7.4.3. Academic Institutes
- 7.4.4. Others
- 7.1. Market Analysis, Insights and Forecast - by Type
- 8. Asia Pacific Liquid Handling Equipment Industry Analysis, Insights and Forecast, 2019-2031
- 8.1. Market Analysis, Insights and Forecast - by Type
- 8.1.1. Manual Liquid Handling
- 8.1.2. Automated Liquid Handling
- 8.1.3. Semi-Automated Liquid Handling
- 8.2. Market Analysis, Insights and Forecast - by Product
- 8.2.1. Automated Workstations
- 8.2.2. Pipettes
- 8.2.3. Dispensers
- 8.2.4. Burettes
- 8.2.5. Others
- 8.3. Market Analysis, Insights and Forecast - by Application
- 8.3.1. Drug Discovery
- 8.3.2. Cancer and Genomics Research
- 8.3.3. Clinical Diagnostics
- 8.3.4. Other Applications
- 8.4. Market Analysis, Insights and Forecast - by End User
- 8.4.1. Pharmaceutical and Biotechnology Industry
- 8.4.2. Contract Research Organization
- 8.4.3. Academic Institutes
- 8.4.4. Others
- 8.1. Market Analysis, Insights and Forecast - by Type
- 9. Middle East and Africa Liquid Handling Equipment Industry Analysis, Insights and Forecast, 2019-2031
- 9.1. Market Analysis, Insights and Forecast - by Type
- 9.1.1. Manual Liquid Handling
- 9.1.2. Automated Liquid Handling
- 9.1.3. Semi-Automated Liquid Handling
- 9.2. Market Analysis, Insights and Forecast - by Product
- 9.2.1. Automated Workstations
- 9.2.2. Pipettes
- 9.2.3. Dispensers
- 9.2.4. Burettes
- 9.2.5. Others
- 9.3. Market Analysis, Insights and Forecast - by Application
- 9.3.1. Drug Discovery
- 9.3.2. Cancer and Genomics Research
- 9.3.3. Clinical Diagnostics
- 9.3.4. Other Applications
- 9.4. Market Analysis, Insights and Forecast - by End User
- 9.4.1. Pharmaceutical and Biotechnology Industry
- 9.4.2. Contract Research Organization
- 9.4.3. Academic Institutes
- 9.4.4. Others
- 9.1. Market Analysis, Insights and Forecast - by Type
- 10. South America Liquid Handling Equipment Industry Analysis, Insights and Forecast, 2019-2031
- 10.1. Market Analysis, Insights and Forecast - by Type
- 10.1.1. Manual Liquid Handling
- 10.1.2. Automated Liquid Handling
- 10.1.3. Semi-Automated Liquid Handling
- 10.2. Market Analysis, Insights and Forecast - by Product
- 10.2.1. Automated Workstations
- 10.2.2. Pipettes
- 10.2.3. Dispensers
- 10.2.4. Burettes
- 10.2.5. Others
- 10.3. Market Analysis, Insights and Forecast - by Application
- 10.3.1. Drug Discovery
- 10.3.2. Cancer and Genomics Research
- 10.3.3. Clinical Diagnostics
- 10.3.4. Other Applications
- 10.4. Market Analysis, Insights and Forecast - by End User
- 10.4.1. Pharmaceutical and Biotechnology Industry
- 10.4.2. Contract Research Organization
- 10.4.3. Academic Institutes
- 10.4.4. Others
- 10.1. Market Analysis, Insights and Forecast - by Type
- 11. North America Liquid Handling Equipment Industry Analysis, Insights and Forecast, 2019-2031
- 11.1. Market Analysis, Insights and Forecast - By Country/Sub-region
- 11.1.1 United States
- 11.1.2 Canada
- 11.1.3 Mexico
- 12. Europe Liquid Handling Equipment Industry Analysis, Insights and Forecast, 2019-2031
- 12.1. Market Analysis, Insights and Forecast - By Country/Sub-region
- 12.1.1 Germany
- 12.1.2 United Kingdom
- 12.1.3 France
- 12.1.4 Italy
- 12.1.5 Spain
- 12.1.6 Rest of Europe
- 13. Asia Pacific Liquid Handling Equipment Industry Analysis, Insights and Forecast, 2019-2031
- 13.1. Market Analysis, Insights and Forecast - By Country/Sub-region
- 13.1.1 China
- 13.1.2 Japan
- 13.1.3 India
- 13.1.4 Australia
- 13.1.5 South Korea
- 13.1.6 Rest of Asia Pacific
- 14. Middle East and Africa Liquid Handling Equipment Industry Analysis, Insights and Forecast, 2019-2031
- 14.1. Market Analysis, Insights and Forecast - By Country/Sub-region
- 14.1.1 GCC
- 14.1.2 South Africa
- 14.1.3 Rest of Middle East and Africa
- 15. South America Liquid Handling Equipment Industry Analysis, Insights and Forecast, 2019-2031
- 15.1. Market Analysis, Insights and Forecast - By Country/Sub-region
- 15.1.1 Brazil
- 15.1.2 Argentina
- 15.1.3 Rest of South America
- 16. Competitive Analysis
- 16.1. Global Market Share Analysis 2024
- 16.2. Company Profiles
- 16.2.1 Thermo Fisher Scientific Inc
- 16.2.1.1. Overview
- 16.2.1.2. Products
- 16.2.1.3. SWOT Analysis
- 16.2.1.4. Recent Developments
- 16.2.1.5. Financials (Based on Availability)
- 16.2.2 Promega Corporation
- 16.2.2.1. Overview
- 16.2.2.2. Products
- 16.2.2.3. SWOT Analysis
- 16.2.2.4. Recent Developments
- 16.2.2.5. Financials (Based on Availability)
- 16.2.3 Eppendorf AG
- 16.2.3.1. Overview
- 16.2.3.2. Products
- 16.2.3.3. SWOT Analysis
- 16.2.3.4. Recent Developments
- 16.2.3.5. Financials (Based on Availability)
- 16.2.4 Bio-Rad Laboratories
- 16.2.4.1. Overview
- 16.2.4.2. Products
- 16.2.4.3. SWOT Analysis
- 16.2.4.4. Recent Developments
- 16.2.4.5. Financials (Based on Availability)
- 16.2.5 Hamilton Company
- 16.2.5.1. Overview
- 16.2.5.2. Products
- 16.2.5.3. SWOT Analysis
- 16.2.5.4. Recent Developments
- 16.2.5.5. Financials (Based on Availability)
- 16.2.6 PerkinElmer Inc
- 16.2.6.1. Overview
- 16.2.6.2. Products
- 16.2.6.3. SWOT Analysis
- 16.2.6.4. Recent Developments
- 16.2.6.5. Financials (Based on Availability)
- 16.2.7 Labcyte Inc
- 16.2.7.1. Overview
- 16.2.7.2. Products
- 16.2.7.3. SWOT Analysis
- 16.2.7.4. Recent Developments
- 16.2.7.5. Financials (Based on Availability)
- 16.2.8 Agilent Technologies
- 16.2.8.1. Overview
- 16.2.8.2. Products
- 16.2.8.3. SWOT Analysis
- 16.2.8.4. Recent Developments
- 16.2.8.5. Financials (Based on Availability)
- 16.2.9 Corning Incorporated
- 16.2.9.1. Overview
- 16.2.9.2. Products
- 16.2.9.3. SWOT Analysis
- 16.2.9.4. Recent Developments
- 16.2.9.5. Financials (Based on Availability)
- 16.2.1 Thermo Fisher Scientific Inc
List of Figures
- Figure 1: Global Liquid Handling Equipment Industry Revenue Breakdown (Million, %) by Region 2024 & 2032
- Figure 2: Global Liquid Handling Equipment Industry Volume Breakdown (K Unit, %) by Region 2024 & 2032
- Figure 3: North America Liquid Handling Equipment Industry Revenue (Million), by Country 2024 & 2032
- Figure 4: North America Liquid Handling Equipment Industry Volume (K Unit), by Country 2024 & 2032
- Figure 5: North America Liquid Handling Equipment Industry Revenue Share (%), by Country 2024 & 2032
- Figure 6: North America Liquid Handling Equipment Industry Volume Share (%), by Country 2024 & 2032
- Figure 7: Europe Liquid Handling Equipment Industry Revenue (Million), by Country 2024 & 2032
- Figure 8: Europe Liquid Handling Equipment Industry Volume (K Unit), by Country 2024 & 2032
- Figure 9: Europe Liquid Handling Equipment Industry Revenue Share (%), by Country 2024 & 2032
- Figure 10: Europe Liquid Handling Equipment Industry Volume Share (%), by Country 2024 & 2032
- Figure 11: Asia Pacific Liquid Handling Equipment Industry Revenue (Million), by Country 2024 & 2032
- Figure 12: Asia Pacific Liquid Handling Equipment Industry Volume (K Unit), by Country 2024 & 2032
- Figure 13: Asia Pacific Liquid Handling Equipment Industry Revenue Share (%), by Country 2024 & 2032
- Figure 14: Asia Pacific Liquid Handling Equipment Industry Volume Share (%), by Country 2024 & 2032
- Figure 15: Middle East and Africa Liquid Handling Equipment Industry Revenue (Million), by Country 2024 & 2032
- Figure 16: Middle East and Africa Liquid Handling Equipment Industry Volume (K Unit), by Country 2024 & 2032
- Figure 17: Middle East and Africa Liquid Handling Equipment Industry Revenue Share (%), by Country 2024 & 2032
- Figure 18: Middle East and Africa Liquid Handling Equipment Industry Volume Share (%), by Country 2024 & 2032
- Figure 19: South America Liquid Handling Equipment Industry Revenue (Million), by Country 2024 & 2032
- Figure 20: South America Liquid Handling Equipment Industry Volume (K Unit), by Country 2024 & 2032
- Figure 21: South America Liquid Handling Equipment Industry Revenue Share (%), by Country 2024 & 2032
- Figure 22: South America Liquid Handling Equipment Industry Volume Share (%), by Country 2024 & 2032
- Figure 23: North America Liquid Handling Equipment Industry Revenue (Million), by Type 2024 & 2032
- Figure 24: North America Liquid Handling Equipment Industry Volume (K Unit), by Type 2024 & 2032
- Figure 25: North America Liquid Handling Equipment Industry Revenue Share (%), by Type 2024 & 2032
- Figure 26: North America Liquid Handling Equipment Industry Volume Share (%), by Type 2024 & 2032
- Figure 27: North America Liquid Handling Equipment Industry Revenue (Million), by Product 2024 & 2032
- Figure 28: North America Liquid Handling Equipment Industry Volume (K Unit), by Product 2024 & 2032
- Figure 29: North America Liquid Handling Equipment Industry Revenue Share (%), by Product 2024 & 2032
- Figure 30: North America Liquid Handling Equipment Industry Volume Share (%), by Product 2024 & 2032
- Figure 31: North America Liquid Handling Equipment Industry Revenue (Million), by Application 2024 & 2032
- Figure 32: North America Liquid Handling Equipment Industry Volume (K Unit), by Application 2024 & 2032
- Figure 33: North America Liquid Handling Equipment Industry Revenue Share (%), by Application 2024 & 2032
- Figure 34: North America Liquid Handling Equipment Industry Volume Share (%), by Application 2024 & 2032
- Figure 35: North America Liquid Handling Equipment Industry Revenue (Million), by End User 2024 & 2032
- Figure 36: North America Liquid Handling Equipment Industry Volume (K Unit), by End User 2024 & 2032
- Figure 37: North America Liquid Handling Equipment Industry Revenue Share (%), by End User 2024 & 2032
- Figure 38: North America Liquid Handling Equipment Industry Volume Share (%), by End User 2024 & 2032
- Figure 39: North America Liquid Handling Equipment Industry Revenue (Million), by Country 2024 & 2032
- Figure 40: North America Liquid Handling Equipment Industry Volume (K Unit), by Country 2024 & 2032
- Figure 41: North America Liquid Handling Equipment Industry Revenue Share (%), by Country 2024 & 2032
- Figure 42: North America Liquid Handling Equipment Industry Volume Share (%), by Country 2024 & 2032
- Figure 43: Europe Liquid Handling Equipment Industry Revenue (Million), by Type 2024 & 2032
- Figure 44: Europe Liquid Handling Equipment Industry Volume (K Unit), by Type 2024 & 2032
- Figure 45: Europe Liquid Handling Equipment Industry Revenue Share (%), by Type 2024 & 2032
- Figure 46: Europe Liquid Handling Equipment Industry Volume Share (%), by Type 2024 & 2032
- Figure 47: Europe Liquid Handling Equipment Industry Revenue (Million), by Product 2024 & 2032
- Figure 48: Europe Liquid Handling Equipment Industry Volume (K Unit), by Product 2024 & 2032
- Figure 49: Europe Liquid Handling Equipment Industry Revenue Share (%), by Product 2024 & 2032
- Figure 50: Europe Liquid Handling Equipment Industry Volume Share (%), by Product 2024 & 2032
- Figure 51: Europe Liquid Handling Equipment Industry Revenue (Million), by Application 2024 & 2032
- Figure 52: Europe Liquid Handling Equipment Industry Volume (K Unit), by Application 2024 & 2032
- Figure 53: Europe Liquid Handling Equipment Industry Revenue Share (%), by Application 2024 & 2032
- Figure 54: Europe Liquid Handling Equipment Industry Volume Share (%), by Application 2024 & 2032
- Figure 55: Europe Liquid Handling Equipment Industry Revenue (Million), by End User 2024 & 2032
- Figure 56: Europe Liquid Handling Equipment Industry Volume (K Unit), by End User 2024 & 2032
- Figure 57: Europe Liquid Handling Equipment Industry Revenue Share (%), by End User 2024 & 2032
- Figure 58: Europe Liquid Handling Equipment Industry Volume Share (%), by End User 2024 & 2032
- Figure 59: Europe Liquid Handling Equipment Industry Revenue (Million), by Country 2024 & 2032
- Figure 60: Europe Liquid Handling Equipment Industry Volume (K Unit), by Country 2024 & 2032
- Figure 61: Europe Liquid Handling Equipment Industry Revenue Share (%), by Country 2024 & 2032
- Figure 62: Europe Liquid Handling Equipment Industry Volume Share (%), by Country 2024 & 2032
- Figure 63: Asia Pacific Liquid Handling Equipment Industry Revenue (Million), by Type 2024 & 2032
- Figure 64: Asia Pacific Liquid Handling Equipment Industry Volume (K Unit), by Type 2024 & 2032
- Figure 65: Asia Pacific Liquid Handling Equipment Industry Revenue Share (%), by Type 2024 & 2032
- Figure 66: Asia Pacific Liquid Handling Equipment Industry Volume Share (%), by Type 2024 & 2032
- Figure 67: Asia Pacific Liquid Handling Equipment Industry Revenue (Million), by Product 2024 & 2032
- Figure 68: Asia Pacific Liquid Handling Equipment Industry Volume (K Unit), by Product 2024 & 2032
- Figure 69: Asia Pacific Liquid Handling Equipment Industry Revenue Share (%), by Product 2024 & 2032
- Figure 70: Asia Pacific Liquid Handling Equipment Industry Volume Share (%), by Product 2024 & 2032
- Figure 71: Asia Pacific Liquid Handling Equipment Industry Revenue (Million), by Application 2024 & 2032
- Figure 72: Asia Pacific Liquid Handling Equipment Industry Volume (K Unit), by Application 2024 & 2032
- Figure 73: Asia Pacific Liquid Handling Equipment Industry Revenue Share (%), by Application 2024 & 2032
- Figure 74: Asia Pacific Liquid Handling Equipment Industry Volume Share (%), by Application 2024 & 2032
- Figure 75: Asia Pacific Liquid Handling Equipment Industry Revenue (Million), by End User 2024 & 2032
- Figure 76: Asia Pacific Liquid Handling Equipment Industry Volume (K Unit), by End User 2024 & 2032
- Figure 77: Asia Pacific Liquid Handling Equipment Industry Revenue Share (%), by End User 2024 & 2032
- Figure 78: Asia Pacific Liquid Handling Equipment Industry Volume Share (%), by End User 2024 & 2032
- Figure 79: Asia Pacific Liquid Handling Equipment Industry Revenue (Million), by Country 2024 & 2032
- Figure 80: Asia Pacific Liquid Handling Equipment Industry Volume (K Unit), by Country 2024 & 2032
- Figure 81: Asia Pacific Liquid Handling Equipment Industry Revenue Share (%), by Country 2024 & 2032
- Figure 82: Asia Pacific Liquid Handling Equipment Industry Volume Share (%), by Country 2024 & 2032
- Figure 83: Middle East and Africa Liquid Handling Equipment Industry Revenue (Million), by Type 2024 & 2032
- Figure 84: Middle East and Africa Liquid Handling Equipment Industry Volume (K Unit), by Type 2024 & 2032
- Figure 85: Middle East and Africa Liquid Handling Equipment Industry Revenue Share (%), by Type 2024 & 2032
- Figure 86: Middle East and Africa Liquid Handling Equipment Industry Volume Share (%), by Type 2024 & 2032
- Figure 87: Middle East and Africa Liquid Handling Equipment Industry Revenue (Million), by Product 2024 & 2032
- Figure 88: Middle East and Africa Liquid Handling Equipment Industry Volume (K Unit), by Product 2024 & 2032
- Figure 89: Middle East and Africa Liquid Handling Equipment Industry Revenue Share (%), by Product 2024 & 2032
- Figure 90: Middle East and Africa Liquid Handling Equipment Industry Volume Share (%), by Product 2024 & 2032
- Figure 91: Middle East and Africa Liquid Handling Equipment Industry Revenue (Million), by Application 2024 & 2032
- Figure 92: Middle East and Africa Liquid Handling Equipment Industry Volume (K Unit), by Application 2024 & 2032
- Figure 93: Middle East and Africa Liquid Handling Equipment Industry Revenue Share (%), by Application 2024 & 2032
- Figure 94: Middle East and Africa Liquid Handling Equipment Industry Volume Share (%), by Application 2024 & 2032
- Figure 95: Middle East and Africa Liquid Handling Equipment Industry Revenue (Million), by End User 2024 & 2032
- Figure 96: Middle East and Africa Liquid Handling Equipment Industry Volume (K Unit), by End User 2024 & 2032
- Figure 97: Middle East and Africa Liquid Handling Equipment Industry Revenue Share (%), by End User 2024 & 2032
- Figure 98: Middle East and Africa Liquid Handling Equipment Industry Volume Share (%), by End User 2024 & 2032
- Figure 99: Middle East and Africa Liquid Handling Equipment Industry Revenue (Million), by Country 2024 & 2032
- Figure 100: Middle East and Africa Liquid Handling Equipment Industry Volume (K Unit), by Country 2024 & 2032
- Figure 101: Middle East and Africa Liquid Handling Equipment Industry Revenue Share (%), by Country 2024 & 2032
- Figure 102: Middle East and Africa Liquid Handling Equipment Industry Volume Share (%), by Country 2024 & 2032
- Figure 103: South America Liquid Handling Equipment Industry Revenue (Million), by Type 2024 & 2032
- Figure 104: South America Liquid Handling Equipment Industry Volume (K Unit), by Type 2024 & 2032
- Figure 105: South America Liquid Handling Equipment Industry Revenue Share (%), by Type 2024 & 2032
- Figure 106: South America Liquid Handling Equipment Industry Volume Share (%), by Type 2024 & 2032
- Figure 107: South America Liquid Handling Equipment Industry Revenue (Million), by Product 2024 & 2032
- Figure 108: South America Liquid Handling Equipment Industry Volume (K Unit), by Product 2024 & 2032
- Figure 109: South America Liquid Handling Equipment Industry Revenue Share (%), by Product 2024 & 2032
- Figure 110: South America Liquid Handling Equipment Industry Volume Share (%), by Product 2024 & 2032
- Figure 111: South America Liquid Handling Equipment Industry Revenue (Million), by Application 2024 & 2032
- Figure 112: South America Liquid Handling Equipment Industry Volume (K Unit), by Application 2024 & 2032
- Figure 113: South America Liquid Handling Equipment Industry Revenue Share (%), by Application 2024 & 2032
- Figure 114: South America Liquid Handling Equipment Industry Volume Share (%), by Application 2024 & 2032
- Figure 115: South America Liquid Handling Equipment Industry Revenue (Million), by End User 2024 & 2032
- Figure 116: South America Liquid Handling Equipment Industry Volume (K Unit), by End User 2024 & 2032
- Figure 117: South America Liquid Handling Equipment Industry Revenue Share (%), by End User 2024 & 2032
- Figure 118: South America Liquid Handling Equipment Industry Volume Share (%), by End User 2024 & 2032
- Figure 119: South America Liquid Handling Equipment Industry Revenue (Million), by Country 2024 & 2032
- Figure 120: South America Liquid Handling Equipment Industry Volume (K Unit), by Country 2024 & 2032
- Figure 121: South America Liquid Handling Equipment Industry Revenue Share (%), by Country 2024 & 2032
- Figure 122: South America Liquid Handling Equipment Industry Volume Share (%), by Country 2024 & 2032
List of Tables
- Table 1: Global Liquid Handling Equipment Industry Revenue Million Forecast, by Region 2019 & 2032
- Table 2: Global Liquid Handling Equipment Industry Volume K Unit Forecast, by Region 2019 & 2032
- Table 3: Global Liquid Handling Equipment Industry Revenue Million Forecast, by Type 2019 & 2032
- Table 4: Global Liquid Handling Equipment Industry Volume K Unit Forecast, by Type 2019 & 2032
- Table 5: Global Liquid Handling Equipment Industry Revenue Million Forecast, by Product 2019 & 2032
- Table 6: Global Liquid Handling Equipment Industry Volume K Unit Forecast, by Product 2019 & 2032
- Table 7: Global Liquid Handling Equipment Industry Revenue Million Forecast, by Application 2019 & 2032
- Table 8: Global Liquid Handling Equipment Industry Volume K Unit Forecast, by Application 2019 & 2032
- Table 9: Global Liquid Handling Equipment Industry Revenue Million Forecast, by End User 2019 & 2032
- Table 10: Global Liquid Handling Equipment Industry Volume K Unit Forecast, by End User 2019 & 2032
- Table 11: Global Liquid Handling Equipment Industry Revenue Million Forecast, by Region 2019 & 2032
- Table 12: Global Liquid Handling Equipment Industry Volume K Unit Forecast, by Region 2019 & 2032
- Table 13: Global Liquid Handling Equipment Industry Revenue Million Forecast, by Country 2019 & 2032
- Table 14: Global Liquid Handling Equipment Industry Volume K Unit Forecast, by Country 2019 & 2032
- Table 15: United States Liquid Handling Equipment Industry Revenue (Million) Forecast, by Application 2019 & 2032
- Table 16: United States Liquid Handling Equipment Industry Volume (K Unit) Forecast, by Application 2019 & 2032
- Table 17: Canada Liquid Handling Equipment Industry Revenue (Million) Forecast, by Application 2019 & 2032
- Table 18: Canada Liquid Handling Equipment Industry Volume (K Unit) Forecast, by Application 2019 & 2032
- Table 19: Mexico Liquid Handling Equipment Industry Revenue (Million) Forecast, by Application 2019 & 2032
- Table 20: Mexico Liquid Handling Equipment Industry Volume (K Unit) Forecast, by Application 2019 & 2032
- Table 21: Global Liquid Handling Equipment Industry Revenue Million Forecast, by Country 2019 & 2032
- Table 22: Global Liquid Handling Equipment Industry Volume K Unit Forecast, by Country 2019 & 2032
- Table 23: Germany Liquid Handling Equipment Industry Revenue (Million) Forecast, by Application 2019 & 2032
- Table 24: Germany Liquid Handling Equipment Industry Volume (K Unit) Forecast, by Application 2019 & 2032
- Table 25: United Kingdom Liquid Handling Equipment Industry Revenue (Million) Forecast, by Application 2019 & 2032
- Table 26: United Kingdom Liquid Handling Equipment Industry Volume (K Unit) Forecast, by Application 2019 & 2032
- Table 27: France Liquid Handling Equipment Industry Revenue (Million) Forecast, by Application 2019 & 2032
- Table 28: France Liquid Handling Equipment Industry Volume (K Unit) Forecast, by Application 2019 & 2032
- Table 29: Italy Liquid Handling Equipment Industry Revenue (Million) Forecast, by Application 2019 & 2032
- Table 30: Italy Liquid Handling Equipment Industry Volume (K Unit) Forecast, by Application 2019 & 2032
- Table 31: Spain Liquid Handling Equipment Industry Revenue (Million) Forecast, by Application 2019 & 2032
- Table 32: Spain Liquid Handling Equipment Industry Volume (K Unit) Forecast, by Application 2019 & 2032
- Table 33: Rest of Europe Liquid Handling Equipment Industry Revenue (Million) Forecast, by Application 2019 & 2032
- Table 34: Rest of Europe Liquid Handling Equipment Industry Volume (K Unit) Forecast, by Application 2019 & 2032
- Table 35: Global Liquid Handling Equipment Industry Revenue Million Forecast, by Country 2019 & 2032
- Table 36: Global Liquid Handling Equipment Industry Volume K Unit Forecast, by Country 2019 & 2032
- Table 37: China Liquid Handling Equipment Industry Revenue (Million) Forecast, by Application 2019 & 2032
- Table 38: China Liquid Handling Equipment Industry Volume (K Unit) Forecast, by Application 2019 & 2032
- Table 39: Japan Liquid Handling Equipment Industry Revenue (Million) Forecast, by Application 2019 & 2032
- Table 40: Japan Liquid Handling Equipment Industry Volume (K Unit) Forecast, by Application 2019 & 2032
- Table 41: India Liquid Handling Equipment Industry Revenue (Million) Forecast, by Application 2019 & 2032
- Table 42: India Liquid Handling Equipment Industry Volume (K Unit) Forecast, by Application 2019 & 2032
- Table 43: Australia Liquid Handling Equipment Industry Revenue (Million) Forecast, by Application 2019 & 2032
- Table 44: Australia Liquid Handling Equipment Industry Volume (K Unit) Forecast, by Application 2019 & 2032
- Table 45: South Korea Liquid Handling Equipment Industry Revenue (Million) Forecast, by Application 2019 & 2032
- Table 46: South Korea Liquid Handling Equipment Industry Volume (K Unit) Forecast, by Application 2019 & 2032
- Table 47: Rest of Asia Pacific Liquid Handling Equipment Industry Revenue (Million) Forecast, by Application 2019 & 2032
- Table 48: Rest of Asia Pacific Liquid Handling Equipment Industry Volume (K Unit) Forecast, by Application 2019 & 2032
- Table 49: Global Liquid Handling Equipment Industry Revenue Million Forecast, by Country 2019 & 2032
- Table 50: Global Liquid Handling Equipment Industry Volume K Unit Forecast, by Country 2019 & 2032
- Table 51: GCC Liquid Handling Equipment Industry Revenue (Million) Forecast, by Application 2019 & 2032
- Table 52: GCC Liquid Handling Equipment Industry Volume (K Unit) Forecast, by Application 2019 & 2032
- Table 53: South Africa Liquid Handling Equipment Industry Revenue (Million) Forecast, by Application 2019 & 2032
- Table 54: South Africa Liquid Handling Equipment Industry Volume (K Unit) Forecast, by Application 2019 & 2032
- Table 55: Rest of Middle East and Africa Liquid Handling Equipment Industry Revenue (Million) Forecast, by Application 2019 & 2032
- Table 56: Rest of Middle East and Africa Liquid Handling Equipment Industry Volume (K Unit) Forecast, by Application 2019 & 2032
- Table 57: Global Liquid Handling Equipment Industry Revenue Million Forecast, by Country 2019 & 2032
- Table 58: Global Liquid Handling Equipment Industry Volume K Unit Forecast, by Country 2019 & 2032
- Table 59: Brazil Liquid Handling Equipment Industry Revenue (Million) Forecast, by Application 2019 & 2032
- Table 60: Brazil Liquid Handling Equipment Industry Volume (K Unit) Forecast, by Application 2019 & 2032
- Table 61: Argentina Liquid Handling Equipment Industry Revenue (Million) Forecast, by Application 2019 & 2032
- Table 62: Argentina Liquid Handling Equipment Industry Volume (K Unit) Forecast, by Application 2019 & 2032
- Table 63: Rest of South America Liquid Handling Equipment Industry Revenue (Million) Forecast, by Application 2019 & 2032
- Table 64: Rest of South America Liquid Handling Equipment Industry Volume (K Unit) Forecast, by Application 2019 & 2032
- Table 65: Global Liquid Handling Equipment Industry Revenue Million Forecast, by Type 2019 & 2032
- Table 66: Global Liquid Handling Equipment Industry Volume K Unit Forecast, by Type 2019 & 2032
- Table 67: Global Liquid Handling Equipment Industry Revenue Million Forecast, by Product 2019 & 2032
- Table 68: Global Liquid Handling Equipment Industry Volume K Unit Forecast, by Product 2019 & 2032
- Table 69: Global Liquid Handling Equipment Industry Revenue Million Forecast, by Application 2019 & 2032
- Table 70: Global Liquid Handling Equipment Industry Volume K Unit Forecast, by Application 2019 & 2032
- Table 71: Global Liquid Handling Equipment Industry Revenue Million Forecast, by End User 2019 & 2032
- Table 72: Global Liquid Handling Equipment Industry Volume K Unit Forecast, by End User 2019 & 2032
- Table 73: Global Liquid Handling Equipment Industry Revenue Million Forecast, by Country 2019 & 2032
- Table 74: Global Liquid Handling Equipment Industry Volume K Unit Forecast, by Country 2019 & 2032
- Table 75: United States Liquid Handling Equipment Industry Revenue (Million) Forecast, by Application 2019 & 2032
- Table 76: United States Liquid Handling Equipment Industry Volume (K Unit) Forecast, by Application 2019 & 2032
- Table 77: Canada Liquid Handling Equipment Industry Revenue (Million) Forecast, by Application 2019 & 2032
- Table 78: Canada Liquid Handling Equipment Industry Volume (K Unit) Forecast, by Application 2019 & 2032
- Table 79: Mexico Liquid Handling Equipment Industry Revenue (Million) Forecast, by Application 2019 & 2032
- Table 80: Mexico Liquid Handling Equipment Industry Volume (K Unit) Forecast, by Application 2019 & 2032
- Table 81: Global Liquid Handling Equipment Industry Revenue Million Forecast, by Type 2019 & 2032
- Table 82: Global Liquid Handling Equipment Industry Volume K Unit Forecast, by Type 2019 & 2032
- Table 83: Global Liquid Handling Equipment Industry Revenue Million Forecast, by Product 2019 & 2032
- Table 84: Global Liquid Handling Equipment Industry Volume K Unit Forecast, by Product 2019 & 2032
- Table 85: Global Liquid Handling Equipment Industry Revenue Million Forecast, by Application 2019 & 2032
- Table 86: Global Liquid Handling Equipment Industry Volume K Unit Forecast, by Application 2019 & 2032
- Table 87: Global Liquid Handling Equipment Industry Revenue Million Forecast, by End User 2019 & 2032
- Table 88: Global Liquid Handling Equipment Industry Volume K Unit Forecast, by End User 2019 & 2032
- Table 89: Global Liquid Handling Equipment Industry Revenue Million Forecast, by Country 2019 & 2032
- Table 90: Global Liquid Handling Equipment Industry Volume K Unit Forecast, by Country 2019 & 2032
- Table 91: Germany Liquid Handling Equipment Industry Revenue (Million) Forecast, by Application 2019 & 2032
- Table 92: Germany Liquid Handling Equipment Industry Volume (K Unit) Forecast, by Application 2019 & 2032
- Table 93: United Kingdom Liquid Handling Equipment Industry Revenue (Million) Forecast, by Application 2019 & 2032
- Table 94: United Kingdom Liquid Handling Equipment Industry Volume (K Unit) Forecast, by Application 2019 & 2032
- Table 95: France Liquid Handling Equipment Industry Revenue (Million) Forecast, by Application 2019 & 2032
- Table 96: France Liquid Handling Equipment Industry Volume (K Unit) Forecast, by Application 2019 & 2032
- Table 97: Italy Liquid Handling Equipment Industry Revenue (Million) Forecast, by Application 2019 & 2032
- Table 98: Italy Liquid Handling Equipment Industry Volume (K Unit) Forecast, by Application 2019 & 2032
- Table 99: Spain Liquid Handling Equipment Industry Revenue (Million) Forecast, by Application 2019 & 2032
- Table 100: Spain Liquid Handling Equipment Industry Volume (K Unit) Forecast, by Application 2019 & 2032
- Table 101: Rest of Europe Liquid Handling Equipment Industry Revenue (Million) Forecast, by Application 2019 & 2032
- Table 102: Rest of Europe Liquid Handling Equipment Industry Volume (K Unit) Forecast, by Application 2019 & 2032
- Table 103: Global Liquid Handling Equipment Industry Revenue Million Forecast, by Type 2019 & 2032
- Table 104: Global Liquid Handling Equipment Industry Volume K Unit Forecast, by Type 2019 & 2032
- Table 105: Global Liquid Handling Equipment Industry Revenue Million Forecast, by Product 2019 & 2032
- Table 106: Global Liquid Handling Equipment Industry Volume K Unit Forecast, by Product 2019 & 2032
- Table 107: Global Liquid Handling Equipment Industry Revenue Million Forecast, by Application 2019 & 2032
- Table 108: Global Liquid Handling Equipment Industry Volume K Unit Forecast, by Application 2019 & 2032
- Table 109: Global Liquid Handling Equipment Industry Revenue Million Forecast, by End User 2019 & 2032
- Table 110: Global Liquid Handling Equipment Industry Volume K Unit Forecast, by End User 2019 & 2032
- Table 111: Global Liquid Handling Equipment Industry Revenue Million Forecast, by Country 2019 & 2032
- Table 112: Global Liquid Handling Equipment Industry Volume K Unit Forecast, by Country 2019 & 2032
- Table 113: China Liquid Handling Equipment Industry Revenue (Million) Forecast, by Application 2019 & 2032
- Table 114: China Liquid Handling Equipment Industry Volume (K Unit) Forecast, by Application 2019 & 2032
- Table 115: Japan Liquid Handling Equipment Industry Revenue (Million) Forecast, by Application 2019 & 2032
- Table 116: Japan Liquid Handling Equipment Industry Volume (K Unit) Forecast, by Application 2019 & 2032
- Table 117: India Liquid Handling Equipment Industry Revenue (Million) Forecast, by Application 2019 & 2032
- Table 118: India Liquid Handling Equipment Industry Volume (K Unit) Forecast, by Application 2019 & 2032
- Table 119: Australia Liquid Handling Equipment Industry Revenue (Million) Forecast, by Application 2019 & 2032
- Table 120: Australia Liquid Handling Equipment Industry Volume (K Unit) Forecast, by Application 2019 & 2032
- Table 121: South Korea Liquid Handling Equipment Industry Revenue (Million) Forecast, by Application 2019 & 2032
- Table 122: South Korea Liquid Handling Equipment Industry Volume (K Unit) Forecast, by Application 2019 & 2032
- Table 123: Rest of Asia Pacific Liquid Handling Equipment Industry Revenue (Million) Forecast, by Application 2019 & 2032
- Table 124: Rest of Asia Pacific Liquid Handling Equipment Industry Volume (K Unit) Forecast, by Application 2019 & 2032
- Table 125: Global Liquid Handling Equipment Industry Revenue Million Forecast, by Type 2019 & 2032
- Table 126: Global Liquid Handling Equipment Industry Volume K Unit Forecast, by Type 2019 & 2032
- Table 127: Global Liquid Handling Equipment Industry Revenue Million Forecast, by Product 2019 & 2032
- Table 128: Global Liquid Handling Equipment Industry Volume K Unit Forecast, by Product 2019 & 2032
- Table 129: Global Liquid Handling Equipment Industry Revenue Million Forecast, by Application 2019 & 2032
- Table 130: Global Liquid Handling Equipment Industry Volume K Unit Forecast, by Application 2019 & 2032
- Table 131: Global Liquid Handling Equipment Industry Revenue Million Forecast, by End User 2019 & 2032
- Table 132: Global Liquid Handling Equipment Industry Volume K Unit Forecast, by End User 2019 & 2032
- Table 133: Global Liquid Handling Equipment Industry Revenue Million Forecast, by Country 2019 & 2032
- Table 134: Global Liquid Handling Equipment Industry Volume K Unit Forecast, by Country 2019 & 2032
- Table 135: GCC Liquid Handling Equipment Industry Revenue (Million) Forecast, by Application 2019 & 2032
- Table 136: GCC Liquid Handling Equipment Industry Volume (K Unit) Forecast, by Application 2019 & 2032
- Table 137: South Africa Liquid Handling Equipment Industry Revenue (Million) Forecast, by Application 2019 & 2032
- Table 138: South Africa Liquid Handling Equipment Industry Volume (K Unit) Forecast, by Application 2019 & 2032
- Table 139: Rest of Middle East and Africa Liquid Handling Equipment Industry Revenue (Million) Forecast, by Application 2019 & 2032
- Table 140: Rest of Middle East and Africa Liquid Handling Equipment Industry Volume (K Unit) Forecast, by Application 2019 & 2032
- Table 141: Global Liquid Handling Equipment Industry Revenue Million Forecast, by Type 2019 & 2032
- Table 142: Global Liquid Handling Equipment Industry Volume K Unit Forecast, by Type 2019 & 2032
- Table 143: Global Liquid Handling Equipment Industry Revenue Million Forecast, by Product 2019 & 2032
- Table 144: Global Liquid Handling Equipment Industry Volume K Unit Forecast, by Product 2019 & 2032
- Table 145: Global Liquid Handling Equipment Industry Revenue Million Forecast, by Application 2019 & 2032
- Table 146: Global Liquid Handling Equipment Industry Volume K Unit Forecast, by Application 2019 & 2032
- Table 147: Global Liquid Handling Equipment Industry Revenue Million Forecast, by End User 2019 & 2032
- Table 148: Global Liquid Handling Equipment Industry Volume K Unit Forecast, by End User 2019 & 2032
- Table 149: Global Liquid Handling Equipment Industry Revenue Million Forecast, by Country 2019 & 2032
- Table 150: Global Liquid Handling Equipment Industry Volume K Unit Forecast, by Country 2019 & 2032
- Table 151: Brazil Liquid Handling Equipment Industry Revenue (Million) Forecast, by Application 2019 & 2032
- Table 152: Brazil Liquid Handling Equipment Industry Volume (K Unit) Forecast, by Application 2019 & 2032
- Table 153: Argentina Liquid Handling Equipment Industry Revenue (Million) Forecast, by Application 2019 & 2032
- Table 154: Argentina Liquid Handling Equipment Industry Volume (K Unit) Forecast, by Application 2019 & 2032
- Table 155: Rest of South America Liquid Handling Equipment Industry Revenue (Million) Forecast, by Application 2019 & 2032
- Table 156: Rest of South America Liquid Handling Equipment Industry Volume (K Unit) Forecast, by Application 2019 & 2032
Frequently Asked Questions
1. What is the projected Compound Annual Growth Rate (CAGR) of the Liquid Handling Equipment Industry?
The projected CAGR is approximately 5.84%.
2. Which companies are prominent players in the Liquid Handling Equipment Industry?
Key companies in the market include Thermo Fisher Scientific Inc , Promega Corporation, Eppendorf AG, Bio-Rad Laboratories, Hamilton Company, PerkinElmer Inc, Labcyte Inc, Agilent Technologies, Corning Incorporated.
3. What are the main segments of the Liquid Handling Equipment Industry?
The market segments include Type, Product, Application, End User.
4. Can you provide details about the market size?
The market size is estimated to be USD 4.90 Million as of 2022.
5. What are some drivers contributing to market growth?
; Rising Investment in Drug Development and Research; Increasing Demand for High-Throughput Screening; Technological Advancements in Automated Liquid Handling Systems.
6. What are the notable trends driving market growth?
Contract Research Organisation in the End User Segment are Expected to Witness Healthy Growth in Future.
7. Are there any restraints impacting market growth?
; Lack of Skilled Labor in Developing Countries; High Cost and Complexity.
8. Can you provide examples of recent developments in the market?
N/A
9. What pricing options are available for accessing the report?
Pricing options include single-user, multi-user, and enterprise licenses priced at USD 4750, USD 5250, and USD 8750 respectively.
10. Is the market size provided in terms of value or volume?
The market size is provided in terms of value, measured in Million and volume, measured in K Unit.
11. Are there any specific market keywords associated with the report?
Yes, the market keyword associated with the report is "Liquid Handling Equipment Industry," which aids in identifying and referencing the specific market segment covered.
12. How do I determine which pricing option suits my needs best?
The pricing options vary based on user requirements and access needs. Individual users may opt for single-user licenses, while businesses requiring broader access may choose multi-user or enterprise licenses for cost-effective access to the report.
13. Are there any additional resources or data provided in the Liquid Handling Equipment Industry report?
While the report offers comprehensive insights, it's advisable to review the specific contents or supplementary materials provided to ascertain if additional resources or data are available.
14. How can I stay updated on further developments or reports in the Liquid Handling Equipment Industry?
To stay informed about further developments, trends, and reports in the Liquid Handling Equipment Industry, consider subscribing to industry newsletters, following relevant companies and organizations, or regularly checking reputable industry news sources and publications.
Methodology
Step 1 - Identification of Relevant Samples Size from Population Database


Step 2 - Approaches for Defining Global Market Size (Value, Volume* & Price*)

Note*: In applicable scenarios
Step 3 - Data Sources
Primary Research
- Web Analytics
- Survey Reports
- Research Institute
- Latest Research Reports
- Opinion Leaders
Secondary Research
- Annual Reports
- White Paper
- Latest Press Release
- Industry Association
- Paid Database
- Investor Presentations

Step 4 - Data Triangulation
Involves using different sources of information in order to increase the validity of a study
These sources are likely to be stakeholders in a program - participants, other researchers, program staff, other community members, and so on.
Then we put all data in single framework & apply various statistical tools to find out the dynamic on the market.
During the analysis stage, feedback from the stakeholder groups would be compared to determine areas of agreement as well as areas of divergence
