

Key Insights
The LNG regasification terminals market is experiencing robust growth, driven by increasing global demand for natural gas as a cleaner-burning fossil fuel and a transition away from coal. The market, valued at approximately $XX million in 2025, is projected to exhibit a Compound Annual Growth Rate (CAGR) of 5.60% from 2025 to 2033. This growth is fueled by several key factors. Firstly, stringent environmental regulations globally are pushing nations to adopt cleaner energy sources, boosting the need for LNG as a transitional fuel. Secondly, the increasing energy security concerns among nations are leading to diversification of energy sources and a higher reliance on LNG imports, further stimulating demand for regasification terminals. Finally, technological advancements in terminal designs, including the development of floating LNG (FLNG) terminals, are improving efficiency and reducing costs, making the technology more accessible to countries with limited onshore infrastructure. The market is segmented by terminal type (large-scale, small & medium-scale) and deployment (onshore, floating), with large-scale onshore terminals currently dominating the market share. However, floating terminals are expected to witness significant growth due to their flexibility and lower capital expenditure requirements.
Major players like Shell PLC, Engie SA, and Fluor Corporation are actively shaping the market through strategic investments and technological innovations. Geographical expansion is another key driver, with Asia-Pacific and North America expected to be the leading regions due to high energy demand and supportive governmental policies. While growth is projected to be consistent, potential restraints include volatile LNG prices, the increasing competition from renewable energy sources, and the potential for regulatory hurdles in different regions. Nevertheless, the long-term outlook for the LNG regasification terminals market remains positive, driven by the continued global need for reliable and cleaner energy sources. The market is expected to reach a value significantly above its 2025 valuation by 2033, reflecting the persistent growth trajectory.
This dynamic report provides a comprehensive analysis of the LNG Regasification Terminals industry, offering invaluable insights for investors, industry professionals, and strategic decision-makers. With a study period spanning 2019-2033, a base year of 2025, and a forecast period of 2025-2033, this report leverages extensive data and expert analysis to illuminate market trends, opportunities, and challenges. The report forecasts a market size of $XX Million in 2025 and a Compound Annual Growth Rate (CAGR) of XX% during the forecast period.

LNG Regasification Terminals Industry Market Structure & Competitive Landscape
The LNG regasification terminals market presents a moderately concentrated structure, characterized by several major players commanding substantial market share. While a precise Herfindahl-Hirschman Index (HHI) value requires proprietary data, the market demonstrates characteristics of moderate competition. Key innovation drivers include significant advancements in Floating Storage Regasification Units (FSRU) technology, optimized regasification processes leveraging innovative heat exchange and vaporization techniques, and the strategic integration of digital technologies to enhance operational efficiency, safety, and predictive maintenance. Regulatory landscapes, exhibiting considerable variance across different geographical regions, exert a significant influence on market dynamics. This impact is particularly pronounced concerning environmental regulations, permitting procedures, and evolving safety standards. The availability of substitute products, such as natural gas pipelines, presents a competitive challenge, especially in regions with well-established pipeline networks. End-user segmentation encompasses a diverse range of consumers, primarily including power generation companies, industrial consumers (e.g., chemical plants, refineries), and city gas distributors. The market's evolution has been marked by notable mergers and acquisitions (M&A) activity in recent years, with a cumulative transaction volume estimated in the range of [Insert Estimated Value] since 2019. This consolidation trend suggests ongoing efforts by market participants to enhance operational efficiency, expand their geographical reach, and optimize resource allocation.
- Market Concentration: Moderately concentrated.
- Innovation Drivers: FSRU technology advancements, digitalization, process optimization (including advanced heat exchangers and vaporization).
- Regulatory Impacts: Varying environmental regulations, permitting processes, and safety standards across regions.
- Product Substitutes: Pipelines for natural gas delivery.
- End-User Segmentation: Power generation, industrial consumers (chemical plants, refineries etc.), city gas distributors.
- M&A Trends: Significant M&A activity since 2019, with a cumulative transaction volume estimated in the range of [Insert Estimated Value].
LNG Regasification Terminals Industry Market Trends & Opportunities
The LNG regasification terminals market is experiencing robust growth, fueled by the escalating global demand for natural gas, especially in regions facing limitations in domestic natural gas supplies. This demand surge is further amplified by the increasing adoption of natural gas as a transition fuel amidst a global shift towards cleaner energy sources. Technological progress, exemplified by the development of smaller, more modular terminals and highly efficient regasification technologies, is creating expanded market opportunities. These advancements reduce capital expenditure, deployment times, and environmental impact. However, the market's competitive landscape is dynamically shaped by the entry of new players, the availability of alternative energy sources (such as renewable natural gas and hydrogen), and fluctuations in global energy prices. The market size is projected to reach [Insert Projected Value] by 2033, exhibiting considerable growth potential across diverse regions and market segments. Specific growth opportunities include serving emerging economies with expanding energy needs and supporting the decarbonization efforts of developed nations.
Dominant Markets & Segments in LNG Regasification Terminals Industry
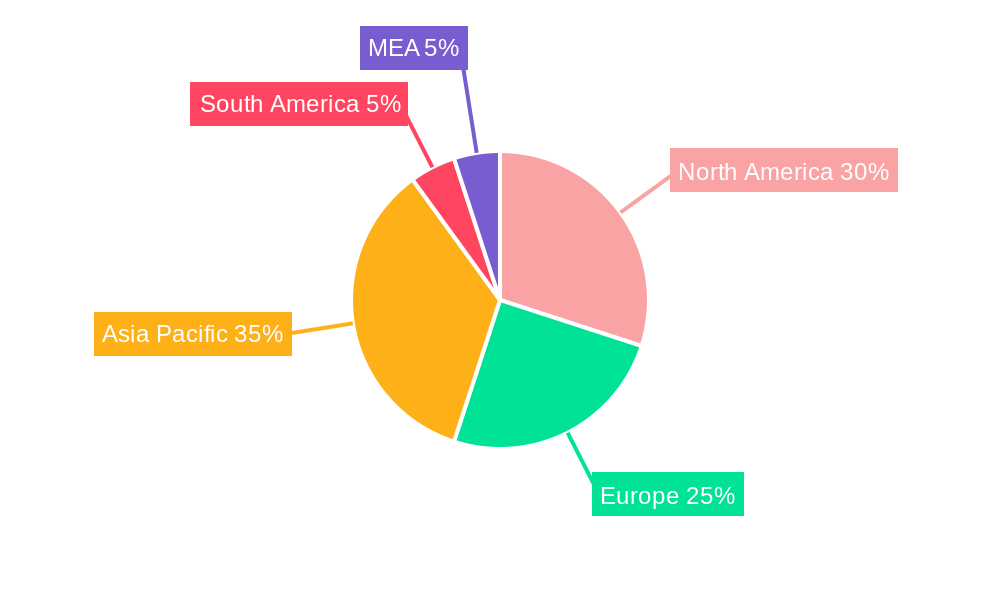
The Asia-Pacific region currently holds the leading position in the LNG regasification terminals market, driven by robust economic expansion, a surge in energy demand, and limited domestic natural gas reserves. Europe and North America also represent significant markets with substantial growth prospects. The large-scale terminal segment retains market dominance due to its high capacity and economies of scale. However, floating storage regasification units (FSRUs) are gaining considerable traction due to their inherent flexibility, lower capital expenditure requirements compared to onshore facilities, and ability to quickly address short-term supply needs.
Leading Region: Asia-Pacific
Key Growth Drivers:
- Asia-Pacific: Rapid economic growth, increasing energy demand, limited domestic gas reserves.
- Europe: Stringent environmental regulations promoting gas as a transition fuel, and diversification of energy sources.
- North America: Growing demand for natural gas in power generation and industrial sectors, coupled with increasing LNG exports.
Dominant Segment: Large-scale terminals
Emerging Segment: Floating (FSRU) terminals
LNG Regasification Terminals Industry Product Analysis
The industry is witnessing continuous product innovation, with a strong emphasis on improving efficiency, reducing environmental impact, minimizing operational risks, and enhancing safety. Advancements in regasification technologies, including the implementation of advanced heat exchangers, optimized vaporization processes, and innovative sub-cooling techniques, are significantly improving terminal efficiency. The adoption of modular design and prefabricated components facilitates faster deployment, reduces on-site construction time, and lowers overall costs. These innovations are enhancing the market fit of LNG regasification terminals by making them more versatile, cost-effective, environmentally responsible, and capable of meeting the evolving demands of the energy sector.
Key Drivers, Barriers & Challenges in LNG Regasification Terminals Industry
Key Drivers:
- Growing global demand for natural gas
- Technological advancements in FSRU technology and regasification processes
- Government policies supporting the use of natural gas as a transition fuel
Challenges & Restraints:
- High capital expenditure for onshore terminal development
- Regulatory complexities and permitting processes
- Competition from alternative energy sources, impacting market penetration by approximately XX% annually.
Growth Drivers in the LNG Regasification Terminals Industry Market
The LNG regasification terminals market's growth is primarily propelled by increasing global demand for natural gas as a cleaner-burning fuel, coupled with advancements in regasification technologies that improve efficiency and reduce costs. Supportive government policies, particularly in regions with limited domestic gas reserves, are accelerating market expansion.
Challenges Impacting LNG Regasification Terminals Industry Growth
Significant challenges include the substantial initial capital investment required for terminal construction, especially for onshore facilities. Regulatory hurdles, complex permitting procedures, and potential delays in obtaining necessary approvals across various regions pose impediments to project development. Intense competition from existing pipeline infrastructure and the emergence of alternative energy sources represent ongoing challenges. Geopolitical factors, such as energy security concerns and trade disputes, also influence investment decisions and project feasibility. Furthermore, the need for skilled labor and workforce development is crucial for safe and efficient terminal operation.
Key Players Shaping the LNG Regasification Terminals Industry Market
- Shell PLC
- Engie SA
- Fluor Corporation
- Weatherford International PLC
- Wartsila Oyj ABP
- Linde plc
- Baker Hughes Company
- Schlumberger Limited
Significant LNG Regasification Terminals Industry Industry Milestones
- September 2021: South Africa announces plans for its first LNG import and distribution terminal, opting for an FSRU configuration. This signifies the growing adoption of FSRUs in emerging markets.
- January 2021: ExxonMobil and Royal Vopak sign an MOU to study the feasibility of an LNG regasification terminal in South Africa. This highlights increased private sector interest in developing LNG infrastructure in Africa.
Future Outlook for LNG Regasification Terminals Industry Market
The LNG regasification terminals market is poised for continued growth, driven by strong global demand for natural gas and the increasing adoption of FSRUs. Strategic opportunities exist in emerging markets with limited pipeline infrastructure, as well as in regions actively transitioning to cleaner energy sources. The market's potential is substantial, with significant growth projected throughout the forecast period.
LNG Regasification Terminals Industry Segmentation
-
1. Terminal Type
- 1.1. large Scale
- 1.2. Small Scale & Medium
-
2. Deployment
- 2.1. Onshore
- 2.2. Floating
LNG Regasification Terminals Industry Segmentation By Geography
- 1. North America
- 2. South America
- 3. Asia Pacific
- 4. Europe
- 5. Middle East and Africa
LNG Regasification Terminals Industry REPORT HIGHLIGHTS
| Aspects | Details |
|---|---|
| Study Period | 2019-2033 |
| Base Year | 2024 |
| Estimated Year | 2025 |
| Forecast Period | 2025-2033 |
| Historical Period | 2019-2024 |
| Growth Rate | CAGR of 5.60% from 2019-2033 |
| Segmentation |
|
Table of Contents
- 1. Introduction
- 1.1. Research Scope
- 1.2. Market Segmentation
- 1.3. Research Methodology
- 1.4. Definitions and Assumptions
- 2. Executive Summary
- 2.1. Introduction
- 3. Market Dynamics
- 3.1. Introduction
- 3.2. Market Drivers
- 3.2.1. 4.; The Rise in Oil and Gas Drilling Activities4.; Increased Shale Gas Exploration
- 3.3. Market Restrains
- 3.3.1. 4.; Increasing Share of Renewable Energy
- 3.4. Market Trends
- 3.4.1. The Floating Regasification Terminals Segment is Expected to Dominate the Market
- 4. Market Factor Analysis
- 4.1. Porters Five Forces
- 4.2. Supply/Value Chain
- 4.3. PESTEL analysis
- 4.4. Market Entropy
- 4.5. Patent/Trademark Analysis
- 5. Global LNG Regasification Terminals Industry Analysis, Insights and Forecast, 2019-2031
- 5.1. Market Analysis, Insights and Forecast - by Terminal Type
- 5.1.1. large Scale
- 5.1.2. Small Scale & Medium
- 5.2. Market Analysis, Insights and Forecast - by Deployment
- 5.2.1. Onshore
- 5.2.2. Floating
- 5.3. Market Analysis, Insights and Forecast - by Region
- 5.3.1. North America
- 5.3.2. South America
- 5.3.3. Asia Pacific
- 5.3.4. Europe
- 5.3.5. Middle East and Africa
- 5.1. Market Analysis, Insights and Forecast - by Terminal Type
- 6. North America LNG Regasification Terminals Industry Analysis, Insights and Forecast, 2019-2031
- 6.1. Market Analysis, Insights and Forecast - by Terminal Type
- 6.1.1. large Scale
- 6.1.2. Small Scale & Medium
- 6.2. Market Analysis, Insights and Forecast - by Deployment
- 6.2.1. Onshore
- 6.2.2. Floating
- 6.1. Market Analysis, Insights and Forecast - by Terminal Type
- 7. South America LNG Regasification Terminals Industry Analysis, Insights and Forecast, 2019-2031
- 7.1. Market Analysis, Insights and Forecast - by Terminal Type
- 7.1.1. large Scale
- 7.1.2. Small Scale & Medium
- 7.2. Market Analysis, Insights and Forecast - by Deployment
- 7.2.1. Onshore
- 7.2.2. Floating
- 7.1. Market Analysis, Insights and Forecast - by Terminal Type
- 8. Asia Pacific LNG Regasification Terminals Industry Analysis, Insights and Forecast, 2019-2031
- 8.1. Market Analysis, Insights and Forecast - by Terminal Type
- 8.1.1. large Scale
- 8.1.2. Small Scale & Medium
- 8.2. Market Analysis, Insights and Forecast - by Deployment
- 8.2.1. Onshore
- 8.2.2. Floating
- 8.1. Market Analysis, Insights and Forecast - by Terminal Type
- 9. Europe LNG Regasification Terminals Industry Analysis, Insights and Forecast, 2019-2031
- 9.1. Market Analysis, Insights and Forecast - by Terminal Type
- 9.1.1. large Scale
- 9.1.2. Small Scale & Medium
- 9.2. Market Analysis, Insights and Forecast - by Deployment
- 9.2.1. Onshore
- 9.2.2. Floating
- 9.1. Market Analysis, Insights and Forecast - by Terminal Type
- 10. Middle East and Africa LNG Regasification Terminals Industry Analysis, Insights and Forecast, 2019-2031
- 10.1. Market Analysis, Insights and Forecast - by Terminal Type
- 10.1.1. large Scale
- 10.1.2. Small Scale & Medium
- 10.2. Market Analysis, Insights and Forecast - by Deployment
- 10.2.1. Onshore
- 10.2.2. Floating
- 10.1. Market Analysis, Insights and Forecast - by Terminal Type
- 11. North America LNG Regasification Terminals Industry Analysis, Insights and Forecast, 2019-2031
- 11.1. Market Analysis, Insights and Forecast - By Country/Sub-region
- 11.1.1 United States
- 11.1.2 Canada
- 11.1.3 Mexico
- 12. Europe LNG Regasification Terminals Industry Analysis, Insights and Forecast, 2019-2031
- 12.1. Market Analysis, Insights and Forecast - By Country/Sub-region
- 12.1.1 Germany
- 12.1.2 United Kingdom
- 12.1.3 France
- 12.1.4 Spain
- 12.1.5 Italy
- 12.1.6 Spain
- 12.1.7 Belgium
- 12.1.8 Netherland
- 12.1.9 Nordics
- 12.1.10 Rest of Europe
- 13. Asia Pacific LNG Regasification Terminals Industry Analysis, Insights and Forecast, 2019-2031
- 13.1. Market Analysis, Insights and Forecast - By Country/Sub-region
- 13.1.1 China
- 13.1.2 Japan
- 13.1.3 India
- 13.1.4 South Korea
- 13.1.5 Southeast Asia
- 13.1.6 Australia
- 13.1.7 Indonesia
- 13.1.8 Phillipes
- 13.1.9 Singapore
- 13.1.10 Thailandc
- 13.1.11 Rest of Asia Pacific
- 14. South America LNG Regasification Terminals Industry Analysis, Insights and Forecast, 2019-2031
- 14.1. Market Analysis, Insights and Forecast - By Country/Sub-region
- 14.1.1 Brazil
- 14.1.2 Argentina
- 14.1.3 Peru
- 14.1.4 Chile
- 14.1.5 Colombia
- 14.1.6 Ecuador
- 14.1.7 Venezuela
- 14.1.8 Rest of South America
- 15. North America LNG Regasification Terminals Industry Analysis, Insights and Forecast, 2019-2031
- 15.1. Market Analysis, Insights and Forecast - By Country/Sub-region
- 15.1.1 United States
- 15.1.2 Canada
- 15.1.3 Mexico
- 16. MEA LNG Regasification Terminals Industry Analysis, Insights and Forecast, 2019-2031
- 16.1. Market Analysis, Insights and Forecast - By Country/Sub-region
- 16.1.1 United Arab Emirates
- 16.1.2 Saudi Arabia
- 16.1.3 South Africa
- 16.1.4 Rest of Middle East and Africa
- 17. Competitive Analysis
- 17.1. Global Market Share Analysis 2024
- 17.2. Company Profiles
- 17.2.1 Shell PLC
- 17.2.1.1. Overview
- 17.2.1.2. Products
- 17.2.1.3. SWOT Analysis
- 17.2.1.4. Recent Developments
- 17.2.1.5. Financials (Based on Availability)
- 17.2.2 Engie SA
- 17.2.2.1. Overview
- 17.2.2.2. Products
- 17.2.2.3. SWOT Analysis
- 17.2.2.4. Recent Developments
- 17.2.2.5. Financials (Based on Availability)
- 17.2.3 Fluor Corpoartion*List Not Exhaustive
- 17.2.3.1. Overview
- 17.2.3.2. Products
- 17.2.3.3. SWOT Analysis
- 17.2.3.4. Recent Developments
- 17.2.3.5. Financials (Based on Availability)
- 17.2.4 Weatherford International PLC
- 17.2.4.1. Overview
- 17.2.4.2. Products
- 17.2.4.3. SWOT Analysis
- 17.2.4.4. Recent Developments
- 17.2.4.5. Financials (Based on Availability)
- 17.2.5 Wartsila Oyj ABP
- 17.2.5.1. Overview
- 17.2.5.2. Products
- 17.2.5.3. SWOT Analysis
- 17.2.5.4. Recent Developments
- 17.2.5.5. Financials (Based on Availability)
- 17.2.6 Linde plc
- 17.2.6.1. Overview
- 17.2.6.2. Products
- 17.2.6.3. SWOT Analysis
- 17.2.6.4. Recent Developments
- 17.2.6.5. Financials (Based on Availability)
- 17.2.7 Baker Hughes Company
- 17.2.7.1. Overview
- 17.2.7.2. Products
- 17.2.7.3. SWOT Analysis
- 17.2.7.4. Recent Developments
- 17.2.7.5. Financials (Based on Availability)
- 17.2.8 Schlumberger Limited
- 17.2.8.1. Overview
- 17.2.8.2. Products
- 17.2.8.3. SWOT Analysis
- 17.2.8.4. Recent Developments
- 17.2.8.5. Financials (Based on Availability)
- 17.2.1 Shell PLC
List of Figures
- Figure 1: Global LNG Regasification Terminals Industry Revenue Breakdown (Million, %) by Region 2024 & 2032
- Figure 2: North America LNG Regasification Terminals Industry Revenue (Million), by Country 2024 & 2032
- Figure 3: North America LNG Regasification Terminals Industry Revenue Share (%), by Country 2024 & 2032
- Figure 4: Europe LNG Regasification Terminals Industry Revenue (Million), by Country 2024 & 2032
- Figure 5: Europe LNG Regasification Terminals Industry Revenue Share (%), by Country 2024 & 2032
- Figure 6: Asia Pacific LNG Regasification Terminals Industry Revenue (Million), by Country 2024 & 2032
- Figure 7: Asia Pacific LNG Regasification Terminals Industry Revenue Share (%), by Country 2024 & 2032
- Figure 8: South America LNG Regasification Terminals Industry Revenue (Million), by Country 2024 & 2032
- Figure 9: South America LNG Regasification Terminals Industry Revenue Share (%), by Country 2024 & 2032
- Figure 10: North America LNG Regasification Terminals Industry Revenue (Million), by Country 2024 & 2032
- Figure 11: North America LNG Regasification Terminals Industry Revenue Share (%), by Country 2024 & 2032
- Figure 12: MEA LNG Regasification Terminals Industry Revenue (Million), by Country 2024 & 2032
- Figure 13: MEA LNG Regasification Terminals Industry Revenue Share (%), by Country 2024 & 2032
- Figure 14: North America LNG Regasification Terminals Industry Revenue (Million), by Terminal Type 2024 & 2032
- Figure 15: North America LNG Regasification Terminals Industry Revenue Share (%), by Terminal Type 2024 & 2032
- Figure 16: North America LNG Regasification Terminals Industry Revenue (Million), by Deployment 2024 & 2032
- Figure 17: North America LNG Regasification Terminals Industry Revenue Share (%), by Deployment 2024 & 2032
- Figure 18: North America LNG Regasification Terminals Industry Revenue (Million), by Country 2024 & 2032
- Figure 19: North America LNG Regasification Terminals Industry Revenue Share (%), by Country 2024 & 2032
- Figure 20: South America LNG Regasification Terminals Industry Revenue (Million), by Terminal Type 2024 & 2032
- Figure 21: South America LNG Regasification Terminals Industry Revenue Share (%), by Terminal Type 2024 & 2032
- Figure 22: South America LNG Regasification Terminals Industry Revenue (Million), by Deployment 2024 & 2032
- Figure 23: South America LNG Regasification Terminals Industry Revenue Share (%), by Deployment 2024 & 2032
- Figure 24: South America LNG Regasification Terminals Industry Revenue (Million), by Country 2024 & 2032
- Figure 25: South America LNG Regasification Terminals Industry Revenue Share (%), by Country 2024 & 2032
- Figure 26: Asia Pacific LNG Regasification Terminals Industry Revenue (Million), by Terminal Type 2024 & 2032
- Figure 27: Asia Pacific LNG Regasification Terminals Industry Revenue Share (%), by Terminal Type 2024 & 2032
- Figure 28: Asia Pacific LNG Regasification Terminals Industry Revenue (Million), by Deployment 2024 & 2032
- Figure 29: Asia Pacific LNG Regasification Terminals Industry Revenue Share (%), by Deployment 2024 & 2032
- Figure 30: Asia Pacific LNG Regasification Terminals Industry Revenue (Million), by Country 2024 & 2032
- Figure 31: Asia Pacific LNG Regasification Terminals Industry Revenue Share (%), by Country 2024 & 2032
- Figure 32: Europe LNG Regasification Terminals Industry Revenue (Million), by Terminal Type 2024 & 2032
- Figure 33: Europe LNG Regasification Terminals Industry Revenue Share (%), by Terminal Type 2024 & 2032
- Figure 34: Europe LNG Regasification Terminals Industry Revenue (Million), by Deployment 2024 & 2032
- Figure 35: Europe LNG Regasification Terminals Industry Revenue Share (%), by Deployment 2024 & 2032
- Figure 36: Europe LNG Regasification Terminals Industry Revenue (Million), by Country 2024 & 2032
- Figure 37: Europe LNG Regasification Terminals Industry Revenue Share (%), by Country 2024 & 2032
- Figure 38: Middle East and Africa LNG Regasification Terminals Industry Revenue (Million), by Terminal Type 2024 & 2032
- Figure 39: Middle East and Africa LNG Regasification Terminals Industry Revenue Share (%), by Terminal Type 2024 & 2032
- Figure 40: Middle East and Africa LNG Regasification Terminals Industry Revenue (Million), by Deployment 2024 & 2032
- Figure 41: Middle East and Africa LNG Regasification Terminals Industry Revenue Share (%), by Deployment 2024 & 2032
- Figure 42: Middle East and Africa LNG Regasification Terminals Industry Revenue (Million), by Country 2024 & 2032
- Figure 43: Middle East and Africa LNG Regasification Terminals Industry Revenue Share (%), by Country 2024 & 2032
List of Tables
- Table 1: Global LNG Regasification Terminals Industry Revenue Million Forecast, by Region 2019 & 2032
- Table 2: Global LNG Regasification Terminals Industry Revenue Million Forecast, by Terminal Type 2019 & 2032
- Table 3: Global LNG Regasification Terminals Industry Revenue Million Forecast, by Deployment 2019 & 2032
- Table 4: Global LNG Regasification Terminals Industry Revenue Million Forecast, by Region 2019 & 2032
- Table 5: Global LNG Regasification Terminals Industry Revenue Million Forecast, by Country 2019 & 2032
- Table 6: United States LNG Regasification Terminals Industry Revenue (Million) Forecast, by Application 2019 & 2032
- Table 7: Canada LNG Regasification Terminals Industry Revenue (Million) Forecast, by Application 2019 & 2032
- Table 8: Mexico LNG Regasification Terminals Industry Revenue (Million) Forecast, by Application 2019 & 2032
- Table 9: Global LNG Regasification Terminals Industry Revenue Million Forecast, by Country 2019 & 2032
- Table 10: Germany LNG Regasification Terminals Industry Revenue (Million) Forecast, by Application 2019 & 2032
- Table 11: United Kingdom LNG Regasification Terminals Industry Revenue (Million) Forecast, by Application 2019 & 2032
- Table 12: France LNG Regasification Terminals Industry Revenue (Million) Forecast, by Application 2019 & 2032
- Table 13: Spain LNG Regasification Terminals Industry Revenue (Million) Forecast, by Application 2019 & 2032
- Table 14: Italy LNG Regasification Terminals Industry Revenue (Million) Forecast, by Application 2019 & 2032
- Table 15: Spain LNG Regasification Terminals Industry Revenue (Million) Forecast, by Application 2019 & 2032
- Table 16: Belgium LNG Regasification Terminals Industry Revenue (Million) Forecast, by Application 2019 & 2032
- Table 17: Netherland LNG Regasification Terminals Industry Revenue (Million) Forecast, by Application 2019 & 2032
- Table 18: Nordics LNG Regasification Terminals Industry Revenue (Million) Forecast, by Application 2019 & 2032
- Table 19: Rest of Europe LNG Regasification Terminals Industry Revenue (Million) Forecast, by Application 2019 & 2032
- Table 20: Global LNG Regasification Terminals Industry Revenue Million Forecast, by Country 2019 & 2032
- Table 21: China LNG Regasification Terminals Industry Revenue (Million) Forecast, by Application 2019 & 2032
- Table 22: Japan LNG Regasification Terminals Industry Revenue (Million) Forecast, by Application 2019 & 2032
- Table 23: India LNG Regasification Terminals Industry Revenue (Million) Forecast, by Application 2019 & 2032
- Table 24: South Korea LNG Regasification Terminals Industry Revenue (Million) Forecast, by Application 2019 & 2032
- Table 25: Southeast Asia LNG Regasification Terminals Industry Revenue (Million) Forecast, by Application 2019 & 2032
- Table 26: Australia LNG Regasification Terminals Industry Revenue (Million) Forecast, by Application 2019 & 2032
- Table 27: Indonesia LNG Regasification Terminals Industry Revenue (Million) Forecast, by Application 2019 & 2032
- Table 28: Phillipes LNG Regasification Terminals Industry Revenue (Million) Forecast, by Application 2019 & 2032
- Table 29: Singapore LNG Regasification Terminals Industry Revenue (Million) Forecast, by Application 2019 & 2032
- Table 30: Thailandc LNG Regasification Terminals Industry Revenue (Million) Forecast, by Application 2019 & 2032
- Table 31: Rest of Asia Pacific LNG Regasification Terminals Industry Revenue (Million) Forecast, by Application 2019 & 2032
- Table 32: Global LNG Regasification Terminals Industry Revenue Million Forecast, by Country 2019 & 2032
- Table 33: Brazil LNG Regasification Terminals Industry Revenue (Million) Forecast, by Application 2019 & 2032
- Table 34: Argentina LNG Regasification Terminals Industry Revenue (Million) Forecast, by Application 2019 & 2032
- Table 35: Peru LNG Regasification Terminals Industry Revenue (Million) Forecast, by Application 2019 & 2032
- Table 36: Chile LNG Regasification Terminals Industry Revenue (Million) Forecast, by Application 2019 & 2032
- Table 37: Colombia LNG Regasification Terminals Industry Revenue (Million) Forecast, by Application 2019 & 2032
- Table 38: Ecuador LNG Regasification Terminals Industry Revenue (Million) Forecast, by Application 2019 & 2032
- Table 39: Venezuela LNG Regasification Terminals Industry Revenue (Million) Forecast, by Application 2019 & 2032
- Table 40: Rest of South America LNG Regasification Terminals Industry Revenue (Million) Forecast, by Application 2019 & 2032
- Table 41: Global LNG Regasification Terminals Industry Revenue Million Forecast, by Country 2019 & 2032
- Table 42: United States LNG Regasification Terminals Industry Revenue (Million) Forecast, by Application 2019 & 2032
- Table 43: Canada LNG Regasification Terminals Industry Revenue (Million) Forecast, by Application 2019 & 2032
- Table 44: Mexico LNG Regasification Terminals Industry Revenue (Million) Forecast, by Application 2019 & 2032
- Table 45: Global LNG Regasification Terminals Industry Revenue Million Forecast, by Country 2019 & 2032
- Table 46: United Arab Emirates LNG Regasification Terminals Industry Revenue (Million) Forecast, by Application 2019 & 2032
- Table 47: Saudi Arabia LNG Regasification Terminals Industry Revenue (Million) Forecast, by Application 2019 & 2032
- Table 48: South Africa LNG Regasification Terminals Industry Revenue (Million) Forecast, by Application 2019 & 2032
- Table 49: Rest of Middle East and Africa LNG Regasification Terminals Industry Revenue (Million) Forecast, by Application 2019 & 2032
- Table 50: Global LNG Regasification Terminals Industry Revenue Million Forecast, by Terminal Type 2019 & 2032
- Table 51: Global LNG Regasification Terminals Industry Revenue Million Forecast, by Deployment 2019 & 2032
- Table 52: Global LNG Regasification Terminals Industry Revenue Million Forecast, by Country 2019 & 2032
- Table 53: Global LNG Regasification Terminals Industry Revenue Million Forecast, by Terminal Type 2019 & 2032
- Table 54: Global LNG Regasification Terminals Industry Revenue Million Forecast, by Deployment 2019 & 2032
- Table 55: Global LNG Regasification Terminals Industry Revenue Million Forecast, by Country 2019 & 2032
- Table 56: Global LNG Regasification Terminals Industry Revenue Million Forecast, by Terminal Type 2019 & 2032
- Table 57: Global LNG Regasification Terminals Industry Revenue Million Forecast, by Deployment 2019 & 2032
- Table 58: Global LNG Regasification Terminals Industry Revenue Million Forecast, by Country 2019 & 2032
- Table 59: Global LNG Regasification Terminals Industry Revenue Million Forecast, by Terminal Type 2019 & 2032
- Table 60: Global LNG Regasification Terminals Industry Revenue Million Forecast, by Deployment 2019 & 2032
- Table 61: Global LNG Regasification Terminals Industry Revenue Million Forecast, by Country 2019 & 2032
- Table 62: Global LNG Regasification Terminals Industry Revenue Million Forecast, by Terminal Type 2019 & 2032
- Table 63: Global LNG Regasification Terminals Industry Revenue Million Forecast, by Deployment 2019 & 2032
- Table 64: Global LNG Regasification Terminals Industry Revenue Million Forecast, by Country 2019 & 2032
Frequently Asked Questions
1. What is the projected Compound Annual Growth Rate (CAGR) of the LNG Regasification Terminals Industry?
The projected CAGR is approximately 5.60%.
2. Which companies are prominent players in the LNG Regasification Terminals Industry?
Key companies in the market include Shell PLC, Engie SA, Fluor Corpoartion*List Not Exhaustive, Weatherford International PLC, Wartsila Oyj ABP, Linde plc, Baker Hughes Company, Schlumberger Limited.
3. What are the main segments of the LNG Regasification Terminals Industry?
The market segments include Terminal Type, Deployment.
4. Can you provide details about the market size?
The market size is estimated to be USD XX Million as of 2022.
5. What are some drivers contributing to market growth?
4.; The Rise in Oil and Gas Drilling Activities4.; Increased Shale Gas Exploration.
6. What are the notable trends driving market growth?
The Floating Regasification Terminals Segment is Expected to Dominate the Market.
7. Are there any restraints impacting market growth?
4.; Increasing Share of Renewable Energy.
8. Can you provide examples of recent developments in the market?
In September 2021, South Africa's state-owned Central Energy Fund (CEF) and its partners, state-owned logistics firm Transnet and the Coega Development Corporation (CDC) joined together for establishing the country's first LNG import and distribution terminal at the Ngqura (Coega) deepwater port in the Eastern Cape. According to the joint committee, A floating storage and regasification unit (FSRU) has been identified as the preferred terminal configuration for LNG import and distribution
9. What pricing options are available for accessing the report?
Pricing options include single-user, multi-user, and enterprise licenses priced at USD 4750, USD 5250, and USD 8750 respectively.
10. Is the market size provided in terms of value or volume?
The market size is provided in terms of value, measured in Million.
11. Are there any specific market keywords associated with the report?
Yes, the market keyword associated with the report is "LNG Regasification Terminals Industry," which aids in identifying and referencing the specific market segment covered.
12. How do I determine which pricing option suits my needs best?
The pricing options vary based on user requirements and access needs. Individual users may opt for single-user licenses, while businesses requiring broader access may choose multi-user or enterprise licenses for cost-effective access to the report.
13. Are there any additional resources or data provided in the LNG Regasification Terminals Industry report?
While the report offers comprehensive insights, it's advisable to review the specific contents or supplementary materials provided to ascertain if additional resources or data are available.
14. How can I stay updated on further developments or reports in the LNG Regasification Terminals Industry?
To stay informed about further developments, trends, and reports in the LNG Regasification Terminals Industry, consider subscribing to industry newsletters, following relevant companies and organizations, or regularly checking reputable industry news sources and publications.
Methodology
Step 1 - Identification of Relevant Samples Size from Population Database


Step 2 - Approaches for Defining Global Market Size (Value, Volume* & Price*)

Note*: In applicable scenarios
Step 3 - Data Sources
Primary Research
- Web Analytics
- Survey Reports
- Research Institute
- Latest Research Reports
- Opinion Leaders
Secondary Research
- Annual Reports
- White Paper
- Latest Press Release
- Industry Association
- Paid Database
- Investor Presentations

Step 4 - Data Triangulation
Involves using different sources of information in order to increase the validity of a study
These sources are likely to be stakeholders in a program - participants, other researchers, program staff, other community members, and so on.
Then we put all data in single framework & apply various statistical tools to find out the dynamic on the market.
During the analysis stage, feedback from the stakeholder groups would be compared to determine areas of agreement as well as areas of divergence
