

Key Insights
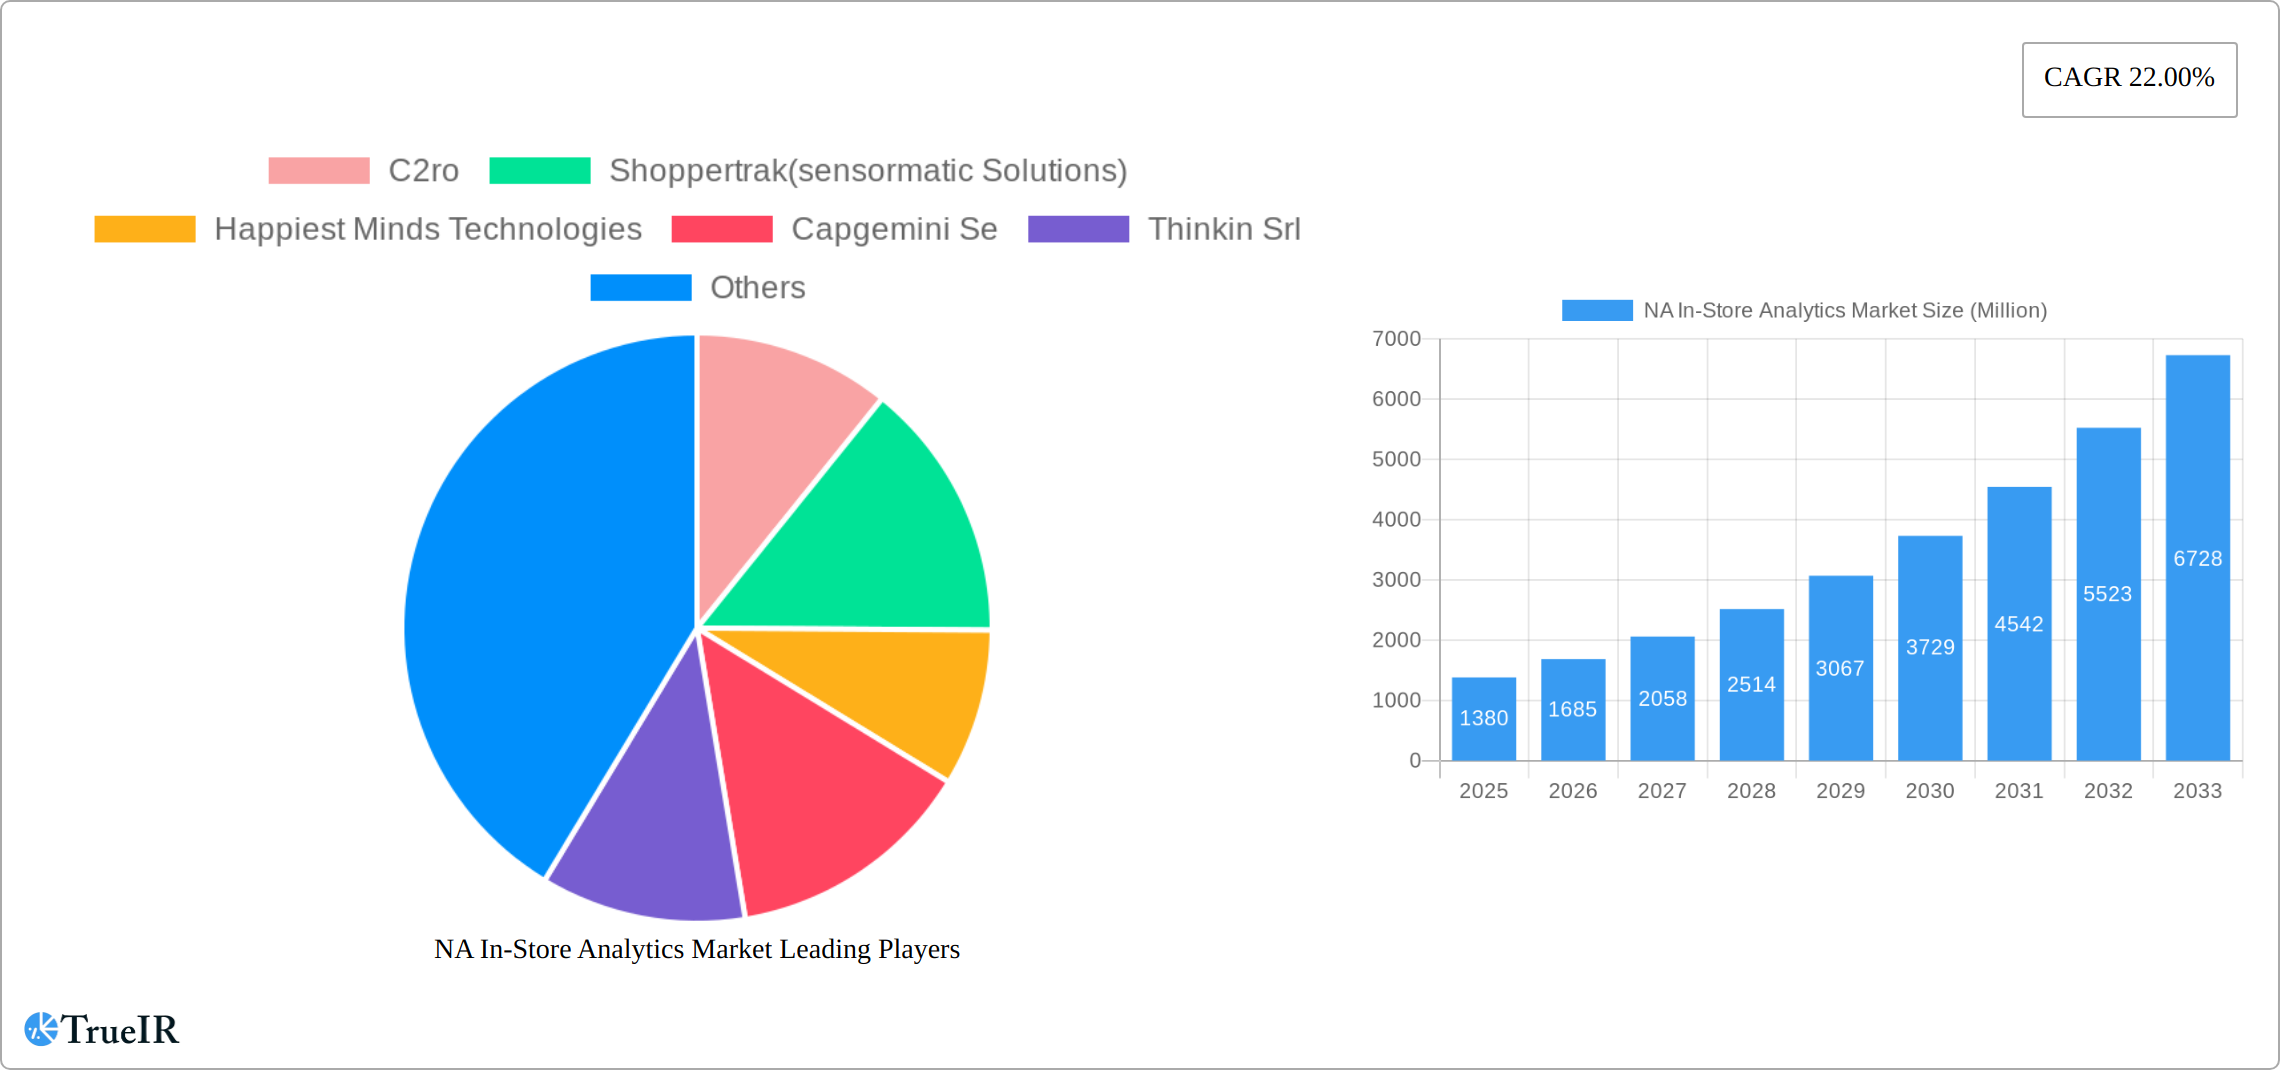
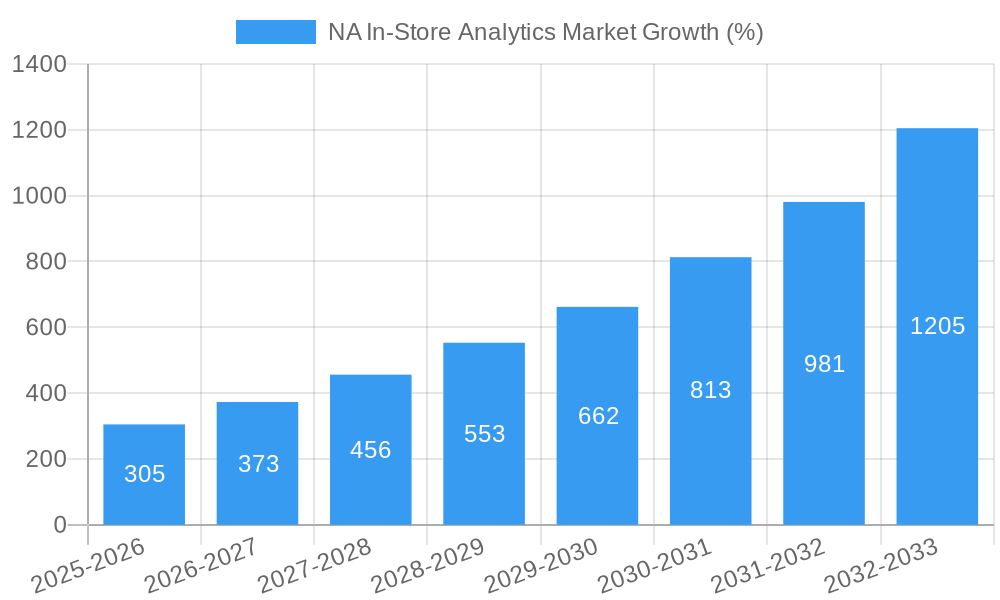
The North American in-store analytics market is experiencing robust growth, projected to reach $1.38 billion in 2025 and maintain a Compound Annual Growth Rate (CAGR) of 22% from 2025 to 2033. This expansion is driven by several key factors. Retailers are increasingly adopting data-driven strategies to optimize operations, enhance customer experiences, and improve profitability. The proliferation of advanced technologies, such as computer vision, AI, and IoT sensors, provides granular insights into shopper behavior, enabling more effective marketing campaigns, personalized promotions, and optimized store layouts. The shift towards cloud-based solutions offers scalability and cost-effectiveness, fueling market growth further. While on-premise solutions still hold a segment of the market, the flexibility and accessibility of cloud deployments are attracting more businesses, especially smaller and medium-sized enterprises (SMEs) seeking affordable analytics capabilities. Customer management, risk and compliance management, and store operation management represent significant application areas driving adoption. The competitive landscape features a mix of established players like SAP and Cisco, along with innovative startups offering specialized solutions, fostering innovation and competition.
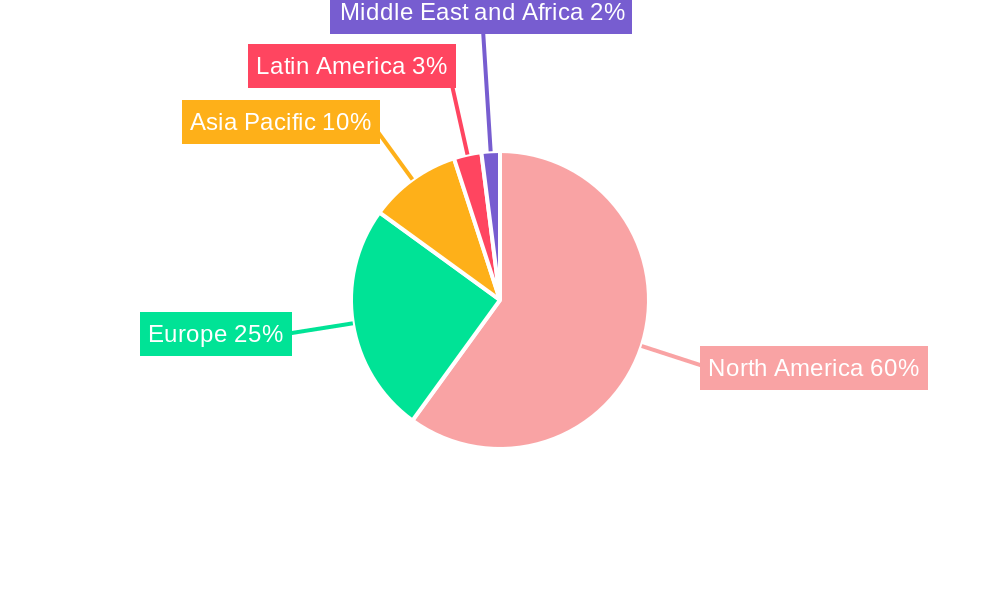
The continued growth of e-commerce and the increasing demand for seamless omnichannel experiences contribute to the market's expansion. Retailers are leveraging in-store analytics to bridge the gap between online and offline interactions, personalizing the in-store experience and gaining a competitive edge. While data privacy and security remain potential restraints, the industry is actively addressing these concerns with robust data governance frameworks and compliance measures. The North American market is expected to remain a significant contributor to global in-store analytics revenue, due to strong technological infrastructure and high retailer adoption rates. Future growth will likely be fueled by the integration of augmented reality (AR) and virtual reality (VR) technologies, enhancing customer engagement and offering immersive shopping experiences. The market is also expected to see increased use of predictive analytics, allowing retailers to anticipate customer behavior and optimize resource allocation proactively.
NA In-Store Analytics Market Report: 2019-2033
This comprehensive report provides a detailed analysis of the North American In-Store Analytics market, offering invaluable insights for businesses and investors seeking to navigate this dynamic landscape. Covering the period from 2019 to 2033, with a focus on 2025, this report offers a robust understanding of market size, segmentation, competitive dynamics, and future growth potential. The market is projected to reach xx Million by 2033, exhibiting a CAGR of xx% during the forecast period (2025-2033).
NA In-Store Analytics Market Market Structure & Competitive Landscape
The North American In-Store Analytics market is characterized by a moderately concentrated landscape, with several key players vying for market share. The market concentration ratio (CR4) is estimated at xx%, indicating the presence of both established players and emerging innovators. Innovation is a primary driver, with companies continuously developing advanced analytics solutions leveraging AI, machine learning, and IoT technologies. Regulatory changes regarding data privacy and security significantly impact market operations. Product substitutes, such as traditional market research methods, are gradually losing ground to the more efficient and data-rich solutions offered by in-store analytics.
The end-user segment is primarily comprised of large enterprises and small and medium enterprises (SMEs), with large enterprises accounting for a larger market share due to their greater investment capacity. Mergers and acquisitions (M&A) activity has been relatively moderate in recent years, with a total M&A volume of approximately xx deals in the past five years. However, strategic partnerships are increasingly common, reflecting a collaborative approach to market expansion. Key strategic partnerships and alliances are shaping the competitive landscape, driving innovation, and broadening market reach.
- Market Concentration: CR4 estimated at xx%
- Innovation Drivers: AI, Machine Learning, IoT
- Regulatory Impacts: Data privacy regulations (e.g., CCPA, GDPR)
- Product Substitutes: Traditional market research methods
- End-User Segmentation: Large Enterprises, SMEs
- M&A Trends: xx deals in the past five years, increasing strategic partnerships
NA In-Store Analytics Market Market Trends & Opportunities
The North American In-Store Analytics market is experiencing robust growth, fueled by several key trends. The market size is projected to reach xx Million in 2025, expanding to xx Million by 2033, exhibiting a strong CAGR. Technological advancements, particularly in AI and machine learning, are significantly enhancing the capabilities of in-store analytics solutions, enabling more accurate predictions and data-driven decision-making. Consumer preferences for personalized shopping experiences are driving demand for solutions that offer targeted marketing and improved customer service. The competitive landscape is characterized by both intense rivalry among established players and the emergence of innovative startups, fostering continuous improvement and product diversification. Market penetration rates are increasing steadily, particularly among large retail chains adopting comprehensive data-driven strategies. The growing adoption of cloud-based solutions is further fueling market expansion, offering scalability and cost-effectiveness.
Dominant Markets & Segments in NA In-Store Analytics Market
The United States constitutes the largest market for in-store analytics in North America, driven by its large retail sector and high adoption of advanced technologies. The software segment holds the largest market share within the component category, owing to its crucial role in processing and analyzing data. Cloud deployment is gaining traction, offering flexibility and scalability compared to on-premise solutions. Large enterprises dominate the market, reflecting their higher investment capacity. Customer management and store operation management applications are the leading application segments, driven by the need to optimize customer experience and operational efficiency.
- Leading Region: United States
- Leading Component Segment: Software
- Leading Deployment Segment: Cloud
- Leading Organization Size Segment: Large Enterprises
- Leading Application Segments: Customer Management, Store Operation Management
Key Growth Drivers for the United States Market:
- Robust retail sector and high consumer spending.
- Early adoption of advanced technologies and digital transformation initiatives within retail businesses.
- Strong government support for technological advancements and digitalization.
- Availability of skilled workforce and robust IT infrastructure.
NA In-Store Analytics Market Product Analysis
Product innovations in the in-store analytics market are primarily driven by advancements in AI, machine learning, and computer vision. These technologies enable more accurate and insightful data analysis, improving predictive capabilities for sales forecasting, inventory management, and customer behavior. New products incorporate features like real-time data visualization, predictive analytics, and personalized recommendations, offering significant competitive advantages. The market fit for these advanced solutions is strong, particularly among retailers seeking to optimize operations, enhance customer experience, and gain a competitive edge.
Key Drivers, Barriers & Challenges in NA In-Store Analytics Market
Key Drivers:
The market is propelled by the increasing need for data-driven decision-making in retail, the rising adoption of cloud-based solutions, and the continuous advancements in AI and machine learning technologies that enhance the accuracy and efficiency of in-store analytics. Government initiatives promoting digitalization in the retail sector also contribute to market growth.
Key Barriers and Challenges:
High implementation costs, data privacy and security concerns, and the lack of skilled professionals capable of effectively implementing and interpreting in-store analytics solutions pose significant challenges to market growth. Furthermore, integration complexities with existing retail systems can impede broader adoption, while competition from established players and emerging startups keeps pressure on pricing and innovation.
Growth Drivers in the NA In-Store Analytics Market Market
Technological advancements, especially in AI and machine learning, are paramount in driving market growth. The increasing demand for personalized customer experiences and optimized store operations further fuels this expansion. Favorable government regulations and incentives promoting digitalization in the retail sector contribute significantly.
Challenges Impacting NA In-Store Analytics Market Growth
High initial investment costs, concerns regarding data security and privacy, and integration complexities with existing systems pose major challenges. The need for specialized expertise to manage and interpret data represents another hurdle. Intense competition also pressures pricing and necessitates continuous innovation.
Key Players Shaping the NA In-Store Analytics Market Market
- C2ro
- Shoppertrak (sensormatic Solutions)
- Happiest Minds Technologies
- Capgemini SE
- Thinkin Srl
- Retailnext Inc
- Cisco Meraki (Cisco Systems Inc)
- Cloud4wi Inc
- Capillary Technologies
- Amoobi
- Analytiks AI
- SAP SE
- Trax Image Recognition
Significant NA In-Store Analytics Market Industry Milestones
- July 2023: Acosta and Pensa Systems partner to enhance retail shelf visibility and boost revenue growth for CPG retailers and brands.
- January 2023: Google Cloud launches AI technologies to automate in-store inventory checks and improve e-commerce experiences for retailers.
Future Outlook for NA In-Store Analytics Market Market
The NA In-Store Analytics market is poised for continued growth, driven by ongoing technological advancements, increasing demand for data-driven decision-making, and the expanding adoption of cloud-based solutions. Strategic opportunities abound for companies offering innovative solutions that address the challenges of data privacy, security, and system integration. The market's future potential is significant, with ample room for expansion in both established and emerging segments.
NA In-Store Analytics Market Segmentation
-
1. Component
- 1.1. Software
- 1.2. Services
-
2. Deployment
- 2.1. Cloud
- 2.2. On-premise
-
3. Organization Size
- 3.1. Large Enterprises
- 3.2. Small and Medium Enterprises
-
4. Application
- 4.1. Customer Management
- 4.2. Risk and Compliance Management
- 4.3. Store Operation Management
- 4.4. Marketing and Merchandizing
- 4.5. Other Applications
NA In-Store Analytics Market Segmentation By Geography
-
1. North America
- 1.1. United States
- 1.2. Canada
- 1.3. Mexico
NA In-Store Analytics Market REPORT HIGHLIGHTS
| Aspects | Details |
|---|---|
| Study Period | 2019-2033 |
| Base Year | 2024 |
| Estimated Year | 2025 |
| Forecast Period | 2025-2033 |
| Historical Period | 2019-2024 |
| Growth Rate | CAGR of 22.00% from 2019-2033 |
| Segmentation |
|
Table of Contents
- 1. Introduction
- 1.1. Research Scope
- 1.2. Market Segmentation
- 1.3. Research Methodology
- 1.4. Definitions and Assumptions
- 2. Executive Summary
- 2.1. Introduction
- 3. Market Dynamics
- 3.1. Introduction
- 3.2. Market Drivers
- 3.2.1. Increasing Data Volume In In-store Operations; Need For Better Customer Service And Enhanced Shopping Experience
- 3.3. Market Restrains
- 3.3.1. Lack of Personnel Skills
- 3.4. Market Trends
- 3.4.1. Store Operation Management to Exhibit Good Growth Over the Forecast Period
- 4. Market Factor Analysis
- 4.1. Porters Five Forces
- 4.2. Supply/Value Chain
- 4.3. PESTEL analysis
- 4.4. Market Entropy
- 4.5. Patent/Trademark Analysis
- 5. NA In-Store Analytics Market Analysis, Insights and Forecast, 2019-2031
- 5.1. Market Analysis, Insights and Forecast - by Component
- 5.1.1. Software
- 5.1.2. Services
- 5.2. Market Analysis, Insights and Forecast - by Deployment
- 5.2.1. Cloud
- 5.2.2. On-premise
- 5.3. Market Analysis, Insights and Forecast - by Organization Size
- 5.3.1. Large Enterprises
- 5.3.2. Small and Medium Enterprises
- 5.4. Market Analysis, Insights and Forecast - by Application
- 5.4.1. Customer Management
- 5.4.2. Risk and Compliance Management
- 5.4.3. Store Operation Management
- 5.4.4. Marketing and Merchandizing
- 5.4.5. Other Applications
- 5.5. Market Analysis, Insights and Forecast - by Region
- 5.5.1. North America
- 5.1. Market Analysis, Insights and Forecast - by Component
- 6. North America NA In-Store Analytics Market Analysis, Insights and Forecast, 2019-2031
- 6.1. Market Analysis, Insights and Forecast - By Country/Sub-region
- 6.1.1.
- 7. Europe NA In-Store Analytics Market Analysis, Insights and Forecast, 2019-2031
- 7.1. Market Analysis, Insights and Forecast - By Country/Sub-region
- 7.1.1.
- 8. Asia Pacific NA In-Store Analytics Market Analysis, Insights and Forecast, 2019-2031
- 8.1. Market Analysis, Insights and Forecast - By Country/Sub-region
- 8.1.1.
- 9. Latin America NA In-Store Analytics Market Analysis, Insights and Forecast, 2019-2031
- 9.1. Market Analysis, Insights and Forecast - By Country/Sub-region
- 9.1.1.
- 10. Middle East and Africa NA In-Store Analytics Market Analysis, Insights and Forecast, 2019-2031
- 10.1. Market Analysis, Insights and Forecast - By Country/Sub-region
- 10.1.1.
- 11. Competitive Analysis
- 11.1. Market Share Analysis 2024
- 11.2. Company Profiles
- 11.2.1 C2ro
- 11.2.1.1. Overview
- 11.2.1.2. Products
- 11.2.1.3. SWOT Analysis
- 11.2.1.4. Recent Developments
- 11.2.1.5. Financials (Based on Availability)
- 11.2.2 Shoppertrak(sensormatic Solutions)
- 11.2.2.1. Overview
- 11.2.2.2. Products
- 11.2.2.3. SWOT Analysis
- 11.2.2.4. Recent Developments
- 11.2.2.5. Financials (Based on Availability)
- 11.2.3 Happiest Minds Technologies
- 11.2.3.1. Overview
- 11.2.3.2. Products
- 11.2.3.3. SWOT Analysis
- 11.2.3.4. Recent Developments
- 11.2.3.5. Financials (Based on Availability)
- 11.2.4 Capgemini Se
- 11.2.4.1. Overview
- 11.2.4.2. Products
- 11.2.4.3. SWOT Analysis
- 11.2.4.4. Recent Developments
- 11.2.4.5. Financials (Based on Availability)
- 11.2.5 Thinkin Srl
- 11.2.5.1. Overview
- 11.2.5.2. Products
- 11.2.5.3. SWOT Analysis
- 11.2.5.4. Recent Developments
- 11.2.5.5. Financials (Based on Availability)
- 11.2.6 Retailnext Inc
- 11.2.6.1. Overview
- 11.2.6.2. Products
- 11.2.6.3. SWOT Analysis
- 11.2.6.4. Recent Developments
- 11.2.6.5. Financials (Based on Availability)
- 11.2.7 Cisco Meraki (Cisco Systems Inc )
- 11.2.7.1. Overview
- 11.2.7.2. Products
- 11.2.7.3. SWOT Analysis
- 11.2.7.4. Recent Developments
- 11.2.7.5. Financials (Based on Availability)
- 11.2.8 Cloud4wi Inc
- 11.2.8.1. Overview
- 11.2.8.2. Products
- 11.2.8.3. SWOT Analysis
- 11.2.8.4. Recent Developments
- 11.2.8.5. Financials (Based on Availability)
- 11.2.9 Capillary Technologies
- 11.2.9.1. Overview
- 11.2.9.2. Products
- 11.2.9.3. SWOT Analysis
- 11.2.9.4. Recent Developments
- 11.2.9.5. Financials (Based on Availability)
- 11.2.10 Amoobi
- 11.2.10.1. Overview
- 11.2.10.2. Products
- 11.2.10.3. SWOT Analysis
- 11.2.10.4. Recent Developments
- 11.2.10.5. Financials (Based on Availability)
- 11.2.11 Analytiks AI
- 11.2.11.1. Overview
- 11.2.11.2. Products
- 11.2.11.3. SWOT Analysis
- 11.2.11.4. Recent Developments
- 11.2.11.5. Financials (Based on Availability)
- 11.2.12 SAP SE
- 11.2.12.1. Overview
- 11.2.12.2. Products
- 11.2.12.3. SWOT Analysis
- 11.2.12.4. Recent Developments
- 11.2.12.5. Financials (Based on Availability)
- 11.2.13 Trax Image Recognition
- 11.2.13.1. Overview
- 11.2.13.2. Products
- 11.2.13.3. SWOT Analysis
- 11.2.13.4. Recent Developments
- 11.2.13.5. Financials (Based on Availability)
- 11.2.1 C2ro
List of Figures
- Figure 1: NA In-Store Analytics Market Revenue Breakdown (Million, %) by Product 2024 & 2032
- Figure 2: NA In-Store Analytics Market Share (%) by Company 2024
List of Tables
- Table 1: NA In-Store Analytics Market Revenue Million Forecast, by Region 2019 & 2032
- Table 2: NA In-Store Analytics Market Volume K Unit Forecast, by Region 2019 & 2032
- Table 3: NA In-Store Analytics Market Revenue Million Forecast, by Component 2019 & 2032
- Table 4: NA In-Store Analytics Market Volume K Unit Forecast, by Component 2019 & 2032
- Table 5: NA In-Store Analytics Market Revenue Million Forecast, by Deployment 2019 & 2032
- Table 6: NA In-Store Analytics Market Volume K Unit Forecast, by Deployment 2019 & 2032
- Table 7: NA In-Store Analytics Market Revenue Million Forecast, by Organization Size 2019 & 2032
- Table 8: NA In-Store Analytics Market Volume K Unit Forecast, by Organization Size 2019 & 2032
- Table 9: NA In-Store Analytics Market Revenue Million Forecast, by Application 2019 & 2032
- Table 10: NA In-Store Analytics Market Volume K Unit Forecast, by Application 2019 & 2032
- Table 11: NA In-Store Analytics Market Revenue Million Forecast, by Region 2019 & 2032
- Table 12: NA In-Store Analytics Market Volume K Unit Forecast, by Region 2019 & 2032
- Table 13: NA In-Store Analytics Market Revenue Million Forecast, by Country 2019 & 2032
- Table 14: NA In-Store Analytics Market Volume K Unit Forecast, by Country 2019 & 2032
- Table 15: NA In-Store Analytics Market Revenue (Million) Forecast, by Application 2019 & 2032
- Table 16: NA In-Store Analytics Market Volume (K Unit) Forecast, by Application 2019 & 2032
- Table 17: NA In-Store Analytics Market Revenue Million Forecast, by Country 2019 & 2032
- Table 18: NA In-Store Analytics Market Volume K Unit Forecast, by Country 2019 & 2032
- Table 19: NA In-Store Analytics Market Revenue (Million) Forecast, by Application 2019 & 2032
- Table 20: NA In-Store Analytics Market Volume (K Unit) Forecast, by Application 2019 & 2032
- Table 21: NA In-Store Analytics Market Revenue Million Forecast, by Country 2019 & 2032
- Table 22: NA In-Store Analytics Market Volume K Unit Forecast, by Country 2019 & 2032
- Table 23: NA In-Store Analytics Market Revenue (Million) Forecast, by Application 2019 & 2032
- Table 24: NA In-Store Analytics Market Volume (K Unit) Forecast, by Application 2019 & 2032
- Table 25: NA In-Store Analytics Market Revenue Million Forecast, by Country 2019 & 2032
- Table 26: NA In-Store Analytics Market Volume K Unit Forecast, by Country 2019 & 2032
- Table 27: NA In-Store Analytics Market Revenue (Million) Forecast, by Application 2019 & 2032
- Table 28: NA In-Store Analytics Market Volume (K Unit) Forecast, by Application 2019 & 2032
- Table 29: NA In-Store Analytics Market Revenue Million Forecast, by Country 2019 & 2032
- Table 30: NA In-Store Analytics Market Volume K Unit Forecast, by Country 2019 & 2032
- Table 31: NA In-Store Analytics Market Revenue (Million) Forecast, by Application 2019 & 2032
- Table 32: NA In-Store Analytics Market Volume (K Unit) Forecast, by Application 2019 & 2032
- Table 33: NA In-Store Analytics Market Revenue Million Forecast, by Component 2019 & 2032
- Table 34: NA In-Store Analytics Market Volume K Unit Forecast, by Component 2019 & 2032
- Table 35: NA In-Store Analytics Market Revenue Million Forecast, by Deployment 2019 & 2032
- Table 36: NA In-Store Analytics Market Volume K Unit Forecast, by Deployment 2019 & 2032
- Table 37: NA In-Store Analytics Market Revenue Million Forecast, by Organization Size 2019 & 2032
- Table 38: NA In-Store Analytics Market Volume K Unit Forecast, by Organization Size 2019 & 2032
- Table 39: NA In-Store Analytics Market Revenue Million Forecast, by Application 2019 & 2032
- Table 40: NA In-Store Analytics Market Volume K Unit Forecast, by Application 2019 & 2032
- Table 41: NA In-Store Analytics Market Revenue Million Forecast, by Country 2019 & 2032
- Table 42: NA In-Store Analytics Market Volume K Unit Forecast, by Country 2019 & 2032
- Table 43: United States NA In-Store Analytics Market Revenue (Million) Forecast, by Application 2019 & 2032
- Table 44: United States NA In-Store Analytics Market Volume (K Unit) Forecast, by Application 2019 & 2032
- Table 45: Canada NA In-Store Analytics Market Revenue (Million) Forecast, by Application 2019 & 2032
- Table 46: Canada NA In-Store Analytics Market Volume (K Unit) Forecast, by Application 2019 & 2032
- Table 47: Mexico NA In-Store Analytics Market Revenue (Million) Forecast, by Application 2019 & 2032
- Table 48: Mexico NA In-Store Analytics Market Volume (K Unit) Forecast, by Application 2019 & 2032
Frequently Asked Questions
1. What is the projected Compound Annual Growth Rate (CAGR) of the NA In-Store Analytics Market?
The projected CAGR is approximately 22.00%.
2. Which companies are prominent players in the NA In-Store Analytics Market?
Key companies in the market include C2ro, Shoppertrak(sensormatic Solutions), Happiest Minds Technologies, Capgemini Se, Thinkin Srl, Retailnext Inc, Cisco Meraki (Cisco Systems Inc ), Cloud4wi Inc, Capillary Technologies, Amoobi, Analytiks AI, SAP SE, Trax Image Recognition.
3. What are the main segments of the NA In-Store Analytics Market?
The market segments include Component, Deployment, Organization Size, Application.
4. Can you provide details about the market size?
The market size is estimated to be USD 1.38 Million as of 2022.
5. What are some drivers contributing to market growth?
Increasing Data Volume In In-store Operations; Need For Better Customer Service And Enhanced Shopping Experience.
6. What are the notable trends driving market growth?
Store Operation Management to Exhibit Good Growth Over the Forecast Period.
7. Are there any restraints impacting market growth?
Lack of Personnel Skills.
8. Can you provide examples of recent developments in the market?
July 2023 - Acosta, an Acosta Group agency and a provider of commerce-centric solutions for the modern marketplace to retailers, brands, and foodservice providers, and Pensa Systems, a provider of digital retail shelf inventory management solutions, have partnered to boost revenue growth for CPG retailers and brands with highly accurate retail shelf visibility, strategic business insights as well as in-store execution. The shelf intelligence of the Pensa brand is being integrated into this new partnership by Acosta's analytics, in-store data collection, business intelligence, and merchandising solutions for all retailers on the market.
9. What pricing options are available for accessing the report?
Pricing options include single-user, multi-user, and enterprise licenses priced at USD 4750, USD 4950, and USD 6800 respectively.
10. Is the market size provided in terms of value or volume?
The market size is provided in terms of value, measured in Million and volume, measured in K Unit.
11. Are there any specific market keywords associated with the report?
Yes, the market keyword associated with the report is "NA In-Store Analytics Market," which aids in identifying and referencing the specific market segment covered.
12. How do I determine which pricing option suits my needs best?
The pricing options vary based on user requirements and access needs. Individual users may opt for single-user licenses, while businesses requiring broader access may choose multi-user or enterprise licenses for cost-effective access to the report.
13. Are there any additional resources or data provided in the NA In-Store Analytics Market report?
While the report offers comprehensive insights, it's advisable to review the specific contents or supplementary materials provided to ascertain if additional resources or data are available.
14. How can I stay updated on further developments or reports in the NA In-Store Analytics Market?
To stay informed about further developments, trends, and reports in the NA In-Store Analytics Market, consider subscribing to industry newsletters, following relevant companies and organizations, or regularly checking reputable industry news sources and publications.
Methodology
Step 1 - Identification of Relevant Samples Size from Population Database


Step 2 - Approaches for Defining Global Market Size (Value, Volume* & Price*)

Note*: In applicable scenarios
Step 3 - Data Sources
Primary Research
- Web Analytics
- Survey Reports
- Research Institute
- Latest Research Reports
- Opinion Leaders
Secondary Research
- Annual Reports
- White Paper
- Latest Press Release
- Industry Association
- Paid Database
- Investor Presentations

Step 4 - Data Triangulation
Involves using different sources of information in order to increase the validity of a study
These sources are likely to be stakeholders in a program - participants, other researchers, program staff, other community members, and so on.
Then we put all data in single framework & apply various statistical tools to find out the dynamic on the market.
During the analysis stage, feedback from the stakeholder groups would be compared to determine areas of agreement as well as areas of divergence
