

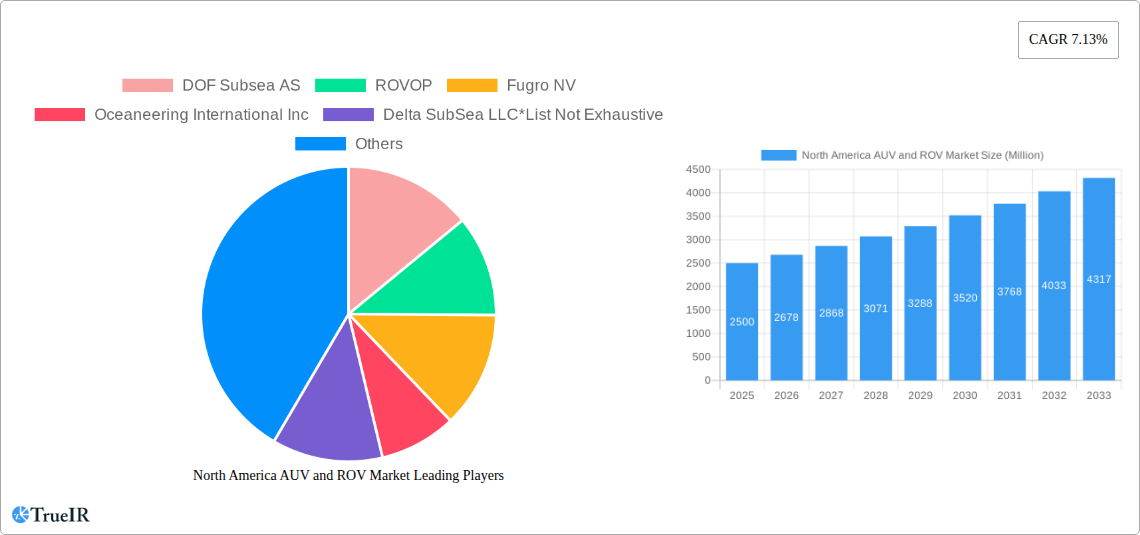
Key Insights
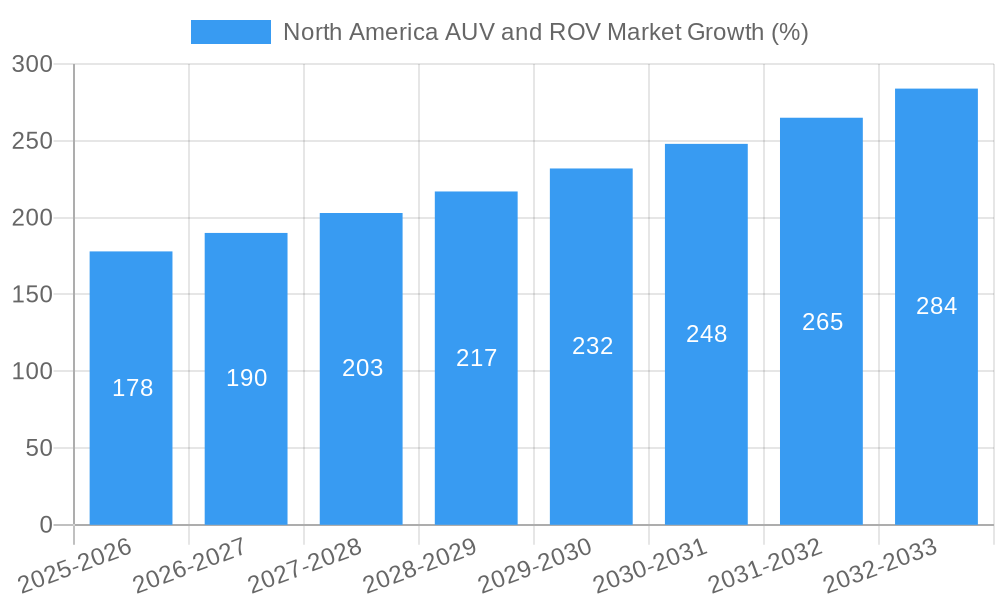
The North American AUV (Autonomous Underwater Vehicle) and ROV (Remotely Operated Vehicle) market is experiencing robust growth, driven by increasing offshore energy exploration and production activities, coupled with rising demand for subsea infrastructure inspection and maintenance. The market, encompassing work-class and observatory-class vehicles used in oil and gas, defense, and other applications (such as research and environmental monitoring), is projected to maintain a healthy Compound Annual Growth Rate (CAGR) above the global average of 7.13% throughout the forecast period (2025-2033). Specific segments within this market show varying growth trajectories. For instance, the demand for AUVs is anticipated to outpace ROV growth due to advancements in autonomous navigation and sensor technologies, leading to increased efficiency and reduced operational costs for tasks like seabed mapping and pipeline inspection. The Oil and Gas sector currently dominates the market share, but the defense and other applications segments are expected to show significant expansion as unmanned underwater systems are increasingly integrated into military operations and scientific research. The United States, with its extensive coastline and substantial offshore energy resources, represents the largest national market within North America, followed by Canada and Mexico.
Growth is further fueled by technological innovations such as improved battery technology, enhanced sensor capabilities, and the integration of Artificial Intelligence (AI) for improved decision-making and operational autonomy. However, high initial investment costs associated with purchasing and deploying AUV and ROV systems, along with the need for skilled personnel for operation and maintenance, pose some constraints. Nevertheless, the long-term benefits of increased efficiency, reduced operational risks, and improved data acquisition are expected to outweigh these challenges. The market is highly competitive, with several key players like DOF Subsea AS, ROVOP, and Oceaneering International Inc. vying for market share through technological advancements, strategic partnerships, and geographic expansion. Future growth is predicted to be further stimulated by increasing government investments in underwater technologies for both civilian and defense applications.
North America AUV and ROV Market: A Comprehensive Market Report (2019-2033)
This in-depth report provides a comprehensive analysis of the North America AUV and ROV market, offering invaluable insights into market dynamics, competitive landscapes, and future growth prospects. Spanning the period from 2019 to 2033, with a base year of 2025, this report is an essential resource for industry stakeholders, investors, and researchers seeking to understand and capitalize on the opportunities within this rapidly evolving sector. The market is segmented by vehicle type (ROV, AUV), vehicle class (work-class, observatory-class), application (oil and gas, defense, other), and activity (drilling & development, construction, inspection, repair & maintenance, decommissioning, other). The report incorporates data from key players such as DOF Subsea AS, ROVOP, Fugro NV, Oceaneering International Inc, Delta SubSea LLC, Saipem SpA, DeepOcean AS, Helix Energy Solutions Group, Forum Energy Technologies Inc, and TechnipFMC PLC, but the list is not exhaustive. The total market value is projected to reach xx Million by 2033.
North America AUV and ROV Market Market Structure & Competitive Landscape
The North America AUV and ROV market exhibits a moderately consolidated structure, with a few dominant players and a larger number of smaller, specialized firms. The Herfindahl-Hirschman Index (HHI) for the market in 2024 is estimated at xx, indicating a moderately concentrated market. Innovation is a key driver, with continuous advancements in sensor technology, autonomy, and control systems. Regulatory frameworks, particularly concerning safety and environmental impact, significantly influence market operations. Product substitutes, such as remotely operated surface vessels (ROSVs) and specialized drones, pose a degree of competitive pressure. The end-user segmentation is diverse, encompassing oil and gas companies, defense agencies, research institutions, and commercial entities. M&A activity has been relatively moderate in recent years, with xx deals recorded between 2019 and 2024, primarily driven by the consolidation efforts of larger players seeking to expand their service offerings and geographical reach.
- Market Concentration: Moderately consolidated (HHI: xx in 2024)
- Innovation Drivers: Sensor technology, autonomy, control systems
- Regulatory Impacts: Safety and environmental regulations
- Product Substitutes: ROSVs, specialized drones
- End-User Segmentation: Oil & Gas, Defense, Research, Commercial
- M&A Trends: xx deals between 2019 and 2024, driven by consolidation
North America AUV and ROV Market Market Trends & Opportunities
The North America AUV and ROV market is experiencing robust growth, driven by increasing demand across various sectors. The market size is projected to grow at a Compound Annual Growth Rate (CAGR) of xx% from 2025 to 2033, reaching xx Million by the end of the forecast period. Significant technological advancements are transforming the industry, including the integration of Artificial Intelligence (AI) for enhanced autonomy and improved data analysis capabilities. Growing preference for non-destructive inspection and maintenance techniques is further fueling market expansion. Competitive dynamics are characterized by intense rivalry, particularly among major players seeking to secure contracts for large-scale projects. Market penetration rates are currently estimated at xx% for ROVs and xx% for AUVs, with substantial untapped potential in various application areas such as offshore renewable energy. The market is witnessing a shift towards more advanced, hybrid systems combining the strengths of both AUVs and ROVs. The increasing demand for underwater inspection and maintenance in the offshore wind energy sector presents substantial opportunities for market expansion.
Dominant Markets & Segments in North America AUV and ROV Market
The Gulf of Mexico region currently holds the largest market share within North America, driven by significant oil and gas exploration and production activities. Within the vehicle type segment, ROVs maintain a larger market share compared to AUVs, primarily due to their versatility and established track record in diverse applications. Within the vehicle class segment, the demand for work-class vehicles significantly surpasses that of observatory-class vehicles, driven by the need for robust, high-capacity systems capable of handling complex tasks.
- Key Growth Drivers for the Gulf of Mexico: Significant oil & gas operations, robust infrastructure, established industry presence.
- Key Growth Drivers for ROVs: Versatility, established track record, suitability for diverse tasks.
- Key Growth Drivers for Work-Class Vehicles: High capacity, ability to handle complex tasks, suitability for demanding environments.
- Oil & Gas Application: This segment is projected to maintain its dominance due to continuous offshore exploration and production activities. Growing focus on subsea infrastructure maintenance and decommissioning also contributes to this segment's dominance.
- Defense Application: The defense sector presents significant growth opportunities, driven by increased investments in underwater surveillance and mine countermeasure operations.
North America AUV and ROV Market Product Analysis
Recent product innovations focus on improving maneuverability, payload capacity, and sensor integration, enhancing the capabilities of both ROVs and AUVs. Key advancements include improved underwater positioning systems, AI-powered navigation systems, and more advanced manipulator arms. The market is witnessing a move towards smaller, more agile vehicles suitable for confined spaces and intricate tasks, alongside larger vehicles for deep-sea exploration and complex operations. These technological advancements are enhancing the operational efficiency, data collection capabilities, and cost-effectiveness of these vehicles, thereby improving their market fit.
Key Drivers, Barriers & Challenges in North America AUV and ROV Market
Key Drivers: Technological advancements (AI, improved sensors), increasing offshore energy exploration, rising demand for underwater infrastructure inspection and maintenance, and government investment in defense and oceanographic research. For example, the increasing adoption of AI in AUV navigation is significantly improving operational efficiency.
Challenges: High initial investment costs, limited skilled labor, stringent regulatory compliance requirements, and potential supply chain disruptions could hinder market growth. These factors could result in project delays and increased operational costs, particularly impacting smaller companies and projects. The impact of these challenges can be quantified through decreased market penetration rates and prolonged project timelines.
Growth Drivers in the North America AUV and ROV Market Market
The growth of the North American AUV and ROV market is primarily driven by technological advancements in autonomy and sensor technology, increased demand from the offshore oil and gas industry, and growing interest in subsea infrastructure inspection and maintenance. Government funding for defense and research initiatives also plays a substantial role.
Challenges Impacting North America AUV and ROV Market Growth
Challenges include high capital expenditures required for AUV and ROV acquisition and operation, a limited pool of skilled personnel, rigorous regulatory compliance, and potential supply chain disruptions. These factors can lead to project delays, increased costs, and reduced market penetration.
Key Players Shaping the North America AUV and ROV Market Market
- DOF Subsea AS
- ROVOP
- Fugro NV
- Oceaneering International Inc
- Delta SubSea LLC
- Saipem SpA
- DeepOcean AS
- Helix Energy Solutions Group
- Forum Energy Technologies Inc
- TechnipFMC PLC
Significant North America AUV and ROV Market Industry Milestones
- August 2022: VideoRay, LLC, received a large order for its Defender ROVs from the United States Navy, signifying increased adoption of advanced ROV technology in the defense sector.
- March 2021: Oceaneering International, Inc. secured a significant contract for ROV services in the Gulf of Mexico, highlighting the continued demand for ROVs in oil and gas operations.
Future Outlook for North America AUV and ROV Market Market
The North America AUV and ROV market is poised for continued expansion, driven by technological advancements, growing demand across various sectors, and increasing government investment in underwater exploration and defense. Strategic partnerships and collaborations among industry players are anticipated to further accelerate market growth. The expansion of the offshore renewable energy sector, particularly wind power, presents significant growth opportunities. The market is expected to witness the emergence of innovative solutions, such as hybrid AUV/ROV systems and AI-powered autonomous vehicles, driving operational efficiency and cost reduction.
North America AUV and ROV Market Segmentation
-
1. Vehicle Type
- 1.1. ROV
- 1.2. AUV
-
2. Vehicle Class
- 2.1. Work-class Vehicle
- 2.2. Observatory-class Vehicle
-
3. Application
- 3.1. Oil and Gas
- 3.2. Defense
- 3.3. Other Applications
-
4. Activity
- 4.1. Drilling and Development
- 4.2. Construction
- 4.3. Inspection, Repair, and Maintenance
- 4.4. Decommissioning
- 4.5. Other Activities
-
5. Geography
- 5.1. United States
- 5.2. Canada
- 5.3. Rest of North America
North America AUV and ROV Market Segmentation By Geography
- 1. United States
- 2. Canada
- 3. Rest of North America
North America AUV and ROV Market REPORT HIGHLIGHTS
| Aspects | Details |
|---|---|
| Study Period | 2019-2033 |
| Base Year | 2024 |
| Estimated Year | 2025 |
| Forecast Period | 2025-2033 |
| Historical Period | 2019-2024 |
| Growth Rate | CAGR of 7.13% from 2019-2033 |
| Segmentation |
|
Table of Contents
- 1. Introduction
- 1.1. Research Scope
- 1.2. Market Segmentation
- 1.3. Research Methodology
- 1.4. Definitions and Assumptions
- 2. Executive Summary
- 2.1. Introduction
- 3. Market Dynamics
- 3.1. Introduction
- 3.2. Market Drivers
- 3.2.1 Increasing Offshore Oil and Gas Exploration Activities in the American
- 3.2.2 Asia-Pacific
- 3.2.3 and Middle East and African Regions4.; Growing Offshore Renewable Technologies
- 3.3. Market Restrains
- 3.3.1. Ban on Offshore Exploration and Production Activities in Multiple Regions
- 3.4. Market Trends
- 3.4.1 Inspection
- 3.4.2 Repair
- 3.4.3 and Maintenance Activity to Witness Significant Growth
- 4. Market Factor Analysis
- 4.1. Porters Five Forces
- 4.2. Supply/Value Chain
- 4.3. PESTEL analysis
- 4.4. Market Entropy
- 4.5. Patent/Trademark Analysis
- 5. North America AUV and ROV Market Analysis, Insights and Forecast, 2019-2031
- 5.1. Market Analysis, Insights and Forecast - by Vehicle Type
- 5.1.1. ROV
- 5.1.2. AUV
- 5.2. Market Analysis, Insights and Forecast - by Vehicle Class
- 5.2.1. Work-class Vehicle
- 5.2.2. Observatory-class Vehicle
- 5.3. Market Analysis, Insights and Forecast - by Application
- 5.3.1. Oil and Gas
- 5.3.2. Defense
- 5.3.3. Other Applications
- 5.4. Market Analysis, Insights and Forecast - by Activity
- 5.4.1. Drilling and Development
- 5.4.2. Construction
- 5.4.3. Inspection, Repair, and Maintenance
- 5.4.4. Decommissioning
- 5.4.5. Other Activities
- 5.5. Market Analysis, Insights and Forecast - by Geography
- 5.5.1. United States
- 5.5.2. Canada
- 5.5.3. Rest of North America
- 5.6. Market Analysis, Insights and Forecast - by Region
- 5.6.1. United States
- 5.6.2. Canada
- 5.6.3. Rest of North America
- 5.1. Market Analysis, Insights and Forecast - by Vehicle Type
- 6. United States North America AUV and ROV Market Analysis, Insights and Forecast, 2019-2031
- 6.1. Market Analysis, Insights and Forecast - by Vehicle Type
- 6.1.1. ROV
- 6.1.2. AUV
- 6.2. Market Analysis, Insights and Forecast - by Vehicle Class
- 6.2.1. Work-class Vehicle
- 6.2.2. Observatory-class Vehicle
- 6.3. Market Analysis, Insights and Forecast - by Application
- 6.3.1. Oil and Gas
- 6.3.2. Defense
- 6.3.3. Other Applications
- 6.4. Market Analysis, Insights and Forecast - by Activity
- 6.4.1. Drilling and Development
- 6.4.2. Construction
- 6.4.3. Inspection, Repair, and Maintenance
- 6.4.4. Decommissioning
- 6.4.5. Other Activities
- 6.5. Market Analysis, Insights and Forecast - by Geography
- 6.5.1. United States
- 6.5.2. Canada
- 6.5.3. Rest of North America
- 6.1. Market Analysis, Insights and Forecast - by Vehicle Type
- 7. Canada North America AUV and ROV Market Analysis, Insights and Forecast, 2019-2031
- 7.1. Market Analysis, Insights and Forecast - by Vehicle Type
- 7.1.1. ROV
- 7.1.2. AUV
- 7.2. Market Analysis, Insights and Forecast - by Vehicle Class
- 7.2.1. Work-class Vehicle
- 7.2.2. Observatory-class Vehicle
- 7.3. Market Analysis, Insights and Forecast - by Application
- 7.3.1. Oil and Gas
- 7.3.2. Defense
- 7.3.3. Other Applications
- 7.4. Market Analysis, Insights and Forecast - by Activity
- 7.4.1. Drilling and Development
- 7.4.2. Construction
- 7.4.3. Inspection, Repair, and Maintenance
- 7.4.4. Decommissioning
- 7.4.5. Other Activities
- 7.5. Market Analysis, Insights and Forecast - by Geography
- 7.5.1. United States
- 7.5.2. Canada
- 7.5.3. Rest of North America
- 7.1. Market Analysis, Insights and Forecast - by Vehicle Type
- 8. Rest of North America North America AUV and ROV Market Analysis, Insights and Forecast, 2019-2031
- 8.1. Market Analysis, Insights and Forecast - by Vehicle Type
- 8.1.1. ROV
- 8.1.2. AUV
- 8.2. Market Analysis, Insights and Forecast - by Vehicle Class
- 8.2.1. Work-class Vehicle
- 8.2.2. Observatory-class Vehicle
- 8.3. Market Analysis, Insights and Forecast - by Application
- 8.3.1. Oil and Gas
- 8.3.2. Defense
- 8.3.3. Other Applications
- 8.4. Market Analysis, Insights and Forecast - by Activity
- 8.4.1. Drilling and Development
- 8.4.2. Construction
- 8.4.3. Inspection, Repair, and Maintenance
- 8.4.4. Decommissioning
- 8.4.5. Other Activities
- 8.5. Market Analysis, Insights and Forecast - by Geography
- 8.5.1. United States
- 8.5.2. Canada
- 8.5.3. Rest of North America
- 8.1. Market Analysis, Insights and Forecast - by Vehicle Type
- 9. United States North America AUV and ROV Market Analysis, Insights and Forecast, 2019-2031
- 10. Canada North America AUV and ROV Market Analysis, Insights and Forecast, 2019-2031
- 11. Mexico North America AUV and ROV Market Analysis, Insights and Forecast, 2019-2031
- 12. Rest of North America North America AUV and ROV Market Analysis, Insights and Forecast, 2019-2031
- 13. Competitive Analysis
- 13.1. Market Share Analysis 2024
- 13.2. Company Profiles
- 13.2.1 DOF Subsea AS
- 13.2.1.1. Overview
- 13.2.1.2. Products
- 13.2.1.3. SWOT Analysis
- 13.2.1.4. Recent Developments
- 13.2.1.5. Financials (Based on Availability)
- 13.2.2 ROVOP
- 13.2.2.1. Overview
- 13.2.2.2. Products
- 13.2.2.3. SWOT Analysis
- 13.2.2.4. Recent Developments
- 13.2.2.5. Financials (Based on Availability)
- 13.2.3 Fugro NV
- 13.2.3.1. Overview
- 13.2.3.2. Products
- 13.2.3.3. SWOT Analysis
- 13.2.3.4. Recent Developments
- 13.2.3.5. Financials (Based on Availability)
- 13.2.4 Oceaneering International Inc
- 13.2.4.1. Overview
- 13.2.4.2. Products
- 13.2.4.3. SWOT Analysis
- 13.2.4.4. Recent Developments
- 13.2.4.5. Financials (Based on Availability)
- 13.2.5 Delta SubSea LLC*List Not Exhaustive
- 13.2.5.1. Overview
- 13.2.5.2. Products
- 13.2.5.3. SWOT Analysis
- 13.2.5.4. Recent Developments
- 13.2.5.5. Financials (Based on Availability)
- 13.2.6 Saipem SpA
- 13.2.6.1. Overview
- 13.2.6.2. Products
- 13.2.6.3. SWOT Analysis
- 13.2.6.4. Recent Developments
- 13.2.6.5. Financials (Based on Availability)
- 13.2.7 DeepOcean AS
- 13.2.7.1. Overview
- 13.2.7.2. Products
- 13.2.7.3. SWOT Analysis
- 13.2.7.4. Recent Developments
- 13.2.7.5. Financials (Based on Availability)
- 13.2.8 Helix Energy Solutions Group
- 13.2.8.1. Overview
- 13.2.8.2. Products
- 13.2.8.3. SWOT Analysis
- 13.2.8.4. Recent Developments
- 13.2.8.5. Financials (Based on Availability)
- 13.2.9 Forum Energy Technologies Inc
- 13.2.9.1. Overview
- 13.2.9.2. Products
- 13.2.9.3. SWOT Analysis
- 13.2.9.4. Recent Developments
- 13.2.9.5. Financials (Based on Availability)
- 13.2.10 TechnipFMC PLC
- 13.2.10.1. Overview
- 13.2.10.2. Products
- 13.2.10.3. SWOT Analysis
- 13.2.10.4. Recent Developments
- 13.2.10.5. Financials (Based on Availability)
- 13.2.1 DOF Subsea AS
List of Figures
- Figure 1: North America AUV and ROV Market Revenue Breakdown (Million, %) by Product 2024 & 2032
- Figure 2: North America AUV and ROV Market Share (%) by Company 2024
List of Tables
- Table 1: North America AUV and ROV Market Revenue Million Forecast, by Region 2019 & 2032
- Table 2: North America AUV and ROV Market Volume K Unit Forecast, by Region 2019 & 2032
- Table 3: North America AUV and ROV Market Revenue Million Forecast, by Vehicle Type 2019 & 2032
- Table 4: North America AUV and ROV Market Volume K Unit Forecast, by Vehicle Type 2019 & 2032
- Table 5: North America AUV and ROV Market Revenue Million Forecast, by Vehicle Class 2019 & 2032
- Table 6: North America AUV and ROV Market Volume K Unit Forecast, by Vehicle Class 2019 & 2032
- Table 7: North America AUV and ROV Market Revenue Million Forecast, by Application 2019 & 2032
- Table 8: North America AUV and ROV Market Volume K Unit Forecast, by Application 2019 & 2032
- Table 9: North America AUV and ROV Market Revenue Million Forecast, by Activity 2019 & 2032
- Table 10: North America AUV and ROV Market Volume K Unit Forecast, by Activity 2019 & 2032
- Table 11: North America AUV and ROV Market Revenue Million Forecast, by Geography 2019 & 2032
- Table 12: North America AUV and ROV Market Volume K Unit Forecast, by Geography 2019 & 2032
- Table 13: North America AUV and ROV Market Revenue Million Forecast, by Region 2019 & 2032
- Table 14: North America AUV and ROV Market Volume K Unit Forecast, by Region 2019 & 2032
- Table 15: North America AUV and ROV Market Revenue Million Forecast, by Country 2019 & 2032
- Table 16: North America AUV and ROV Market Volume K Unit Forecast, by Country 2019 & 2032
- Table 17: United States North America AUV and ROV Market Revenue (Million) Forecast, by Application 2019 & 2032
- Table 18: United States North America AUV and ROV Market Volume (K Unit) Forecast, by Application 2019 & 2032
- Table 19: Canada North America AUV and ROV Market Revenue (Million) Forecast, by Application 2019 & 2032
- Table 20: Canada North America AUV and ROV Market Volume (K Unit) Forecast, by Application 2019 & 2032
- Table 21: Mexico North America AUV and ROV Market Revenue (Million) Forecast, by Application 2019 & 2032
- Table 22: Mexico North America AUV and ROV Market Volume (K Unit) Forecast, by Application 2019 & 2032
- Table 23: Rest of North America North America AUV and ROV Market Revenue (Million) Forecast, by Application 2019 & 2032
- Table 24: Rest of North America North America AUV and ROV Market Volume (K Unit) Forecast, by Application 2019 & 2032
- Table 25: North America AUV and ROV Market Revenue Million Forecast, by Vehicle Type 2019 & 2032
- Table 26: North America AUV and ROV Market Volume K Unit Forecast, by Vehicle Type 2019 & 2032
- Table 27: North America AUV and ROV Market Revenue Million Forecast, by Vehicle Class 2019 & 2032
- Table 28: North America AUV and ROV Market Volume K Unit Forecast, by Vehicle Class 2019 & 2032
- Table 29: North America AUV and ROV Market Revenue Million Forecast, by Application 2019 & 2032
- Table 30: North America AUV and ROV Market Volume K Unit Forecast, by Application 2019 & 2032
- Table 31: North America AUV and ROV Market Revenue Million Forecast, by Activity 2019 & 2032
- Table 32: North America AUV and ROV Market Volume K Unit Forecast, by Activity 2019 & 2032
- Table 33: North America AUV and ROV Market Revenue Million Forecast, by Geography 2019 & 2032
- Table 34: North America AUV and ROV Market Volume K Unit Forecast, by Geography 2019 & 2032
- Table 35: North America AUV and ROV Market Revenue Million Forecast, by Country 2019 & 2032
- Table 36: North America AUV and ROV Market Volume K Unit Forecast, by Country 2019 & 2032
- Table 37: North America AUV and ROV Market Revenue Million Forecast, by Vehicle Type 2019 & 2032
- Table 38: North America AUV and ROV Market Volume K Unit Forecast, by Vehicle Type 2019 & 2032
- Table 39: North America AUV and ROV Market Revenue Million Forecast, by Vehicle Class 2019 & 2032
- Table 40: North America AUV and ROV Market Volume K Unit Forecast, by Vehicle Class 2019 & 2032
- Table 41: North America AUV and ROV Market Revenue Million Forecast, by Application 2019 & 2032
- Table 42: North America AUV and ROV Market Volume K Unit Forecast, by Application 2019 & 2032
- Table 43: North America AUV and ROV Market Revenue Million Forecast, by Activity 2019 & 2032
- Table 44: North America AUV and ROV Market Volume K Unit Forecast, by Activity 2019 & 2032
- Table 45: North America AUV and ROV Market Revenue Million Forecast, by Geography 2019 & 2032
- Table 46: North America AUV and ROV Market Volume K Unit Forecast, by Geography 2019 & 2032
- Table 47: North America AUV and ROV Market Revenue Million Forecast, by Country 2019 & 2032
- Table 48: North America AUV and ROV Market Volume K Unit Forecast, by Country 2019 & 2032
- Table 49: North America AUV and ROV Market Revenue Million Forecast, by Vehicle Type 2019 & 2032
- Table 50: North America AUV and ROV Market Volume K Unit Forecast, by Vehicle Type 2019 & 2032
- Table 51: North America AUV and ROV Market Revenue Million Forecast, by Vehicle Class 2019 & 2032
- Table 52: North America AUV and ROV Market Volume K Unit Forecast, by Vehicle Class 2019 & 2032
- Table 53: North America AUV and ROV Market Revenue Million Forecast, by Application 2019 & 2032
- Table 54: North America AUV and ROV Market Volume K Unit Forecast, by Application 2019 & 2032
- Table 55: North America AUV and ROV Market Revenue Million Forecast, by Activity 2019 & 2032
- Table 56: North America AUV and ROV Market Volume K Unit Forecast, by Activity 2019 & 2032
- Table 57: North America AUV and ROV Market Revenue Million Forecast, by Geography 2019 & 2032
- Table 58: North America AUV and ROV Market Volume K Unit Forecast, by Geography 2019 & 2032
- Table 59: North America AUV and ROV Market Revenue Million Forecast, by Country 2019 & 2032
- Table 60: North America AUV and ROV Market Volume K Unit Forecast, by Country 2019 & 2032
Frequently Asked Questions
1. What is the projected Compound Annual Growth Rate (CAGR) of the North America AUV and ROV Market?
The projected CAGR is approximately 7.13%.
2. Which companies are prominent players in the North America AUV and ROV Market?
Key companies in the market include DOF Subsea AS, ROVOP, Fugro NV, Oceaneering International Inc, Delta SubSea LLC*List Not Exhaustive, Saipem SpA, DeepOcean AS, Helix Energy Solutions Group, Forum Energy Technologies Inc, TechnipFMC PLC.
3. What are the main segments of the North America AUV and ROV Market?
The market segments include Vehicle Type, Vehicle Class, Application, Activity, Geography.
4. Can you provide details about the market size?
The market size is estimated to be USD XX Million as of 2022.
5. What are some drivers contributing to market growth?
Increasing Offshore Oil and Gas Exploration Activities in the American. Asia-Pacific. and Middle East and African Regions4.; Growing Offshore Renewable Technologies.
6. What are the notable trends driving market growth?
Inspection. Repair. and Maintenance Activity to Witness Significant Growth.
7. Are there any restraints impacting market growth?
Ban on Offshore Exploration and Production Activities in Multiple Regions.
8. Can you provide examples of recent developments in the market?
In August 2022, VideoRay, LLC, reported a large and diverse order for its Defender remotely operated vehicles (ROVs) by the United States Navy. The Navy is standardizing on VideoRay Defender Mission Specialist systems due to the superior capabilities, flexibility and upgradeability of many systems deployed since 2019. VideoRay's customer support of the Navy includes training facilities and staffing on the East Coast in Pottstown, Pennsylvania, and the West Coast in San Diego.
9. What pricing options are available for accessing the report?
Pricing options include single-user, multi-user, and enterprise licenses priced at USD 4750, USD 5250, and USD 8750 respectively.
10. Is the market size provided in terms of value or volume?
The market size is provided in terms of value, measured in Million and volume, measured in K Unit.
11. Are there any specific market keywords associated with the report?
Yes, the market keyword associated with the report is "North America AUV and ROV Market," which aids in identifying and referencing the specific market segment covered.
12. How do I determine which pricing option suits my needs best?
The pricing options vary based on user requirements and access needs. Individual users may opt for single-user licenses, while businesses requiring broader access may choose multi-user or enterprise licenses for cost-effective access to the report.
13. Are there any additional resources or data provided in the North America AUV and ROV Market report?
While the report offers comprehensive insights, it's advisable to review the specific contents or supplementary materials provided to ascertain if additional resources or data are available.
14. How can I stay updated on further developments or reports in the North America AUV and ROV Market?
To stay informed about further developments, trends, and reports in the North America AUV and ROV Market, consider subscribing to industry newsletters, following relevant companies and organizations, or regularly checking reputable industry news sources and publications.
Methodology
Step 1 - Identification of Relevant Samples Size from Population Database


Step 2 - Approaches for Defining Global Market Size (Value, Volume* & Price*)

Note*: In applicable scenarios
Step 3 - Data Sources
Primary Research
- Web Analytics
- Survey Reports
- Research Institute
- Latest Research Reports
- Opinion Leaders
Secondary Research
- Annual Reports
- White Paper
- Latest Press Release
- Industry Association
- Paid Database
- Investor Presentations

Step 4 - Data Triangulation
Involves using different sources of information in order to increase the validity of a study
These sources are likely to be stakeholders in a program - participants, other researchers, program staff, other community members, and so on.
Then we put all data in single framework & apply various statistical tools to find out the dynamic on the market.
During the analysis stage, feedback from the stakeholder groups would be compared to determine areas of agreement as well as areas of divergence
