

Key Insights
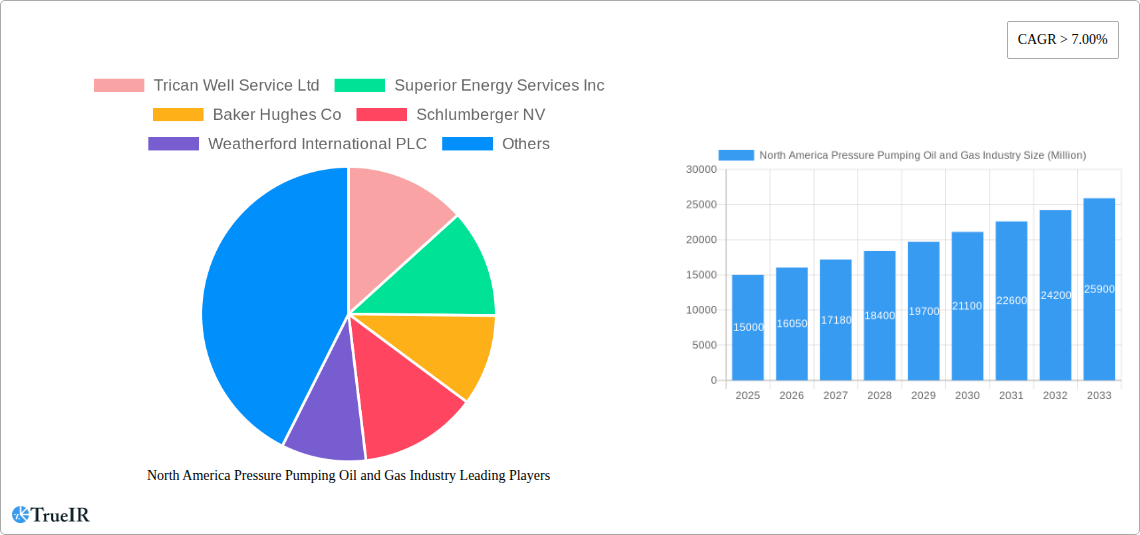
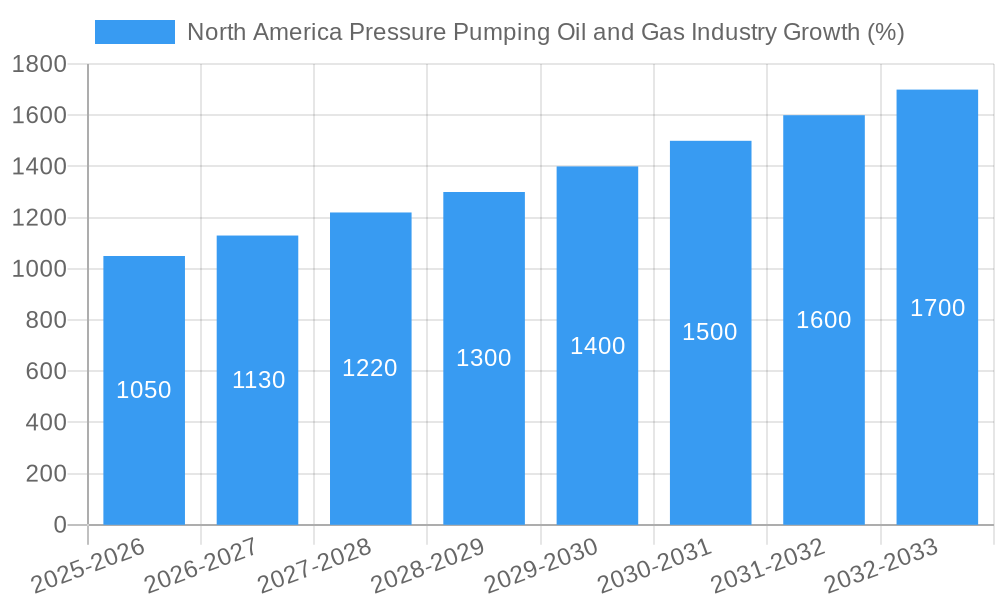
The North American pressure pumping oil and gas industry is experiencing robust growth, driven by increasing oil and gas exploration and production activities, particularly in unconventional shale formations. The market, valued at approximately $15 billion in 2025, is projected to maintain a Compound Annual Growth Rate (CAGR) exceeding 7% through 2033. This expansion is fueled by several key factors: the ongoing demand for energy, technological advancements in hydraulic fracturing techniques leading to improved efficiency and reduced costs, and the strategic investments by major players like Schlumberger, Halliburton, and Baker Hughes in expanding their pressure pumping fleets and service offerings. The horizontal well segment dominates the market, reflecting the industry's shift towards more complex and productive well designs in shale plays. While the industry faces challenges such as environmental regulations and fluctuating oil and gas prices, these are mitigated by the consistent demand for energy and ongoing technological advancements that improve both efficiency and environmental impact.
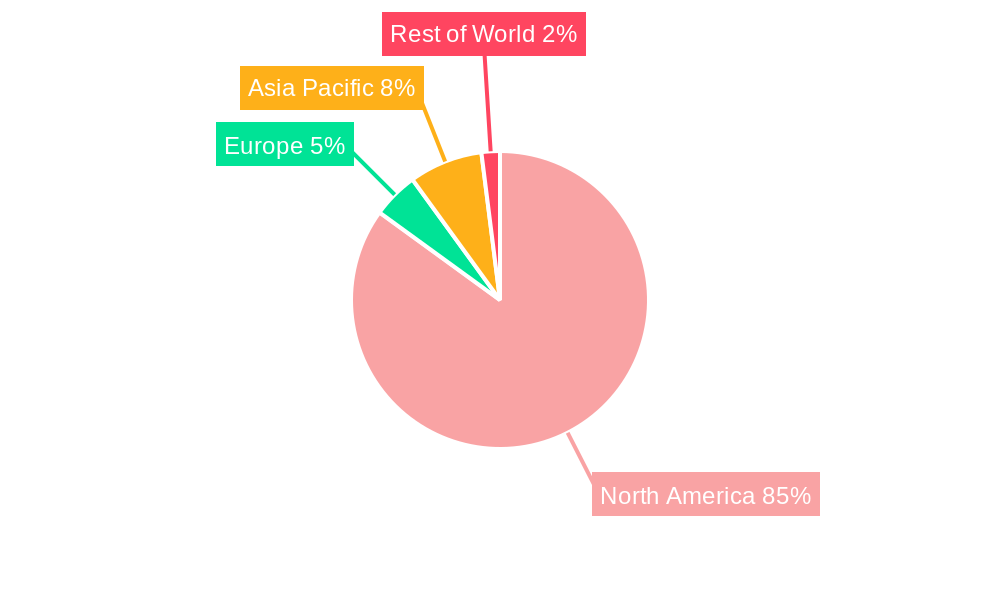
The significant players, including Trican, Superior Energy, and Calfrac, are focusing on strategic partnerships and mergers to enhance their market position and service capabilities. North America, particularly the United States and Canada, accounts for the largest share of this market due to extensive shale gas reserves and established oil and gas infrastructure. The growth is further segmented by service types (hydraulic fracturing, cementing, enhanced oil recovery) and well types (horizontal, vertical), with hydraulic fracturing for horizontal wells being the most dominant sub-segment. Continued investment in research and development for environmentally friendly fracturing fluids and technologies is expected to positively impact market growth and alleviate environmental concerns. The forecast period (2025-2033) presents significant opportunities for companies to capitalize on the expanding market and introduce innovative solutions.
North America Pressure Pumping Oil & Gas Industry Report: 2019-2033
This comprehensive report delivers an in-depth analysis of the North America pressure pumping oil and gas industry, projecting market trends from 2019 to 2033. We examine market structure, competitive dynamics, key players, and future growth opportunities, providing crucial insights for investors, industry professionals, and strategic decision-makers. The study period covers 2019-2033, with a base year of 2025 and a forecast period of 2025-2033.
North America Pressure Pumping Oil & Gas Industry Market Structure & Competitive Landscape
This section analyzes the market's competitive landscape, examining market concentration, innovation, regulatory factors, product substitutes, end-user segmentation, and merger & acquisition (M&A) activity.
Market Concentration: The North American pressure pumping market exhibits moderate concentration, with a few major players like Halliburton Company, Schlumberger NV, and Baker Hughes Co. holding significant market share. However, smaller players like Trican Well Service Ltd and Calfrac Well Services Ltd also contribute significantly, creating a dynamic competitive environment. Concentration ratios (e.g., CR4, CR8) will be calculated and presented in the full report. xx% of the market is controlled by the top 5 players, indicating an oligopolistic structure.
Innovation Drivers: Technological advancements in hydraulic fracturing techniques, including the adoption of slickwater fracturing and automated systems, are major drivers of market innovation. The demand for enhanced oil recovery (EOR) methods is also fueling R&D efforts.
Regulatory Impacts: Environmental regulations, particularly concerning water usage and emissions, are significant factors impacting market operations. Variations in regulations across different North American states and provinces also influence operational strategies and costs.
Product Substitutes: While pressure pumping remains the dominant technology for well completion, alternative techniques are emerging, including alternative stimulation methods such as CO2 fracturing. These substitutes present a moderate competitive threat, particularly in niche applications.
End-User Segmentation: The market is segmented by well type (horizontal and vertical) and service type (hydraulic fracturing, cementing, EOR). Horizontal wells currently dominate, driven by shale gas and tight oil production.
M&A Trends: The historical period (2019-2024) witnessed a moderate level of M&A activity, driven by consolidation efforts among service providers seeking economies of scale and expansion into new markets. The full report provides quantitative data on M&A volumes and financial values (in Millions).
North America Pressure Pumping Oil & Gas Industry Market Trends & Opportunities
This section details the market's growth trajectory, technological shifts, consumer preferences (E&P companies), and competitive dynamics over the forecast period (2025-2033).
The North American pressure pumping market is projected to experience robust growth, driven by increasing oil and gas exploration and production activities across key regions. This growth is particularly evident in shale gas plays like the Permian Basin and Bakken formation. The market size is expected to reach xx Million by 2033, exhibiting a compound annual growth rate (CAGR) of xx% during the forecast period. This growth is fueled by several factors including technological advancements, rising demand for oil and gas, and strategic investments by major players. Market penetration rates for various services will be detailed in the full report, along with regional breakdowns showing variations in growth rates based on resource availability, regulatory environments, and infrastructure development. Competitive dynamics are marked by ongoing technological improvements, strategic alliances, and a persistent focus on operational efficiency.
Dominant Markets & Segments in North America Pressure Pumping Oil & Gas Industry
This section identifies the leading regions, countries, and segments within the North American pressure pumping market.
Dominant Regions: The Permian Basin in Texas and New Mexico, and the Bakken formation in North Dakota, represent the most dominant regions due to extensive shale gas and oil reserves. Other key areas include the Marcellus and Utica shale plays.
Dominant Service Types: Hydraulic fracturing is the largest segment, contributing xx% to the overall market revenue, followed by cementing services. EOR techniques represent a smaller but rapidly growing segment.
Dominant Well Types: Horizontal wells are the dominant well type due to their efficiency in extracting resources from shale formations. This segment contributes significantly to the market.
Key Growth Drivers:
- Significant shale gas and oil reserves.
- Favorable regulatory environments (in some regions).
- Investment in pipeline and infrastructure.
- Technological advancements in hydraulic fracturing techniques.
North America Pressure Pumping Oil & Gas Industry Product Analysis
The pressure pumping industry is characterized by continuous innovation focused on improving efficiency and reducing environmental impact. Technological advancements include automated systems, enhanced proppant technologies, and the development of more efficient fracturing fluids. These innovations are designed to optimize well stimulation, reduce costs, and minimize environmental footprint, thereby ensuring a strong market fit. Competitive advantage increasingly relies on technological leadership, operational efficiency, and effective supply chain management.
Key Drivers, Barriers & Challenges in North America Pressure Pumping Oil and Gas Industry
Key Drivers:
- Increased oil and gas exploration and production activity.
- Growth in shale gas and tight oil production.
- Technological advancements in hydraulic fracturing.
- Government incentives and policies promoting domestic energy production.
Key Challenges and Restraints:
- Environmental regulations impacting water usage and emissions.
- Fluctuations in oil and gas prices.
- Supply chain disruptions affecting the availability of crucial components.
- Intense competition among pressure pumping service providers. Price wars contribute to reduced profitability for some firms.
Growth Drivers in the North America Pressure Pumping Oil & Gas Industry Market
Sustained growth in the North American pressure pumping market is primarily fueled by the ongoing expansion of oil and gas production activities, particularly in shale formations. Technological advancements in hydraulic fracturing techniques continue to enhance efficiency and reduce costs. Supportive government policies, aiming to bolster domestic energy production, also contribute positively to market growth.
Challenges Impacting North America Pressure Pumping Oil & Gas Industry Growth
The North American pressure pumping industry faces significant challenges, primarily stemming from stringent environmental regulations concerning water usage and emissions. Oil and gas price volatility presents a major risk, impacting investment decisions and profitability. Furthermore, supply chain constraints and intense competition within the sector also pose considerable challenges.
Key Players Shaping the North America Pressure Pumping Oil & Gas Industry Market
- Trican Well Service Ltd
- Superior Energy Services Inc
- Baker Hughes Co
- Schlumberger NV
- Weatherford International PLC
- Chevron Corporation
- Saipem SpA
- Halliburton Company
- Shell PLC
- Calfrac Well Services Ltd
Significant North America Pressure Pumping Oil & Gas Industry Industry Milestones
- 2020: Significant extensions and discoveries of crude oil reserves in Texas (1.8 Billion barrels), New Mexico (0.7 Billion barrels), and North Dakota (0.2 Billion barrels). This boosted pressure pumping demand.
- 2020: Alaska experienced a substantial increase in proved natural gas reserves (27 tcf), quadrupling its total. This spurred further exploration and production, indirectly impacting the pressure pumping industry.
Future Outlook for North America Pressure Pumping Oil & Gas Industry Market
The North American pressure pumping market is poised for sustained growth, propelled by ongoing oil and gas exploration and production, particularly in shale formations. Technological innovations continue to enhance efficiency and reduce environmental concerns. Strategic acquisitions and partnerships among industry players will further shape the market landscape. The industry’s continued focus on sustainable practices will be key for long-term success.
North America Pressure Pumping Oil and Gas Industry Segmentation
-
1. Service Type
- 1.1. Hydraulic Fracturing
- 1.2. Cementing
- 1.3. Enhanced Oil Recovery
-
2. Well Type
- 2.1. Horizontal
- 2.2. Vertical
North America Pressure Pumping Oil and Gas Industry Segmentation By Geography
- 1. North America
- 2. Europe
- 3. Asia Pacific
- 4. South America
- 5. Middle East
North America Pressure Pumping Oil and Gas Industry REPORT HIGHLIGHTS
| Aspects | Details |
|---|---|
| Study Period | 2019-2033 |
| Base Year | 2024 |
| Estimated Year | 2025 |
| Forecast Period | 2025-2033 |
| Historical Period | 2019-2024 |
| Growth Rate | CAGR of > 7.00% from 2019-2033 |
| Segmentation |
|
Table of Contents
- 1. Introduction
- 1.1. Research Scope
- 1.2. Market Segmentation
- 1.3. Research Methodology
- 1.4. Definitions and Assumptions
- 2. Executive Summary
- 2.1. Introduction
- 3. Market Dynamics
- 3.1. Introduction
- 3.2. Market Drivers
- 3.2.1. Rapid Recovery in the Oil and Gas and Mining Industries4.; Surge in the Construction Industry
- 3.3. Market Restrains
- 3.3.1. High Maintenance and Operation Costs of Submersible Pump Restrain the Market
- 3.4. Market Trends
- 3.4.1. Hydraulic Fracturing Expected to Dominate the Market
- 4. Market Factor Analysis
- 4.1. Porters Five Forces
- 4.2. Supply/Value Chain
- 4.3. PESTEL analysis
- 4.4. Market Entropy
- 4.5. Patent/Trademark Analysis
- 5. North America Pressure Pumping Oil and Gas Industry Analysis, Insights and Forecast, 2019-2031
- 5.1. Market Analysis, Insights and Forecast - by Service Type
- 5.1.1. Hydraulic Fracturing
- 5.1.2. Cementing
- 5.1.3. Enhanced Oil Recovery
- 5.2. Market Analysis, Insights and Forecast - by Well Type
- 5.2.1. Horizontal
- 5.2.2. Vertical
- 5.3. Market Analysis, Insights and Forecast - by Region
- 5.3.1. North America
- 5.3.2. Europe
- 5.3.3. Asia Pacific
- 5.3.4. South America
- 5.3.5. Middle East
- 5.1. Market Analysis, Insights and Forecast - by Service Type
- 6. North America North America Pressure Pumping Oil and Gas Industry Analysis, Insights and Forecast, 2019-2031
- 6.1. Market Analysis, Insights and Forecast - by Service Type
- 6.1.1. Hydraulic Fracturing
- 6.1.2. Cementing
- 6.1.3. Enhanced Oil Recovery
- 6.2. Market Analysis, Insights and Forecast - by Well Type
- 6.2.1. Horizontal
- 6.2.2. Vertical
- 6.1. Market Analysis, Insights and Forecast - by Service Type
- 7. Europe North America Pressure Pumping Oil and Gas Industry Analysis, Insights and Forecast, 2019-2031
- 7.1. Market Analysis, Insights and Forecast - by Service Type
- 7.1.1. Hydraulic Fracturing
- 7.1.2. Cementing
- 7.1.3. Enhanced Oil Recovery
- 7.2. Market Analysis, Insights and Forecast - by Well Type
- 7.2.1. Horizontal
- 7.2.2. Vertical
- 7.1. Market Analysis, Insights and Forecast - by Service Type
- 8. Asia Pacific North America Pressure Pumping Oil and Gas Industry Analysis, Insights and Forecast, 2019-2031
- 8.1. Market Analysis, Insights and Forecast - by Service Type
- 8.1.1. Hydraulic Fracturing
- 8.1.2. Cementing
- 8.1.3. Enhanced Oil Recovery
- 8.2. Market Analysis, Insights and Forecast - by Well Type
- 8.2.1. Horizontal
- 8.2.2. Vertical
- 8.1. Market Analysis, Insights and Forecast - by Service Type
- 9. South America North America Pressure Pumping Oil and Gas Industry Analysis, Insights and Forecast, 2019-2031
- 9.1. Market Analysis, Insights and Forecast - by Service Type
- 9.1.1. Hydraulic Fracturing
- 9.1.2. Cementing
- 9.1.3. Enhanced Oil Recovery
- 9.2. Market Analysis, Insights and Forecast - by Well Type
- 9.2.1. Horizontal
- 9.2.2. Vertical
- 9.1. Market Analysis, Insights and Forecast - by Service Type
- 10. Middle East North America Pressure Pumping Oil and Gas Industry Analysis, Insights and Forecast, 2019-2031
- 10.1. Market Analysis, Insights and Forecast - by Service Type
- 10.1.1. Hydraulic Fracturing
- 10.1.2. Cementing
- 10.1.3. Enhanced Oil Recovery
- 10.2. Market Analysis, Insights and Forecast - by Well Type
- 10.2.1. Horizontal
- 10.2.2. Vertical
- 10.1. Market Analysis, Insights and Forecast - by Service Type
- 11. United States North America Pressure Pumping Oil and Gas Industry Analysis, Insights and Forecast, 2019-2031
- 12. Canada North America Pressure Pumping Oil and Gas Industry Analysis, Insights and Forecast, 2019-2031
- 13. Mexico North America Pressure Pumping Oil and Gas Industry Analysis, Insights and Forecast, 2019-2031
- 14. Rest of North America North America Pressure Pumping Oil and Gas Industry Analysis, Insights and Forecast, 2019-2031
- 15. Competitive Analysis
- 15.1. Market Share Analysis 2024
- 15.2. Company Profiles
- 15.2.1 Trican Well Service Ltd
- 15.2.1.1. Overview
- 15.2.1.2. Products
- 15.2.1.3. SWOT Analysis
- 15.2.1.4. Recent Developments
- 15.2.1.5. Financials (Based on Availability)
- 15.2.2 Superior Energy Services Inc
- 15.2.2.1. Overview
- 15.2.2.2. Products
- 15.2.2.3. SWOT Analysis
- 15.2.2.4. Recent Developments
- 15.2.2.5. Financials (Based on Availability)
- 15.2.3 Baker Hughes Co
- 15.2.3.1. Overview
- 15.2.3.2. Products
- 15.2.3.3. SWOT Analysis
- 15.2.3.4. Recent Developments
- 15.2.3.5. Financials (Based on Availability)
- 15.2.4 Schlumberger NV
- 15.2.4.1. Overview
- 15.2.4.2. Products
- 15.2.4.3. SWOT Analysis
- 15.2.4.4. Recent Developments
- 15.2.4.5. Financials (Based on Availability)
- 15.2.5 Weatherford International PLC
- 15.2.5.1. Overview
- 15.2.5.2. Products
- 15.2.5.3. SWOT Analysis
- 15.2.5.4. Recent Developments
- 15.2.5.5. Financials (Based on Availability)
- 15.2.6 Chevron Corporation
- 15.2.6.1. Overview
- 15.2.6.2. Products
- 15.2.6.3. SWOT Analysis
- 15.2.6.4. Recent Developments
- 15.2.6.5. Financials (Based on Availability)
- 15.2.7 Saipem SpA
- 15.2.7.1. Overview
- 15.2.7.2. Products
- 15.2.7.3. SWOT Analysis
- 15.2.7.4. Recent Developments
- 15.2.7.5. Financials (Based on Availability)
- 15.2.8 Halliburton Company
- 15.2.8.1. Overview
- 15.2.8.2. Products
- 15.2.8.3. SWOT Analysis
- 15.2.8.4. Recent Developments
- 15.2.8.5. Financials (Based on Availability)
- 15.2.9 Shell PLC*List Not Exhaustive
- 15.2.9.1. Overview
- 15.2.9.2. Products
- 15.2.9.3. SWOT Analysis
- 15.2.9.4. Recent Developments
- 15.2.9.5. Financials (Based on Availability)
- 15.2.10 Calfrac Well Services Ltd
- 15.2.10.1. Overview
- 15.2.10.2. Products
- 15.2.10.3. SWOT Analysis
- 15.2.10.4. Recent Developments
- 15.2.10.5. Financials (Based on Availability)
- 15.2.1 Trican Well Service Ltd
List of Figures
- Figure 1: North America Pressure Pumping Oil and Gas Industry Revenue Breakdown (Million, %) by Product 2024 & 2032
- Figure 2: North America Pressure Pumping Oil and Gas Industry Share (%) by Company 2024
List of Tables
- Table 1: North America Pressure Pumping Oil and Gas Industry Revenue Million Forecast, by Region 2019 & 2032
- Table 2: North America Pressure Pumping Oil and Gas Industry Revenue Million Forecast, by Service Type 2019 & 2032
- Table 3: North America Pressure Pumping Oil and Gas Industry Revenue Million Forecast, by Well Type 2019 & 2032
- Table 4: North America Pressure Pumping Oil and Gas Industry Revenue Million Forecast, by Region 2019 & 2032
- Table 5: North America Pressure Pumping Oil and Gas Industry Revenue Million Forecast, by Country 2019 & 2032
- Table 6: United States North America Pressure Pumping Oil and Gas Industry Revenue (Million) Forecast, by Application 2019 & 2032
- Table 7: Canada North America Pressure Pumping Oil and Gas Industry Revenue (Million) Forecast, by Application 2019 & 2032
- Table 8: Mexico North America Pressure Pumping Oil and Gas Industry Revenue (Million) Forecast, by Application 2019 & 2032
- Table 9: Rest of North America North America Pressure Pumping Oil and Gas Industry Revenue (Million) Forecast, by Application 2019 & 2032
- Table 10: North America Pressure Pumping Oil and Gas Industry Revenue Million Forecast, by Service Type 2019 & 2032
- Table 11: North America Pressure Pumping Oil and Gas Industry Revenue Million Forecast, by Well Type 2019 & 2032
- Table 12: North America Pressure Pumping Oil and Gas Industry Revenue Million Forecast, by Country 2019 & 2032
- Table 13: North America Pressure Pumping Oil and Gas Industry Revenue Million Forecast, by Service Type 2019 & 2032
- Table 14: North America Pressure Pumping Oil and Gas Industry Revenue Million Forecast, by Well Type 2019 & 2032
- Table 15: North America Pressure Pumping Oil and Gas Industry Revenue Million Forecast, by Country 2019 & 2032
- Table 16: North America Pressure Pumping Oil and Gas Industry Revenue Million Forecast, by Service Type 2019 & 2032
- Table 17: North America Pressure Pumping Oil and Gas Industry Revenue Million Forecast, by Well Type 2019 & 2032
- Table 18: North America Pressure Pumping Oil and Gas Industry Revenue Million Forecast, by Country 2019 & 2032
- Table 19: North America Pressure Pumping Oil and Gas Industry Revenue Million Forecast, by Service Type 2019 & 2032
- Table 20: North America Pressure Pumping Oil and Gas Industry Revenue Million Forecast, by Well Type 2019 & 2032
- Table 21: North America Pressure Pumping Oil and Gas Industry Revenue Million Forecast, by Country 2019 & 2032
- Table 22: North America Pressure Pumping Oil and Gas Industry Revenue Million Forecast, by Service Type 2019 & 2032
- Table 23: North America Pressure Pumping Oil and Gas Industry Revenue Million Forecast, by Well Type 2019 & 2032
- Table 24: North America Pressure Pumping Oil and Gas Industry Revenue Million Forecast, by Country 2019 & 2032
Frequently Asked Questions
1. What is the projected Compound Annual Growth Rate (CAGR) of the North America Pressure Pumping Oil and Gas Industry?
The projected CAGR is approximately > 7.00%.
2. Which companies are prominent players in the North America Pressure Pumping Oil and Gas Industry?
Key companies in the market include Trican Well Service Ltd, Superior Energy Services Inc, Baker Hughes Co, Schlumberger NV, Weatherford International PLC, Chevron Corporation, Saipem SpA, Halliburton Company, Shell PLC*List Not Exhaustive, Calfrac Well Services Ltd.
3. What are the main segments of the North America Pressure Pumping Oil and Gas Industry?
The market segments include Service Type, Well Type.
4. Can you provide details about the market size?
The market size is estimated to be USD XX Million as of 2022.
5. What are some drivers contributing to market growth?
Rapid Recovery in the Oil and Gas and Mining Industries4.; Surge in the Construction Industry.
6. What are the notable trends driving market growth?
Hydraulic Fracturing Expected to Dominate the Market.
7. Are there any restraints impacting market growth?
High Maintenance and Operation Costs of Submersible Pump Restrain the Market.
8. Can you provide examples of recent developments in the market?
In 2020, the United States achieved the most significant extensions and discoveries of proved crude oil reserves and lease condensates, which were discovered in Texas, New Mexico, and North Dakota. The operators in Texas added around 1.8 billion barrels, New Mexico had 0.7 billion barrels, and North Dakota had 0.2 billion barrels of extensions and discoveries. The discoveries are likely to give more development and production opportunities to the E&P companies, and hence the pressure pumping services too.
9. What pricing options are available for accessing the report?
Pricing options include single-user, multi-user, and enterprise licenses priced at USD 4750, USD 5250, and USD 8750 respectively.
10. Is the market size provided in terms of value or volume?
The market size is provided in terms of value, measured in Million.
11. Are there any specific market keywords associated with the report?
Yes, the market keyword associated with the report is "North America Pressure Pumping Oil and Gas Industry," which aids in identifying and referencing the specific market segment covered.
12. How do I determine which pricing option suits my needs best?
The pricing options vary based on user requirements and access needs. Individual users may opt for single-user licenses, while businesses requiring broader access may choose multi-user or enterprise licenses for cost-effective access to the report.
13. Are there any additional resources or data provided in the North America Pressure Pumping Oil and Gas Industry report?
While the report offers comprehensive insights, it's advisable to review the specific contents or supplementary materials provided to ascertain if additional resources or data are available.
14. How can I stay updated on further developments or reports in the North America Pressure Pumping Oil and Gas Industry?
To stay informed about further developments, trends, and reports in the North America Pressure Pumping Oil and Gas Industry, consider subscribing to industry newsletters, following relevant companies and organizations, or regularly checking reputable industry news sources and publications.
Methodology
Step 1 - Identification of Relevant Samples Size from Population Database


Step 2 - Approaches for Defining Global Market Size (Value, Volume* & Price*)

Note*: In applicable scenarios
Step 3 - Data Sources
Primary Research
- Web Analytics
- Survey Reports
- Research Institute
- Latest Research Reports
- Opinion Leaders
Secondary Research
- Annual Reports
- White Paper
- Latest Press Release
- Industry Association
- Paid Database
- Investor Presentations

Step 4 - Data Triangulation
Involves using different sources of information in order to increase the validity of a study
These sources are likely to be stakeholders in a program - participants, other researchers, program staff, other community members, and so on.
Then we put all data in single framework & apply various statistical tools to find out the dynamic on the market.
During the analysis stage, feedback from the stakeholder groups would be compared to determine areas of agreement as well as areas of divergence
