

Key Insights
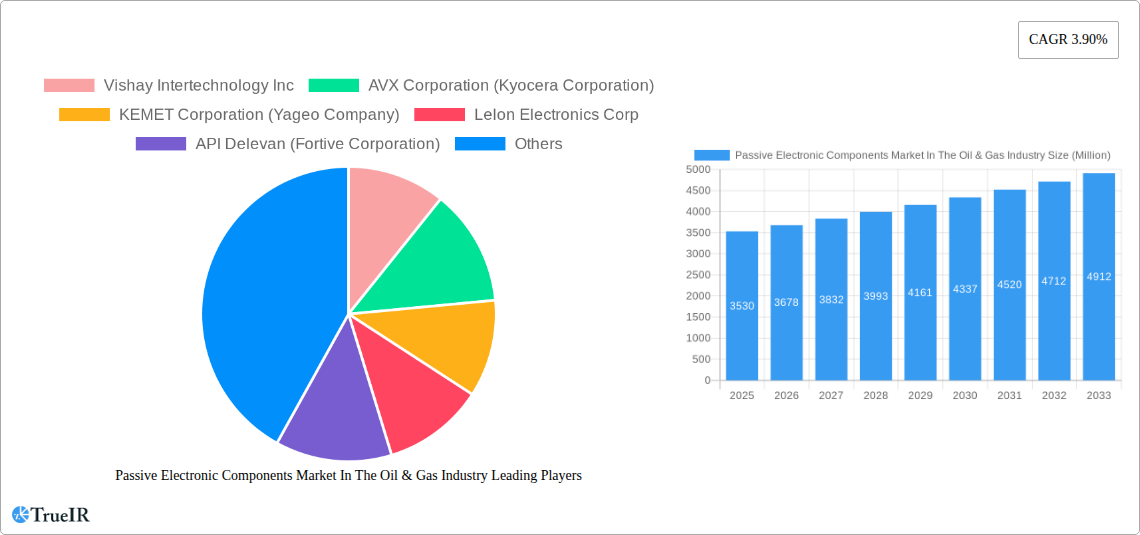
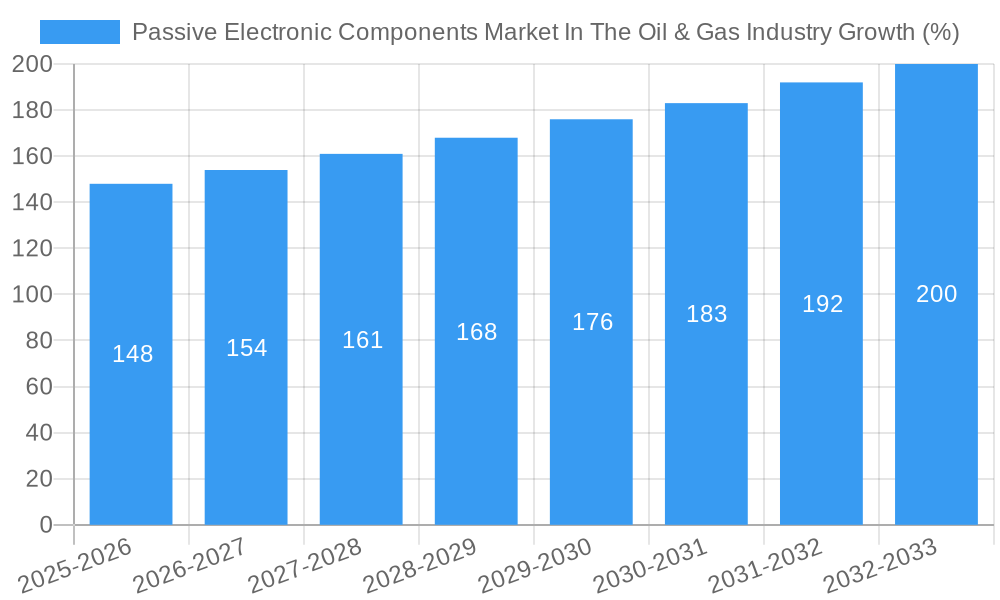
The Passive Electronic Components (PEC) market within the Oil & Gas industry is experiencing steady growth, projected to reach $3.53 billion in 2025 and exhibiting a Compound Annual Growth Rate (CAGR) of 3.90% from 2025 to 2033. This growth is driven by several key factors. Firstly, the increasing automation and digitalization of oil and gas operations necessitate sophisticated electronic systems, significantly boosting the demand for PECs in various applications, including drilling, production, and refining. Secondly, stringent safety regulations and the need for reliable equipment in harsh environments are driving the adoption of high-quality, durable PECs. Thirdly, the growth in offshore exploration and production activities contributes to increased demand for robust and reliable components capable of withstanding challenging maritime conditions. Furthermore, the continuous advancements in sensor technology and the rise of the Internet of Things (IoT) in oil and gas are fueling the demand for miniaturized and high-performance PECs.
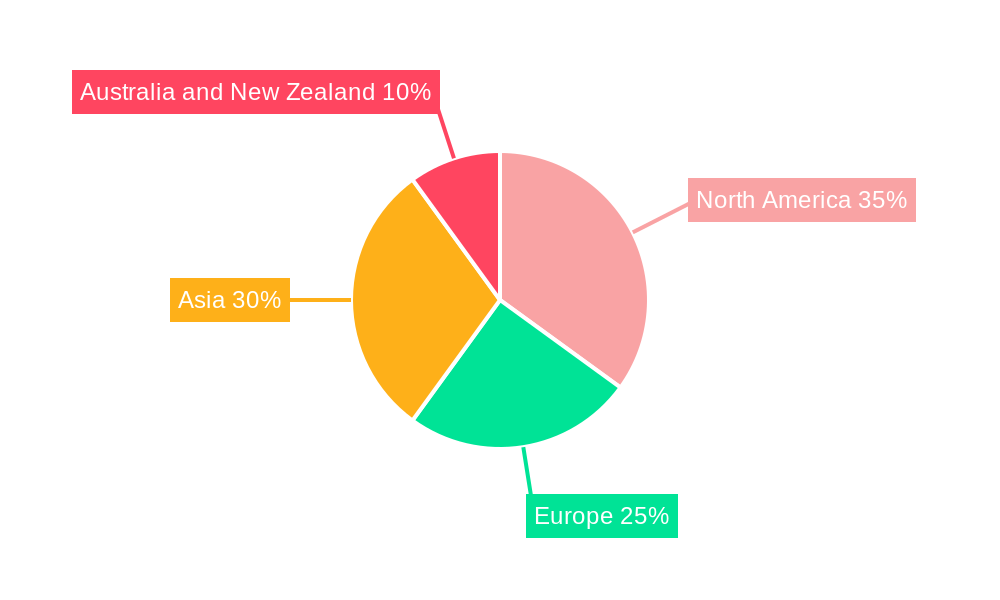
However, certain restraints are present. Fluctuations in oil and gas prices directly impact investment in new infrastructure and equipment, potentially slowing down market growth. Furthermore, the availability of skilled labor for installation and maintenance of complex electronic systems might pose a challenge. The market is segmented by component type (capacitors, inductors, resistors), with capacitors likely holding the largest share due to their widespread use in power conditioning and filtering applications. Key players like Vishay Intertechnology, AVX Corporation, KEMET Corporation, and TDK Corporation are strategically positioned to benefit from this market expansion through innovation and strategic partnerships. Regional growth will likely see Asia-Pacific as a significant contributor due to increasing exploration and production activities within the region. North America, while mature, will continue to see moderate growth owing to existing infrastructure upgrades and technological advancements. The forecast period (2025-2033) presents a strong opportunity for manufacturers focusing on advanced materials, enhanced performance, and miniaturization to cater to the specific requirements of the oil and gas sector.
Passive Electronic Components Market in the Oil & Gas Industry: A Comprehensive Market Report (2019-2033)
This dynamic report provides a detailed analysis of the Passive Electronic Components market within the Oil & Gas industry, offering invaluable insights for stakeholders seeking to navigate this evolving landscape. The report covers the period 2019-2033, with a focus on the forecast period 2025-2033 (Base Year: 2025, Estimated Year: 2025). Expect in-depth coverage of market size, segmentation, competitive dynamics, technological advancements, and future growth projections, all presented with a focus on maximizing your search engine visibility and enhancing your understanding of this crucial sector.
Passive Electronic Components Market In The Oil & Gas Industry Market Structure & Competitive Landscape
This section analyzes the competitive intensity and market structure of the Passive Electronic Components market in the Oil & Gas sector. We delve into market concentration, measured through metrics like the Herfindahl-Hirschman Index (HHI) which we estimate to be xx, and explore the implications for pricing, innovation, and market entry. The report examines the role of innovation drivers, such as the increasing demand for higher efficiency and reliability in oil and gas operations. Regulatory impacts, including safety standards and environmental regulations, are also carefully considered. Furthermore, we explore potential product substitutes and their market penetration rate (estimated at xx%), as well as end-user segmentation (upstream, midstream, and downstream) and their specific needs. The analysis also incorporates an overview of recent mergers and acquisitions (M&A) activity within the industry, estimating a total M&A value of xx Million in the past five years. The landscape is shaped by several key players, including established industry giants and emerging players. The level of competition is considered (estimated at xx on a scale of 1-10, with 10 being most competitive).
- Key factors analyzed: Market concentration, Innovation, Regulations, Substitutes, End-user segmentation, M&A activity.
- Quantitative data: HHI, M&A volume (xx Million), Market Penetration Rate (xx%), Competitiveness Score (xx).
Passive Electronic Components Market In The Oil & Gas Industry Market Trends & Opportunities
This section provides a comprehensive overview of market trends and opportunities, encompassing market size growth, technological shifts, evolving consumer preferences (in terms of component performance and reliability), and the competitive dynamics of the market. The market is projected to experience significant growth, with a Compound Annual Growth Rate (CAGR) estimated at xx% during the forecast period. This growth is driven by several factors, including increasing automation and digitization within the Oil & Gas industry and the growing adoption of advanced technologies such as smart sensors and IoT devices. We also examine emerging technological trends, like the integration of miniaturized components and the adoption of new materials to improve performance under harsh operational conditions. The changing preferences of end-users and their increasing focus on efficiency, safety, and reduced operational costs are also central to this analysis. The competitive landscape is highly dynamic, with ongoing product launches, partnerships, and acquisitions reshaping the market.
Dominant Markets & Segments in Passive Electronic Components Market In The Oil & Gas Industry
This section identifies the leading geographical regions, countries, and segments (Capacitor, Inductor, Resistor) within the Passive Electronic Components market for the Oil & Gas industry. Detailed analysis reveals the dominant segment to be xx, holding a market share of xx%. We explore the factors driving growth in each segment, along with a country-level analysis highlighting regions exhibiting particularly strong growth trajectories.
Key Growth Drivers:
- North America: Robust oil and gas production, coupled with investments in upgrading existing infrastructure and implementing advanced technologies.
- Europe: Stringent environmental regulations driving demand for efficient and reliable components.
- Asia-Pacific: Rapid industrialization and increasing energy demands.
Detailed Analysis: [Paragraph detailing the reasons for market dominance of the identified region, country, or segment will be included here, focusing on aspects like infrastructure development, government policies, and industry-specific needs.]
Passive Electronic Components Market In The Oil & Gas Industry Product Analysis
This section focuses on summarizing key product innovations, their specific applications within the oil and gas sector, and their competitive advantages. The report highlights recent technological advancements such as the development of miniaturized, high-reliability components capable of operating in extreme conditions. The analysis will also illustrate the strong market fit of these new components, leading to increased adoption and market penetration. For example, the introduction of low-inductance, high-current DC link film capacitors addresses the demand for more efficient power management systems. The market fit of these advancements is strong due to improving safety, durability and efficiency in oil and gas operations.
Key Drivers, Barriers & Challenges in Passive Electronic Components Market In The Oil & Gas Industry
This section identifies the key drivers and restraints shaping the Passive Electronic Components market.
Key Drivers: The industry is primarily driven by the increasing demand for sophisticated control systems, the need for enhanced safety protocols, and regulations mandating improved environmental performance. Technological advancements, such as the development of smaller, more efficient components, are further boosting market growth.
Challenges and Restraints: Supply chain disruptions, particularly regarding sourcing raw materials, can pose significant challenges. Furthermore, fluctuations in oil and gas prices influence investment decisions and overall market demand. Stringent regulatory requirements can also increase compliance costs for manufacturers. We estimate that these challenges could reduce the market growth by xx% in the next 5 years.
Growth Drivers in the Passive Electronic Components Market In The Oil & Gas Industry Market
This section will emphasize factors like technological innovations (e.g., development of smaller, more energy-efficient components), economic growth in key regions (leading to increased oil and gas exploration and production), and supportive government policies promoting the use of advanced technologies in the energy sector.
Challenges Impacting Passive Electronic Components Market In The Oil & Gas Industry Growth
This section will address barriers like price volatility in raw materials, supply chain vulnerabilities, competition from alternative technologies, and potential regulatory hurdles that could hinder market expansion. These challenges could potentially impact market growth by reducing the CAGR by xx%.
Key Players Shaping the Passive Electronic Components Market In The Oil & Gas Industry Market
- Vishay Intertechnology Inc
- AVX Corporation (Kyocera Corporation)
- KEMET Corporation (Yageo Company)
- Lelon Electronics Corp
- API Delevan (Fortive Corporation)
- TE Connectivity
- Cornell Dubilier Electronics Inc
- TDK Corporation
- Ohmite Manufacturing Company
- Panasonic Corporation
- Honeywell International Inc
- Eaton Corporation
Significant Passive Electronic Components Market In The Oil & Gas Industry Industry Milestones
- March 2023: Cornell Dubilier Electronics Inc. introduces the 944L series of low inductance, high current DC link film capacitors, significantly improving efficiency in power management systems.
- September 2022: TT Electronics launches the TFHP series thin film high-power chip resistors, enhancing precision and performance in oil & gas applications.
Future Outlook for Passive Electronic Components Market In The Oil & Gas Industry Market
The future of the Passive Electronic Components market in the Oil & Gas industry appears promising. Continued technological advancements, coupled with rising demand for improved efficiency and safety measures, are expected to drive substantial market growth. The increasing adoption of digital technologies within oil and gas operations, along with the ongoing development of more robust and reliable components, presents significant opportunities for market expansion. The market is poised for continued growth and innovation, making it an attractive sector for investment and development.
Passive Electronic Components Market In The Oil & Gas Industry Segmentation
-
1. Type
- 1.1. Capacitor
- 1.2. Inductor
- 1.3. Resistor
Passive Electronic Components Market In The Oil & Gas Industry Segmentation By Geography
- 1. North America
- 2. Europe
- 3. Asia
- 4. Australia and New Zealand
Passive Electronic Components Market In The Oil & Gas Industry REPORT HIGHLIGHTS
| Aspects | Details |
|---|---|
| Study Period | 2019-2033 |
| Base Year | 2024 |
| Estimated Year | 2025 |
| Forecast Period | 2025-2033 |
| Historical Period | 2019-2024 |
| Growth Rate | CAGR of 3.90% from 2019-2033 |
| Segmentation |
|
Table of Contents
- 1. Introduction
- 1.1. Research Scope
- 1.2. Market Segmentation
- 1.3. Research Methodology
- 1.4. Definitions and Assumptions
- 2. Executive Summary
- 2.1. Introduction
- 3. Market Dynamics
- 3.1. Introduction
- 3.2. Market Drivers
- 3.2.1. Increasing Investments in Oil & Gas Industry
- 3.3. Market Restrains
- 3.3.1. Rising Metal Prices Impacting Component Production Costs
- 3.4. Market Trends
- 3.4.1. Increasing Invesment in Oil & Gas Industry
- 4. Market Factor Analysis
- 4.1. Porters Five Forces
- 4.2. Supply/Value Chain
- 4.3. PESTEL analysis
- 4.4. Market Entropy
- 4.5. Patent/Trademark Analysis
- 5. Global Passive Electronic Components Market In The Oil & Gas Industry Analysis, Insights and Forecast, 2019-2031
- 5.1. Market Analysis, Insights and Forecast - by Type
- 5.1.1. Capacitor
- 5.1.2. Inductor
- 5.1.3. Resistor
- 5.2. Market Analysis, Insights and Forecast - by Region
- 5.2.1. North America
- 5.2.2. Europe
- 5.2.3. Asia
- 5.2.4. Australia and New Zealand
- 5.1. Market Analysis, Insights and Forecast - by Type
- 6. North America Passive Electronic Components Market In The Oil & Gas Industry Analysis, Insights and Forecast, 2019-2031
- 6.1. Market Analysis, Insights and Forecast - by Type
- 6.1.1. Capacitor
- 6.1.2. Inductor
- 6.1.3. Resistor
- 6.1. Market Analysis, Insights and Forecast - by Type
- 7. Europe Passive Electronic Components Market In The Oil & Gas Industry Analysis, Insights and Forecast, 2019-2031
- 7.1. Market Analysis, Insights and Forecast - by Type
- 7.1.1. Capacitor
- 7.1.2. Inductor
- 7.1.3. Resistor
- 7.1. Market Analysis, Insights and Forecast - by Type
- 8. Asia Passive Electronic Components Market In The Oil & Gas Industry Analysis, Insights and Forecast, 2019-2031
- 8.1. Market Analysis, Insights and Forecast - by Type
- 8.1.1. Capacitor
- 8.1.2. Inductor
- 8.1.3. Resistor
- 8.1. Market Analysis, Insights and Forecast - by Type
- 9. Australia and New Zealand Passive Electronic Components Market In The Oil & Gas Industry Analysis, Insights and Forecast, 2019-2031
- 9.1. Market Analysis, Insights and Forecast - by Type
- 9.1.1. Capacitor
- 9.1.2. Inductor
- 9.1.3. Resistor
- 9.1. Market Analysis, Insights and Forecast - by Type
- 10. North America Passive Electronic Components Market In The Oil & Gas Industry Analysis, Insights and Forecast, 2019-2031
- 10.1. Market Analysis, Insights and Forecast - By Country/Sub-region
- 10.1.1.
- 11. Europe Passive Electronic Components Market In The Oil & Gas Industry Analysis, Insights and Forecast, 2019-2031
- 11.1. Market Analysis, Insights and Forecast - By Country/Sub-region
- 11.1.1.
- 12. Asia Passive Electronic Components Market In The Oil & Gas Industry Analysis, Insights and Forecast, 2019-2031
- 12.1. Market Analysis, Insights and Forecast - By Country/Sub-region
- 12.1.1.
- 13. Australia and New Zealand Passive Electronic Components Market In The Oil & Gas Industry Analysis, Insights and Forecast, 2019-2031
- 13.1. Market Analysis, Insights and Forecast - By Country/Sub-region
- 13.1.1.
- 14. Competitive Analysis
- 14.1. Global Market Share Analysis 2024
- 14.2. Company Profiles
- 14.2.1 Vishay Intertechnology Inc
- 14.2.1.1. Overview
- 14.2.1.2. Products
- 14.2.1.3. SWOT Analysis
- 14.2.1.4. Recent Developments
- 14.2.1.5. Financials (Based on Availability)
- 14.2.2 AVX Corporation (Kyocera Corporation)
- 14.2.2.1. Overview
- 14.2.2.2. Products
- 14.2.2.3. SWOT Analysis
- 14.2.2.4. Recent Developments
- 14.2.2.5. Financials (Based on Availability)
- 14.2.3 KEMET Corporation (Yageo Company)
- 14.2.3.1. Overview
- 14.2.3.2. Products
- 14.2.3.3. SWOT Analysis
- 14.2.3.4. Recent Developments
- 14.2.3.5. Financials (Based on Availability)
- 14.2.4 Lelon Electronics Corp
- 14.2.4.1. Overview
- 14.2.4.2. Products
- 14.2.4.3. SWOT Analysis
- 14.2.4.4. Recent Developments
- 14.2.4.5. Financials (Based on Availability)
- 14.2.5 API Delevan (Fortive Corporation)
- 14.2.5.1. Overview
- 14.2.5.2. Products
- 14.2.5.3. SWOT Analysis
- 14.2.5.4. Recent Developments
- 14.2.5.5. Financials (Based on Availability)
- 14.2.6 TE Connectivity
- 14.2.6.1. Overview
- 14.2.6.2. Products
- 14.2.6.3. SWOT Analysis
- 14.2.6.4. Recent Developments
- 14.2.6.5. Financials (Based on Availability)
- 14.2.7 Cornell Dubilier Electronics Inc
- 14.2.7.1. Overview
- 14.2.7.2. Products
- 14.2.7.3. SWOT Analysis
- 14.2.7.4. Recent Developments
- 14.2.7.5. Financials (Based on Availability)
- 14.2.8 TDK Corporation
- 14.2.8.1. Overview
- 14.2.8.2. Products
- 14.2.8.3. SWOT Analysis
- 14.2.8.4. Recent Developments
- 14.2.8.5. Financials (Based on Availability)
- 14.2.9 Ohmite Manufacturing Company
- 14.2.9.1. Overview
- 14.2.9.2. Products
- 14.2.9.3. SWOT Analysis
- 14.2.9.4. Recent Developments
- 14.2.9.5. Financials (Based on Availability)
- 14.2.10 Panasonic Corporation
- 14.2.10.1. Overview
- 14.2.10.2. Products
- 14.2.10.3. SWOT Analysis
- 14.2.10.4. Recent Developments
- 14.2.10.5. Financials (Based on Availability)
- 14.2.11 Honeywell International Inc *List Not Exhaustive
- 14.2.11.1. Overview
- 14.2.11.2. Products
- 14.2.11.3. SWOT Analysis
- 14.2.11.4. Recent Developments
- 14.2.11.5. Financials (Based on Availability)
- 14.2.12 Eaton Corporation
- 14.2.12.1. Overview
- 14.2.12.2. Products
- 14.2.12.3. SWOT Analysis
- 14.2.12.4. Recent Developments
- 14.2.12.5. Financials (Based on Availability)
- 14.2.1 Vishay Intertechnology Inc
List of Figures
- Figure 1: Global Passive Electronic Components Market In The Oil & Gas Industry Revenue Breakdown (Million, %) by Region 2024 & 2032
- Figure 2: North America Passive Electronic Components Market In The Oil & Gas Industry Revenue (Million), by Country 2024 & 2032
- Figure 3: North America Passive Electronic Components Market In The Oil & Gas Industry Revenue Share (%), by Country 2024 & 2032
- Figure 4: Europe Passive Electronic Components Market In The Oil & Gas Industry Revenue (Million), by Country 2024 & 2032
- Figure 5: Europe Passive Electronic Components Market In The Oil & Gas Industry Revenue Share (%), by Country 2024 & 2032
- Figure 6: Asia Passive Electronic Components Market In The Oil & Gas Industry Revenue (Million), by Country 2024 & 2032
- Figure 7: Asia Passive Electronic Components Market In The Oil & Gas Industry Revenue Share (%), by Country 2024 & 2032
- Figure 8: Australia and New Zealand Passive Electronic Components Market In The Oil & Gas Industry Revenue (Million), by Country 2024 & 2032
- Figure 9: Australia and New Zealand Passive Electronic Components Market In The Oil & Gas Industry Revenue Share (%), by Country 2024 & 2032
- Figure 10: North America Passive Electronic Components Market In The Oil & Gas Industry Revenue (Million), by Type 2024 & 2032
- Figure 11: North America Passive Electronic Components Market In The Oil & Gas Industry Revenue Share (%), by Type 2024 & 2032
- Figure 12: North America Passive Electronic Components Market In The Oil & Gas Industry Revenue (Million), by Country 2024 & 2032
- Figure 13: North America Passive Electronic Components Market In The Oil & Gas Industry Revenue Share (%), by Country 2024 & 2032
- Figure 14: Europe Passive Electronic Components Market In The Oil & Gas Industry Revenue (Million), by Type 2024 & 2032
- Figure 15: Europe Passive Electronic Components Market In The Oil & Gas Industry Revenue Share (%), by Type 2024 & 2032
- Figure 16: Europe Passive Electronic Components Market In The Oil & Gas Industry Revenue (Million), by Country 2024 & 2032
- Figure 17: Europe Passive Electronic Components Market In The Oil & Gas Industry Revenue Share (%), by Country 2024 & 2032
- Figure 18: Asia Passive Electronic Components Market In The Oil & Gas Industry Revenue (Million), by Type 2024 & 2032
- Figure 19: Asia Passive Electronic Components Market In The Oil & Gas Industry Revenue Share (%), by Type 2024 & 2032
- Figure 20: Asia Passive Electronic Components Market In The Oil & Gas Industry Revenue (Million), by Country 2024 & 2032
- Figure 21: Asia Passive Electronic Components Market In The Oil & Gas Industry Revenue Share (%), by Country 2024 & 2032
- Figure 22: Australia and New Zealand Passive Electronic Components Market In The Oil & Gas Industry Revenue (Million), by Type 2024 & 2032
- Figure 23: Australia and New Zealand Passive Electronic Components Market In The Oil & Gas Industry Revenue Share (%), by Type 2024 & 2032
- Figure 24: Australia and New Zealand Passive Electronic Components Market In The Oil & Gas Industry Revenue (Million), by Country 2024 & 2032
- Figure 25: Australia and New Zealand Passive Electronic Components Market In The Oil & Gas Industry Revenue Share (%), by Country 2024 & 2032
List of Tables
- Table 1: Global Passive Electronic Components Market In The Oil & Gas Industry Revenue Million Forecast, by Region 2019 & 2032
- Table 2: Global Passive Electronic Components Market In The Oil & Gas Industry Revenue Million Forecast, by Type 2019 & 2032
- Table 3: Global Passive Electronic Components Market In The Oil & Gas Industry Revenue Million Forecast, by Region 2019 & 2032
- Table 4: Global Passive Electronic Components Market In The Oil & Gas Industry Revenue Million Forecast, by Country 2019 & 2032
- Table 5: Passive Electronic Components Market In The Oil & Gas Industry Revenue (Million) Forecast, by Application 2019 & 2032
- Table 6: Global Passive Electronic Components Market In The Oil & Gas Industry Revenue Million Forecast, by Country 2019 & 2032
- Table 7: Passive Electronic Components Market In The Oil & Gas Industry Revenue (Million) Forecast, by Application 2019 & 2032
- Table 8: Global Passive Electronic Components Market In The Oil & Gas Industry Revenue Million Forecast, by Country 2019 & 2032
- Table 9: Passive Electronic Components Market In The Oil & Gas Industry Revenue (Million) Forecast, by Application 2019 & 2032
- Table 10: Global Passive Electronic Components Market In The Oil & Gas Industry Revenue Million Forecast, by Country 2019 & 2032
- Table 11: Passive Electronic Components Market In The Oil & Gas Industry Revenue (Million) Forecast, by Application 2019 & 2032
- Table 12: Global Passive Electronic Components Market In The Oil & Gas Industry Revenue Million Forecast, by Type 2019 & 2032
- Table 13: Global Passive Electronic Components Market In The Oil & Gas Industry Revenue Million Forecast, by Country 2019 & 2032
- Table 14: Global Passive Electronic Components Market In The Oil & Gas Industry Revenue Million Forecast, by Type 2019 & 2032
- Table 15: Global Passive Electronic Components Market In The Oil & Gas Industry Revenue Million Forecast, by Country 2019 & 2032
- Table 16: Global Passive Electronic Components Market In The Oil & Gas Industry Revenue Million Forecast, by Type 2019 & 2032
- Table 17: Global Passive Electronic Components Market In The Oil & Gas Industry Revenue Million Forecast, by Country 2019 & 2032
- Table 18: Global Passive Electronic Components Market In The Oil & Gas Industry Revenue Million Forecast, by Type 2019 & 2032
- Table 19: Global Passive Electronic Components Market In The Oil & Gas Industry Revenue Million Forecast, by Country 2019 & 2032
Frequently Asked Questions
1. What is the projected Compound Annual Growth Rate (CAGR) of the Passive Electronic Components Market In The Oil & Gas Industry?
The projected CAGR is approximately 3.90%.
2. Which companies are prominent players in the Passive Electronic Components Market In The Oil & Gas Industry?
Key companies in the market include Vishay Intertechnology Inc, AVX Corporation (Kyocera Corporation), KEMET Corporation (Yageo Company), Lelon Electronics Corp, API Delevan (Fortive Corporation), TE Connectivity, Cornell Dubilier Electronics Inc, TDK Corporation, Ohmite Manufacturing Company, Panasonic Corporation, Honeywell International Inc *List Not Exhaustive, Eaton Corporation.
3. What are the main segments of the Passive Electronic Components Market In The Oil & Gas Industry?
The market segments include Type.
4. Can you provide details about the market size?
The market size is estimated to be USD 3.53 Million as of 2022.
5. What are some drivers contributing to market growth?
Increasing Investments in Oil & Gas Industry.
6. What are the notable trends driving market growth?
Increasing Invesment in Oil & Gas Industry.
7. Are there any restraints impacting market growth?
Rising Metal Prices Impacting Component Production Costs.
8. Can you provide examples of recent developments in the market?
March 2023: Cornell Dubilier Electronics Inc. introduces the 944L series of low inductance, high current DC link film capacitors. The series uses large diameter non-inductive windings and low inductance internal bus connections resulting in equivalent series inductance (ESL) values in the 10 to 15 nano henry range. It is also available in values from 33 to 220uF with voltage ratings of 800, 1000, 1200, and 1400VDC.
9. What pricing options are available for accessing the report?
Pricing options include single-user, multi-user, and enterprise licenses priced at USD 4750, USD 5250, and USD 8750 respectively.
10. Is the market size provided in terms of value or volume?
The market size is provided in terms of value, measured in Million.
11. Are there any specific market keywords associated with the report?
Yes, the market keyword associated with the report is "Passive Electronic Components Market In The Oil & Gas Industry," which aids in identifying and referencing the specific market segment covered.
12. How do I determine which pricing option suits my needs best?
The pricing options vary based on user requirements and access needs. Individual users may opt for single-user licenses, while businesses requiring broader access may choose multi-user or enterprise licenses for cost-effective access to the report.
13. Are there any additional resources or data provided in the Passive Electronic Components Market In The Oil & Gas Industry report?
While the report offers comprehensive insights, it's advisable to review the specific contents or supplementary materials provided to ascertain if additional resources or data are available.
14. How can I stay updated on further developments or reports in the Passive Electronic Components Market In The Oil & Gas Industry?
To stay informed about further developments, trends, and reports in the Passive Electronic Components Market In The Oil & Gas Industry, consider subscribing to industry newsletters, following relevant companies and organizations, or regularly checking reputable industry news sources and publications.
Methodology
Step 1 - Identification of Relevant Samples Size from Population Database


Step 2 - Approaches for Defining Global Market Size (Value, Volume* & Price*)

Note*: In applicable scenarios
Step 3 - Data Sources
Primary Research
- Web Analytics
- Survey Reports
- Research Institute
- Latest Research Reports
- Opinion Leaders
Secondary Research
- Annual Reports
- White Paper
- Latest Press Release
- Industry Association
- Paid Database
- Investor Presentations

Step 4 - Data Triangulation
Involves using different sources of information in order to increase the validity of a study
These sources are likely to be stakeholders in a program - participants, other researchers, program staff, other community members, and so on.
Then we put all data in single framework & apply various statistical tools to find out the dynamic on the market.
During the analysis stage, feedback from the stakeholder groups would be compared to determine areas of agreement as well as areas of divergence
