

Key Insights
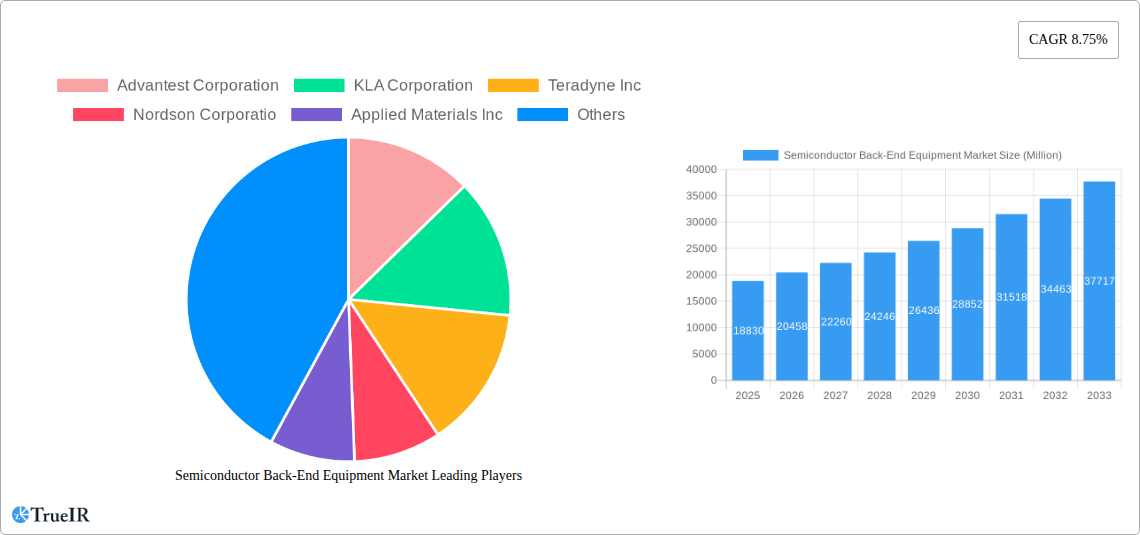
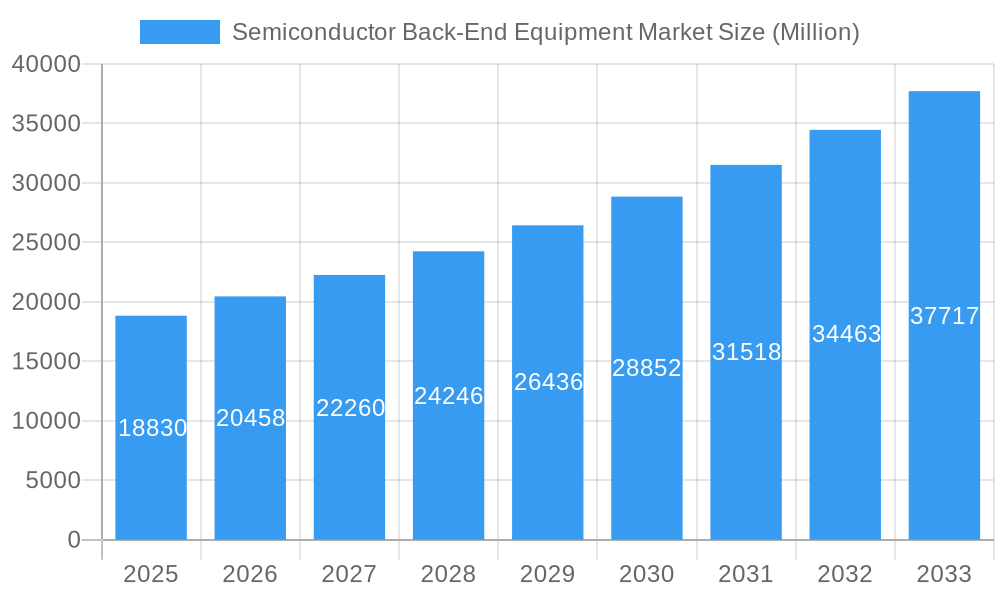
The Semiconductor Back-End Equipment market is experiencing robust growth, projected to reach a market size of $18.83 billion in 2025, expanding at a compound annual growth rate (CAGR) of 8.75%. This expansion is fueled by several key factors. The increasing demand for advanced semiconductor devices in various applications, including smartphones, high-performance computing, and automotive electronics, is a primary driver. Furthermore, the ongoing trend towards miniaturization and higher integration levels in semiconductor chips necessitates sophisticated back-end equipment for precise metrology, inspection, dicing, bonding, assembly, and packaging. Technological advancements in these equipment categories, such as improved automation and precision, are further accelerating market growth. While potential supply chain constraints and geopolitical uncertainties could present challenges, the overall outlook remains positive due to the strong and consistent demand for semiconductors across diverse end-use sectors. Regional growth is expected to be geographically diverse, with North America and Asia Pacific anticipated to hold significant market share, driven by strong manufacturing bases and technological innovation in these regions. The market segmentation by equipment type (metrology and inspection, dicing, bonding, assembly and packaging) indicates substantial opportunities for specialized equipment manufacturers, who can leverage their expertise to cater to the unique demands of different semiconductor fabrication processes.
Semiconductor Back-End Equipment Market Market Size (In Billion)
The competitive landscape is characterized by established players like Advantest Corporation, KLA Corporation, Teradyne Inc., Nordson Corporation, Applied Materials Inc., ASML Holding N.V., Screen Holdings Co. Ltd., Onto Innovation Inc., Tokyo Electron Limited, and LAM Research Corporation. These companies are continuously investing in research and development to enhance product offerings, expand their market reach, and maintain a competitive edge. Strategic alliances, mergers, and acquisitions are likely to shape the market dynamics in the coming years. The forecast period of 2025-2033 presents significant opportunities for growth, driven by the continuous evolution of semiconductor technology and the increasing demand for advanced semiconductor devices across diverse industries globally. This robust growth trajectory suggests a promising outlook for investors and stakeholders in the Semiconductor Back-End Equipment market.
Semiconductor Back-End Equipment Market Company Market Share
Semiconductor Back-End Equipment Market Report: 2019-2033
This comprehensive report provides a detailed analysis of the Semiconductor Back-End Equipment market, offering invaluable insights for industry stakeholders, investors, and researchers. Covering the period 2019-2033, with a base year of 2025 and a forecast period of 2025-2033, this report meticulously examines market dynamics, key players, and future trends. The market is projected to reach xx Million by 2033, exhibiting a CAGR of xx% during the forecast period.
Semiconductor Back-End Equipment Market Market Structure & Competitive Landscape
The Semiconductor Back-End Equipment market is characterized by a moderately concentrated landscape, with a few dominant players holding significant market share. The Herfindahl-Hirschman Index (HHI) is estimated at xx, indicating a moderately consolidated market. Key innovation drivers include advancements in miniaturization, 3D integration technologies, and the increasing demand for high-performance computing (HPC) and artificial intelligence (AI) applications. Regulatory impacts, including export controls and environmental regulations, influence market dynamics. Product substitutes are limited, mainly encompassing older technologies with reduced efficiency. The market is segmented by end-user industry, including consumer electronics, automotive, and data centers. Mergers and acquisitions (M&A) activity has been relatively high in recent years, with an estimated xx Million in M&A volume in 2024. This activity is driven by the need for companies to expand their product portfolios and gain access to new technologies.
- Market Concentration: Moderately concentrated, HHI estimated at xx.
- Innovation Drivers: Miniaturization, 3D integration, AI/HPC demand.
- Regulatory Impacts: Export controls, environmental regulations.
- Product Substitutes: Limited, mainly older, less efficient technologies.
- End-User Segmentation: Consumer electronics, automotive, data centers.
- M&A Trends: High activity, xx Million in volume in 2024.
Semiconductor Back-End Equipment Market Market Trends & Opportunities
The Semiconductor Back-End Equipment market is experiencing robust growth, driven by the increasing demand for advanced semiconductor devices. The market size is projected to grow from xx Million in 2025 to xx Million by 2033. Technological advancements such as Extreme Ultraviolet Lithography (EUV) and advanced packaging techniques are fueling this growth. Consumer preferences are shifting towards smaller, faster, and more energy-efficient devices, further driving demand for sophisticated back-end equipment. The competitive landscape is dynamic, with key players investing heavily in R&D to maintain their market position and introduce innovative products. Market penetration rates vary significantly across different segments and regions, with higher penetration in developed economies. The increasing adoption of 3D integration and advanced packaging technologies presents significant growth opportunities for manufacturers.
Dominant Markets & Segments in Semiconductor Back-End Equipment Market
The Asia-Pacific region, particularly Taiwan, South Korea, and China, dominates the Semiconductor Back-End Equipment market due to the high concentration of semiconductor manufacturing facilities. Within the market segments, Metrology and Inspection holds the largest market share, driven by the stringent quality control requirements in semiconductor manufacturing.
- Leading Region: Asia-Pacific (Taiwan, South Korea, China)
- Dominant Segment: Metrology and Inspection
Key Growth Drivers (Asia-Pacific):
- Robust semiconductor manufacturing infrastructure.
- Supportive government policies promoting technological advancements.
- High demand for consumer electronics and other semiconductor-based products.
- Growing investments in R&D and advanced manufacturing capabilities.
Metrology and Inspection Segment Dominance:
The high precision and reliability required in modern semiconductor manufacturing necessitates robust metrology and inspection processes. This segment’s dominance reflects the critical role it plays in ensuring the quality and yield of semiconductor devices. The segment benefits from continuous technological advancements in inspection techniques and the growing complexity of semiconductor chips, which in turn necessitates increased inspection stringency.
Semiconductor Back-End Equipment Market Product Analysis
Recent innovations in Semiconductor Back-End Equipment focus on increased throughput, enhanced precision, and improved process control. Products now incorporate advanced automation, AI-powered analytics, and improved materials handling to optimize manufacturing efficiency and minimize defects. These advancements cater to the demand for high-performance, energy-efficient semiconductors across various applications. The competitive advantage lies in offering superior equipment performance, reliability, and after-sales support.
Key Drivers, Barriers & Challenges in Semiconductor Back-End Equipment Market
Key Drivers:
The rising demand for advanced semiconductors across various industries, including consumer electronics, automotive, and data centers, is a primary driver. Technological advancements, such as 3D integration and advanced packaging, are also creating new opportunities. Government policies supporting the semiconductor industry in certain regions contribute significantly to growth.
Challenges:
The semiconductor industry is highly capital-intensive, necessitating significant upfront investment. Supply chain disruptions can impact production, causing delays and increasing costs. Intense competition among established players and new entrants also poses a challenge. Furthermore, regulatory complexities and environmental concerns can lead to additional expenses.
Growth Drivers in the Semiconductor Back-End Equipment Market Market
The increasing demand for high-performance computing (HPC) and artificial intelligence (AI) applications is a significant growth driver. Technological advancements such as advanced packaging and 3D integration are creating new market opportunities. Furthermore, government initiatives promoting domestic semiconductor manufacturing in several countries further bolster market growth.
Challenges Impacting Semiconductor Back-End Equipment Market Growth
Supply chain disruptions due to geopolitical factors and the COVID-19 pandemic are significant obstacles. Intense competition among established players and emerging companies puts downward pressure on prices. Stringent environmental regulations and compliance costs are also challenges faced by the industry.
Key Players Shaping the Semiconductor Back-End Equipment Market Market
Significant Semiconductor Back-End Equipment Market Industry Milestones
- December 2023: Tokyo Electron announced the development of Extreme Laser Lift Off (XLO) technology for 3D integration.
- December 2023: Advantest Corporation unveiled new products for AI/HPC market needs, including the HA1200 die-level handler and ATC 2-kW option for the M487x handler series.
Future Outlook for Semiconductor Back-End Equipment Market Market
The Semiconductor Back-End Equipment market is poised for continued growth, driven by ongoing technological advancements and increasing demand for advanced semiconductor devices. Strategic partnerships and investments in R&D will be crucial for companies to maintain a competitive edge. The market presents significant opportunities for companies offering innovative solutions that address the evolving needs of the semiconductor industry.
Semiconductor Back-End Equipment Market Segmentation
-
1. Type
- 1.1. Metrology and Inspection
- 1.2. Dicing
- 1.3. Bonding
- 1.4. Assembly and Packaging
-
2. End-Use Industry
- 2.1. Semiconductors
- 2.2. Electronics
- 2.3. Automotive
- 2.4. Medical
- 2.5. Defense
Semiconductor Back-End Equipment Market Segmentation By Geography
- 1. United States
- 2. Europe
- 3. China
- 4. South Korea
- 5. Taiwan
- 6. Japan
- 7. Rest of the Asia Pacific
- 8. Rest of the World
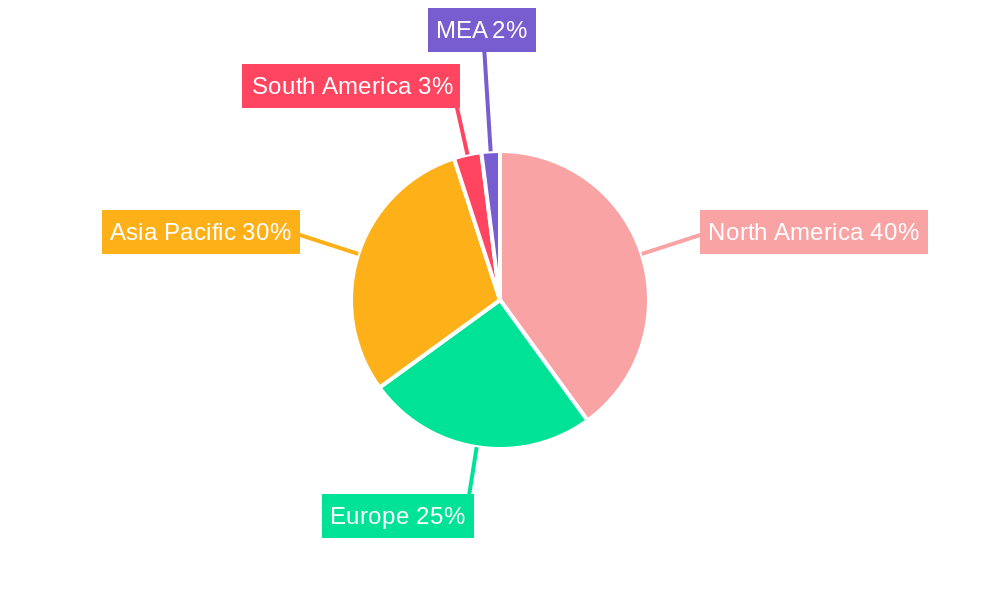
Semiconductor Back-End Equipment Market Regional Market Share
Geographic Coverage of Semiconductor Back-End Equipment Market
Semiconductor Back-End Equipment Market REPORT HIGHLIGHTS
| Aspects | Details |
|---|---|
| Study Period | 2020-2034 |
| Base Year | 2025 |
| Estimated Year | 2026 |
| Forecast Period | 2026-2034 |
| Historical Period | 2020-2025 |
| Growth Rate | CAGR of 8.75% from 2020-2034 |
| Segmentation |
|
Table of Contents
- 1. Introduction
- 1.1. Research Scope
- 1.2. Market Segmentation
- 1.3. Research Objective
- 1.4. Definitions and Assumptions
- 2. Executive Summary
- 2.1. Market Snapshot
- 3. Market Dynamics
- 3.1. Market Drivers
- 3.2. Market Restrains
- 3.3. Market Trends
- 3.4. Market Opportunities
- 4. Market Factor Analysis
- 4.1. Porters Five Forces
- 4.1.1. Bargaining Power of Suppliers
- 4.1.2. Bargaining Power of Buyers
- 4.1.3. Threat of New Entrants
- 4.1.4. Threat of Substitutes
- 4.1.5. Competitive Rivalry
- 4.2. PESTEL analysis
- 4.3. BCG Analysis
- 4.3.1. Stars (High Growth, High Market Share)
- 4.3.2. Cash Cows (Low Growth, High Market Share)
- 4.3.3. Question Mark (High Growth, Low Market Share)
- 4.3.4. Dogs (Low Growth, Low Market Share)
- 4.4. Ansoff Matrix Analysis
- 4.5. Supply Chain Analysis
- 4.6. Regulatory Landscape
- 4.7. Current Market Potential and Opportunity Assessment (TAM–SAM–SOM Framework)
- 4.8. TIR Analyst Note
- 4.1. Porters Five Forces
- 5. Market Analysis, Insights and Forecast 2021-2033
- 5.1. Market Analysis, Insights and Forecast - by Type
- 5.1.1. Metrology and Inspection
- 5.1.2. Dicing
- 5.1.3. Bonding
- 5.1.4. Assembly and Packaging
- 5.2. Market Analysis, Insights and Forecast - by End-Use Industry
- 5.2.1. Semiconductors
- 5.2.2. Electronics
- 5.2.3. Automotive
- 5.2.4. Medical
- 5.2.5. Defense
- 5.3. Market Analysis, Insights and Forecast - by Region
- 5.3.1. United States
- 5.3.2. Europe
- 5.3.3. China
- 5.3.4. South Korea
- 5.3.5. Taiwan
- 5.3.6. Japan
- 5.3.7. Rest of the Asia Pacific
- 5.3.8. Rest of the World
- 5.1. Market Analysis, Insights and Forecast - by Type
- 6. Global Semiconductor Back-End Equipment Market Analysis, Insights and Forecast, 2021-2033
- 6.1. Market Analysis, Insights and Forecast - by Type
- 6.1.1. Metrology and Inspection
- 6.1.2. Dicing
- 6.1.3. Bonding
- 6.1.4. Assembly and Packaging
- 6.2. Market Analysis, Insights and Forecast - by End-Use Industry
- 6.2.1. Semiconductors
- 6.2.2. Electronics
- 6.2.3. Automotive
- 6.2.4. Medical
- 6.2.5. Defense
- 6.1. Market Analysis, Insights and Forecast - by Type
- 7. United States Semiconductor Back-End Equipment Market Analysis, Insights and Forecast, 2020-2032
- 7.1. Market Analysis, Insights and Forecast - by Type
- 7.1.1. Metrology and Inspection
- 7.1.2. Dicing
- 7.1.3. Bonding
- 7.1.4. Assembly and Packaging
- 7.2. Market Analysis, Insights and Forecast - by End-Use Industry
- 7.2.1. Semiconductors
- 7.2.2. Electronics
- 7.2.3. Automotive
- 7.2.4. Medical
- 7.2.5. Defense
- 7.1. Market Analysis, Insights and Forecast - by Type
- 8. Europe Semiconductor Back-End Equipment Market Analysis, Insights and Forecast, 2020-2032
- 8.1. Market Analysis, Insights and Forecast - by Type
- 8.1.1. Metrology and Inspection
- 8.1.2. Dicing
- 8.1.3. Bonding
- 8.1.4. Assembly and Packaging
- 8.2. Market Analysis, Insights and Forecast - by End-Use Industry
- 8.2.1. Semiconductors
- 8.2.2. Electronics
- 8.2.3. Automotive
- 8.2.4. Medical
- 8.2.5. Defense
- 8.1. Market Analysis, Insights and Forecast - by Type
- 9. China Semiconductor Back-End Equipment Market Analysis, Insights and Forecast, 2020-2032
- 9.1. Market Analysis, Insights and Forecast - by Type
- 9.1.1. Metrology and Inspection
- 9.1.2. Dicing
- 9.1.3. Bonding
- 9.1.4. Assembly and Packaging
- 9.2. Market Analysis, Insights and Forecast - by End-Use Industry
- 9.2.1. Semiconductors
- 9.2.2. Electronics
- 9.2.3. Automotive
- 9.2.4. Medical
- 9.2.5. Defense
- 9.1. Market Analysis, Insights and Forecast - by Type
- 10. South Korea Semiconductor Back-End Equipment Market Analysis, Insights and Forecast, 2020-2032
- 10.1. Market Analysis, Insights and Forecast - by Type
- 10.1.1. Metrology and Inspection
- 10.1.2. Dicing
- 10.1.3. Bonding
- 10.1.4. Assembly and Packaging
- 10.2. Market Analysis, Insights and Forecast - by End-Use Industry
- 10.2.1. Semiconductors
- 10.2.2. Electronics
- 10.2.3. Automotive
- 10.2.4. Medical
- 10.2.5. Defense
- 10.1. Market Analysis, Insights and Forecast - by Type
- 11. Taiwan Semiconductor Back-End Equipment Market Analysis, Insights and Forecast, 2020-2032
- 11.1. Market Analysis, Insights and Forecast - by Type
- 11.1.1. Metrology and Inspection
- 11.1.2. Dicing
- 11.1.3. Bonding
- 11.1.4. Assembly and Packaging
- 11.2. Market Analysis, Insights and Forecast - by End-Use Industry
- 11.2.1. Semiconductors
- 11.2.2. Electronics
- 11.2.3. Automotive
- 11.2.4. Medical
- 11.2.5. Defense
- 11.1. Market Analysis, Insights and Forecast - by Type
- 12. Japan Semiconductor Back-End Equipment Market Analysis, Insights and Forecast, 2020-2032
- 12.1. Market Analysis, Insights and Forecast - by Type
- 12.1.1. Metrology and Inspection
- 12.1.2. Dicing
- 12.1.3. Bonding
- 12.1.4. Assembly and Packaging
- 12.2. Market Analysis, Insights and Forecast - by End-Use Industry
- 12.2.1. Semiconductors
- 12.2.2. Electronics
- 12.2.3. Automotive
- 12.2.4. Medical
- 12.2.5. Defense
- 12.1. Market Analysis, Insights and Forecast - by Type
- 13. Rest of the Asia Pacific Semiconductor Back-End Equipment Market Analysis, Insights and Forecast, 2020-2032
- 13.1. Market Analysis, Insights and Forecast - by Type
- 13.1.1. Metrology and Inspection
- 13.1.2. Dicing
- 13.1.3. Bonding
- 13.1.4. Assembly and Packaging
- 13.2. Market Analysis, Insights and Forecast - by End-Use Industry
- 13.2.1. Semiconductors
- 13.2.2. Electronics
- 13.2.3. Automotive
- 13.2.4. Medical
- 13.2.5. Defense
- 13.1. Market Analysis, Insights and Forecast - by Type
- 14. Rest of the World Semiconductor Back-End Equipment Market Analysis, Insights and Forecast, 2020-2032
- 14.1. Market Analysis, Insights and Forecast - by Type
- 14.1.1. Metrology and Inspection
- 14.1.2. Dicing
- 14.1.3. Bonding
- 14.1.4. Assembly and Packaging
- 14.2. Market Analysis, Insights and Forecast - by End-Use Industry
- 14.2.1. Semiconductors
- 14.2.2. Electronics
- 14.2.3. Automotive
- 14.2.4. Medical
- 14.2.5. Defense
- 14.1. Market Analysis, Insights and Forecast - by Type
- 15. Competitive Analysis
- 15.1. Company Profiles
- 15.1.1 Advantest Corporation
- 15.1.1.1. Company Overview
- 15.1.1.2. Products
- 15.1.1.3. Company Financials
- 15.1.1.4. SWOT Analysis
- 15.1.2 KLA Corporation
- 15.1.2.1. Company Overview
- 15.1.2.2. Products
- 15.1.2.3. Company Financials
- 15.1.2.4. SWOT Analysis
- 15.1.3 Teradyne Inc
- 15.1.3.1. Company Overview
- 15.1.3.2. Products
- 15.1.3.3. Company Financials
- 15.1.3.4. SWOT Analysis
- 15.1.4 Nordson Corporatio
- 15.1.4.1. Company Overview
- 15.1.4.2. Products
- 15.1.4.3. Company Financials
- 15.1.4.4. SWOT Analysis
- 15.1.5 Applied Materials Inc
- 15.1.5.1. Company Overview
- 15.1.5.2. Products
- 15.1.5.3. Company Financials
- 15.1.5.4. SWOT Analysis
- 15.1.6 ASML Holding N V
- 15.1.6.1. Company Overview
- 15.1.6.2. Products
- 15.1.6.3. Company Financials
- 15.1.6.4. SWOT Analysis
- 15.1.7 Screen Holdings Co Ltd
- 15.1.7.1. Company Overview
- 15.1.7.2. Products
- 15.1.7.3. Company Financials
- 15.1.7.4. SWOT Analysis
- 15.1.8 Onto Innovation Inc
- 15.1.8.1. Company Overview
- 15.1.8.2. Products
- 15.1.8.3. Company Financials
- 15.1.8.4. SWOT Analysis
- 15.1.9 Tokyo Electron Limited
- 15.1.9.1. Company Overview
- 15.1.9.2. Products
- 15.1.9.3. Company Financials
- 15.1.9.4. SWOT Analysis
- 15.1.10 LAM Research Corporation
- 15.1.10.1. Company Overview
- 15.1.10.2. Products
- 15.1.10.3. Company Financials
- 15.1.10.4. SWOT Analysis
- 15.1.1 Advantest Corporation
- 15.2. Market Entropy
- 15.2.1 Company's Key Areas Served
- 15.2.2 Recent Developments
- 15.3. Company Market Share Analysis 2025
- 15.3.1 Top 5 Companies Market Share Analysis
- 15.3.2 Top 3 Companies Market Share Analysis
- 15.4. List of Potential Customers
- 16. Research Methodology
List of Figures
- Figure 1: Global Semiconductor Back-End Equipment Market Revenue Breakdown (Million, %) by Region 2025 & 2033
- Figure 2: Global Semiconductor Back-End Equipment Market Volume Breakdown (K Unit, %) by Region 2025 & 2033
- Figure 3: United States Semiconductor Back-End Equipment Market Revenue (Million), by Type 2025 & 2033
- Figure 4: United States Semiconductor Back-End Equipment Market Volume (K Unit), by Type 2025 & 2033
- Figure 5: United States Semiconductor Back-End Equipment Market Revenue Share (%), by Type 2025 & 2033
- Figure 6: United States Semiconductor Back-End Equipment Market Volume Share (%), by Type 2025 & 2033
- Figure 7: United States Semiconductor Back-End Equipment Market Revenue (Million), by End-Use Industry 2025 & 2033
- Figure 8: United States Semiconductor Back-End Equipment Market Volume (K Unit), by End-Use Industry 2025 & 2033
- Figure 9: United States Semiconductor Back-End Equipment Market Revenue Share (%), by End-Use Industry 2025 & 2033
- Figure 10: United States Semiconductor Back-End Equipment Market Volume Share (%), by End-Use Industry 2025 & 2033
- Figure 11: United States Semiconductor Back-End Equipment Market Revenue (Million), by Country 2025 & 2033
- Figure 12: United States Semiconductor Back-End Equipment Market Volume (K Unit), by Country 2025 & 2033
- Figure 13: United States Semiconductor Back-End Equipment Market Revenue Share (%), by Country 2025 & 2033
- Figure 14: United States Semiconductor Back-End Equipment Market Volume Share (%), by Country 2025 & 2033
- Figure 15: Europe Semiconductor Back-End Equipment Market Revenue (Million), by Type 2025 & 2033
- Figure 16: Europe Semiconductor Back-End Equipment Market Volume (K Unit), by Type 2025 & 2033
- Figure 17: Europe Semiconductor Back-End Equipment Market Revenue Share (%), by Type 2025 & 2033
- Figure 18: Europe Semiconductor Back-End Equipment Market Volume Share (%), by Type 2025 & 2033
- Figure 19: Europe Semiconductor Back-End Equipment Market Revenue (Million), by End-Use Industry 2025 & 2033
- Figure 20: Europe Semiconductor Back-End Equipment Market Volume (K Unit), by End-Use Industry 2025 & 2033
- Figure 21: Europe Semiconductor Back-End Equipment Market Revenue Share (%), by End-Use Industry 2025 & 2033
- Figure 22: Europe Semiconductor Back-End Equipment Market Volume Share (%), by End-Use Industry 2025 & 2033
- Figure 23: Europe Semiconductor Back-End Equipment Market Revenue (Million), by Country 2025 & 2033
- Figure 24: Europe Semiconductor Back-End Equipment Market Volume (K Unit), by Country 2025 & 2033
- Figure 25: Europe Semiconductor Back-End Equipment Market Revenue Share (%), by Country 2025 & 2033
- Figure 26: Europe Semiconductor Back-End Equipment Market Volume Share (%), by Country 2025 & 2033
- Figure 27: China Semiconductor Back-End Equipment Market Revenue (Million), by Type 2025 & 2033
- Figure 28: China Semiconductor Back-End Equipment Market Volume (K Unit), by Type 2025 & 2033
- Figure 29: China Semiconductor Back-End Equipment Market Revenue Share (%), by Type 2025 & 2033
- Figure 30: China Semiconductor Back-End Equipment Market Volume Share (%), by Type 2025 & 2033
- Figure 31: China Semiconductor Back-End Equipment Market Revenue (Million), by End-Use Industry 2025 & 2033
- Figure 32: China Semiconductor Back-End Equipment Market Volume (K Unit), by End-Use Industry 2025 & 2033
- Figure 33: China Semiconductor Back-End Equipment Market Revenue Share (%), by End-Use Industry 2025 & 2033
- Figure 34: China Semiconductor Back-End Equipment Market Volume Share (%), by End-Use Industry 2025 & 2033
- Figure 35: China Semiconductor Back-End Equipment Market Revenue (Million), by Country 2025 & 2033
- Figure 36: China Semiconductor Back-End Equipment Market Volume (K Unit), by Country 2025 & 2033
- Figure 37: China Semiconductor Back-End Equipment Market Revenue Share (%), by Country 2025 & 2033
- Figure 38: China Semiconductor Back-End Equipment Market Volume Share (%), by Country 2025 & 2033
- Figure 39: South Korea Semiconductor Back-End Equipment Market Revenue (Million), by Type 2025 & 2033
- Figure 40: South Korea Semiconductor Back-End Equipment Market Volume (K Unit), by Type 2025 & 2033
- Figure 41: South Korea Semiconductor Back-End Equipment Market Revenue Share (%), by Type 2025 & 2033
- Figure 42: South Korea Semiconductor Back-End Equipment Market Volume Share (%), by Type 2025 & 2033
- Figure 43: South Korea Semiconductor Back-End Equipment Market Revenue (Million), by End-Use Industry 2025 & 2033
- Figure 44: South Korea Semiconductor Back-End Equipment Market Volume (K Unit), by End-Use Industry 2025 & 2033
- Figure 45: South Korea Semiconductor Back-End Equipment Market Revenue Share (%), by End-Use Industry 2025 & 2033
- Figure 46: South Korea Semiconductor Back-End Equipment Market Volume Share (%), by End-Use Industry 2025 & 2033
- Figure 47: South Korea Semiconductor Back-End Equipment Market Revenue (Million), by Country 2025 & 2033
- Figure 48: South Korea Semiconductor Back-End Equipment Market Volume (K Unit), by Country 2025 & 2033
- Figure 49: South Korea Semiconductor Back-End Equipment Market Revenue Share (%), by Country 2025 & 2033
- Figure 50: South Korea Semiconductor Back-End Equipment Market Volume Share (%), by Country 2025 & 2033
- Figure 51: Taiwan Semiconductor Back-End Equipment Market Revenue (Million), by Type 2025 & 2033
- Figure 52: Taiwan Semiconductor Back-End Equipment Market Volume (K Unit), by Type 2025 & 2033
- Figure 53: Taiwan Semiconductor Back-End Equipment Market Revenue Share (%), by Type 2025 & 2033
- Figure 54: Taiwan Semiconductor Back-End Equipment Market Volume Share (%), by Type 2025 & 2033
- Figure 55: Taiwan Semiconductor Back-End Equipment Market Revenue (Million), by End-Use Industry 2025 & 2033
- Figure 56: Taiwan Semiconductor Back-End Equipment Market Volume (K Unit), by End-Use Industry 2025 & 2033
- Figure 57: Taiwan Semiconductor Back-End Equipment Market Revenue Share (%), by End-Use Industry 2025 & 2033
- Figure 58: Taiwan Semiconductor Back-End Equipment Market Volume Share (%), by End-Use Industry 2025 & 2033
- Figure 59: Taiwan Semiconductor Back-End Equipment Market Revenue (Million), by Country 2025 & 2033
- Figure 60: Taiwan Semiconductor Back-End Equipment Market Volume (K Unit), by Country 2025 & 2033
- Figure 61: Taiwan Semiconductor Back-End Equipment Market Revenue Share (%), by Country 2025 & 2033
- Figure 62: Taiwan Semiconductor Back-End Equipment Market Volume Share (%), by Country 2025 & 2033
- Figure 63: Japan Semiconductor Back-End Equipment Market Revenue (Million), by Type 2025 & 2033
- Figure 64: Japan Semiconductor Back-End Equipment Market Volume (K Unit), by Type 2025 & 2033
- Figure 65: Japan Semiconductor Back-End Equipment Market Revenue Share (%), by Type 2025 & 2033
- Figure 66: Japan Semiconductor Back-End Equipment Market Volume Share (%), by Type 2025 & 2033
- Figure 67: Japan Semiconductor Back-End Equipment Market Revenue (Million), by End-Use Industry 2025 & 2033
- Figure 68: Japan Semiconductor Back-End Equipment Market Volume (K Unit), by End-Use Industry 2025 & 2033
- Figure 69: Japan Semiconductor Back-End Equipment Market Revenue Share (%), by End-Use Industry 2025 & 2033
- Figure 70: Japan Semiconductor Back-End Equipment Market Volume Share (%), by End-Use Industry 2025 & 2033
- Figure 71: Japan Semiconductor Back-End Equipment Market Revenue (Million), by Country 2025 & 2033
- Figure 72: Japan Semiconductor Back-End Equipment Market Volume (K Unit), by Country 2025 & 2033
- Figure 73: Japan Semiconductor Back-End Equipment Market Revenue Share (%), by Country 2025 & 2033
- Figure 74: Japan Semiconductor Back-End Equipment Market Volume Share (%), by Country 2025 & 2033
- Figure 75: Rest of the Asia Pacific Semiconductor Back-End Equipment Market Revenue (Million), by Type 2025 & 2033
- Figure 76: Rest of the Asia Pacific Semiconductor Back-End Equipment Market Volume (K Unit), by Type 2025 & 2033
- Figure 77: Rest of the Asia Pacific Semiconductor Back-End Equipment Market Revenue Share (%), by Type 2025 & 2033
- Figure 78: Rest of the Asia Pacific Semiconductor Back-End Equipment Market Volume Share (%), by Type 2025 & 2033
- Figure 79: Rest of the Asia Pacific Semiconductor Back-End Equipment Market Revenue (Million), by End-Use Industry 2025 & 2033
- Figure 80: Rest of the Asia Pacific Semiconductor Back-End Equipment Market Volume (K Unit), by End-Use Industry 2025 & 2033
- Figure 81: Rest of the Asia Pacific Semiconductor Back-End Equipment Market Revenue Share (%), by End-Use Industry 2025 & 2033
- Figure 82: Rest of the Asia Pacific Semiconductor Back-End Equipment Market Volume Share (%), by End-Use Industry 2025 & 2033
- Figure 83: Rest of the Asia Pacific Semiconductor Back-End Equipment Market Revenue (Million), by Country 2025 & 2033
- Figure 84: Rest of the Asia Pacific Semiconductor Back-End Equipment Market Volume (K Unit), by Country 2025 & 2033
- Figure 85: Rest of the Asia Pacific Semiconductor Back-End Equipment Market Revenue Share (%), by Country 2025 & 2033
- Figure 86: Rest of the Asia Pacific Semiconductor Back-End Equipment Market Volume Share (%), by Country 2025 & 2033
- Figure 87: Rest of the World Semiconductor Back-End Equipment Market Revenue (Million), by Type 2025 & 2033
- Figure 88: Rest of the World Semiconductor Back-End Equipment Market Volume (K Unit), by Type 2025 & 2033
- Figure 89: Rest of the World Semiconductor Back-End Equipment Market Revenue Share (%), by Type 2025 & 2033
- Figure 90: Rest of the World Semiconductor Back-End Equipment Market Volume Share (%), by Type 2025 & 2033
- Figure 91: Rest of the World Semiconductor Back-End Equipment Market Revenue (Million), by End-Use Industry 2025 & 2033
- Figure 92: Rest of the World Semiconductor Back-End Equipment Market Volume (K Unit), by End-Use Industry 2025 & 2033
- Figure 93: Rest of the World Semiconductor Back-End Equipment Market Revenue Share (%), by End-Use Industry 2025 & 2033
- Figure 94: Rest of the World Semiconductor Back-End Equipment Market Volume Share (%), by End-Use Industry 2025 & 2033
- Figure 95: Rest of the World Semiconductor Back-End Equipment Market Revenue (Million), by Country 2025 & 2033
- Figure 96: Rest of the World Semiconductor Back-End Equipment Market Volume (K Unit), by Country 2025 & 2033
- Figure 97: Rest of the World Semiconductor Back-End Equipment Market Revenue Share (%), by Country 2025 & 2033
- Figure 98: Rest of the World Semiconductor Back-End Equipment Market Volume Share (%), by Country 2025 & 2033
List of Tables
- Table 1: Global Semiconductor Back-End Equipment Market Revenue Million Forecast, by Type 2020 & 2033
- Table 2: Global Semiconductor Back-End Equipment Market Volume K Unit Forecast, by Type 2020 & 2033
- Table 3: Global Semiconductor Back-End Equipment Market Revenue Million Forecast, by End-Use Industry 2020 & 2033
- Table 4: Global Semiconductor Back-End Equipment Market Volume K Unit Forecast, by End-Use Industry 2020 & 2033
- Table 5: Global Semiconductor Back-End Equipment Market Revenue Million Forecast, by Region 2020 & 2033
- Table 6: Global Semiconductor Back-End Equipment Market Volume K Unit Forecast, by Region 2020 & 2033
- Table 7: Global Semiconductor Back-End Equipment Market Revenue Million Forecast, by Type 2020 & 2033
- Table 8: Global Semiconductor Back-End Equipment Market Volume K Unit Forecast, by Type 2020 & 2033
- Table 9: Global Semiconductor Back-End Equipment Market Revenue Million Forecast, by End-Use Industry 2020 & 2033
- Table 10: Global Semiconductor Back-End Equipment Market Volume K Unit Forecast, by End-Use Industry 2020 & 2033
- Table 11: Global Semiconductor Back-End Equipment Market Revenue Million Forecast, by Country 2020 & 2033
- Table 12: Global Semiconductor Back-End Equipment Market Volume K Unit Forecast, by Country 2020 & 2033
- Table 13: Global Semiconductor Back-End Equipment Market Revenue Million Forecast, by Type 2020 & 2033
- Table 14: Global Semiconductor Back-End Equipment Market Volume K Unit Forecast, by Type 2020 & 2033
- Table 15: Global Semiconductor Back-End Equipment Market Revenue Million Forecast, by End-Use Industry 2020 & 2033
- Table 16: Global Semiconductor Back-End Equipment Market Volume K Unit Forecast, by End-Use Industry 2020 & 2033
- Table 17: Global Semiconductor Back-End Equipment Market Revenue Million Forecast, by Country 2020 & 2033
- Table 18: Global Semiconductor Back-End Equipment Market Volume K Unit Forecast, by Country 2020 & 2033
- Table 19: Global Semiconductor Back-End Equipment Market Revenue Million Forecast, by Type 2020 & 2033
- Table 20: Global Semiconductor Back-End Equipment Market Volume K Unit Forecast, by Type 2020 & 2033
- Table 21: Global Semiconductor Back-End Equipment Market Revenue Million Forecast, by End-Use Industry 2020 & 2033
- Table 22: Global Semiconductor Back-End Equipment Market Volume K Unit Forecast, by End-Use Industry 2020 & 2033
- Table 23: Global Semiconductor Back-End Equipment Market Revenue Million Forecast, by Country 2020 & 2033
- Table 24: Global Semiconductor Back-End Equipment Market Volume K Unit Forecast, by Country 2020 & 2033
- Table 25: Global Semiconductor Back-End Equipment Market Revenue Million Forecast, by Type 2020 & 2033
- Table 26: Global Semiconductor Back-End Equipment Market Volume K Unit Forecast, by Type 2020 & 2033
- Table 27: Global Semiconductor Back-End Equipment Market Revenue Million Forecast, by End-Use Industry 2020 & 2033
- Table 28: Global Semiconductor Back-End Equipment Market Volume K Unit Forecast, by End-Use Industry 2020 & 2033
- Table 29: Global Semiconductor Back-End Equipment Market Revenue Million Forecast, by Country 2020 & 2033
- Table 30: Global Semiconductor Back-End Equipment Market Volume K Unit Forecast, by Country 2020 & 2033
- Table 31: Global Semiconductor Back-End Equipment Market Revenue Million Forecast, by Type 2020 & 2033
- Table 32: Global Semiconductor Back-End Equipment Market Volume K Unit Forecast, by Type 2020 & 2033
- Table 33: Global Semiconductor Back-End Equipment Market Revenue Million Forecast, by End-Use Industry 2020 & 2033
- Table 34: Global Semiconductor Back-End Equipment Market Volume K Unit Forecast, by End-Use Industry 2020 & 2033
- Table 35: Global Semiconductor Back-End Equipment Market Revenue Million Forecast, by Country 2020 & 2033
- Table 36: Global Semiconductor Back-End Equipment Market Volume K Unit Forecast, by Country 2020 & 2033
- Table 37: Global Semiconductor Back-End Equipment Market Revenue Million Forecast, by Type 2020 & 2033
- Table 38: Global Semiconductor Back-End Equipment Market Volume K Unit Forecast, by Type 2020 & 2033
- Table 39: Global Semiconductor Back-End Equipment Market Revenue Million Forecast, by End-Use Industry 2020 & 2033
- Table 40: Global Semiconductor Back-End Equipment Market Volume K Unit Forecast, by End-Use Industry 2020 & 2033
- Table 41: Global Semiconductor Back-End Equipment Market Revenue Million Forecast, by Country 2020 & 2033
- Table 42: Global Semiconductor Back-End Equipment Market Volume K Unit Forecast, by Country 2020 & 2033
- Table 43: Global Semiconductor Back-End Equipment Market Revenue Million Forecast, by Type 2020 & 2033
- Table 44: Global Semiconductor Back-End Equipment Market Volume K Unit Forecast, by Type 2020 & 2033
- Table 45: Global Semiconductor Back-End Equipment Market Revenue Million Forecast, by End-Use Industry 2020 & 2033
- Table 46: Global Semiconductor Back-End Equipment Market Volume K Unit Forecast, by End-Use Industry 2020 & 2033
- Table 47: Global Semiconductor Back-End Equipment Market Revenue Million Forecast, by Country 2020 & 2033
- Table 48: Global Semiconductor Back-End Equipment Market Volume K Unit Forecast, by Country 2020 & 2033
- Table 49: Global Semiconductor Back-End Equipment Market Revenue Million Forecast, by Type 2020 & 2033
- Table 50: Global Semiconductor Back-End Equipment Market Volume K Unit Forecast, by Type 2020 & 2033
- Table 51: Global Semiconductor Back-End Equipment Market Revenue Million Forecast, by End-Use Industry 2020 & 2033
- Table 52: Global Semiconductor Back-End Equipment Market Volume K Unit Forecast, by End-Use Industry 2020 & 2033
- Table 53: Global Semiconductor Back-End Equipment Market Revenue Million Forecast, by Country 2020 & 2033
- Table 54: Global Semiconductor Back-End Equipment Market Volume K Unit Forecast, by Country 2020 & 2033
Frequently Asked Questions
1. What is the projected Compound Annual Growth Rate (CAGR) of the Semiconductor Back-End Equipment Market?
The projected CAGR is approximately 8.75%.
2. Which companies are prominent players in the Semiconductor Back-End Equipment Market?
Key companies in the market include Advantest Corporation, KLA Corporation, Teradyne Inc, Nordson Corporatio, Applied Materials Inc, ASML Holding N V, Screen Holdings Co Ltd, Onto Innovation Inc, Tokyo Electron Limited, LAM Research Corporation.
3. What are the main segments of the Semiconductor Back-End Equipment Market?
The market segments include Type, End-Use Industry.
4. Can you provide details about the market size?
The market size is estimated to be USD 18.83 Million as of 2022.
5. What are some drivers contributing to market growth?
Increasing Demand for Semiconductors in Electric and Hybrid Vehicles; Demand for Setting Up New Foundries (International Chip Shortage).
6. What are the notable trends driving market growth?
Assembly and Packaging Segment is Expected to Witness Significant Growth.
7. Are there any restraints impacting market growth?
High Setup Costs; Constant Evolution of Products Influencing Demand.
8. Can you provide examples of recent developments in the market?
December 2023: Tokyo Electron announced that it has developed an Extreme Laser Lift Off (XLO) technology that contributes to innovations in 3D integration of advanced semiconductor devices adopting permanent wafer bonding. This new technology for two permanently bonded silicon wafers uses a laser to separate the top silicon substrate from the bottom substrate with an integrated circuit layer.
9. What pricing options are available for accessing the report?
Pricing options include single-user, multi-user, and enterprise licenses priced at USD 4750, USD 5250, and USD 8750 respectively.
10. Is the market size provided in terms of value or volume?
The market size is provided in terms of value, measured in Million and volume, measured in K Unit.
11. Are there any specific market keywords associated with the report?
Yes, the market keyword associated with the report is "Semiconductor Back-End Equipment Market," which aids in identifying and referencing the specific market segment covered.
12. How do I determine which pricing option suits my needs best?
The pricing options vary based on user requirements and access needs. Individual users may opt for single-user licenses, while businesses requiring broader access may choose multi-user or enterprise licenses for cost-effective access to the report.
13. Are there any additional resources or data provided in the Semiconductor Back-End Equipment Market report?
While the report offers comprehensive insights, it's advisable to review the specific contents or supplementary materials provided to ascertain if additional resources or data are available.
14. How can I stay updated on further developments or reports in the Semiconductor Back-End Equipment Market?
To stay informed about further developments, trends, and reports in the Semiconductor Back-End Equipment Market, consider subscribing to industry newsletters, following relevant companies and organizations, or regularly checking reputable industry news sources and publications.
Methodology
Step 1 - Identification of Relevant Samples Size from Population Database


Step 2 - Approaches for Defining Global Market Size (Value, Volume* & Price*)

Note*: In applicable scenarios
Step 3 - Data Sources
Primary Research
- Web Analytics
- Survey Reports
- Research Institute
- Latest Research Reports
- Opinion Leaders
Secondary Research
- Annual Reports
- White Paper
- Latest Press Release
- Industry Association
- Paid Database
- Investor Presentations

Step 4 - Data Triangulation
Involves using different sources of information in order to increase the validity of a study
These sources are likely to be stakeholders in a program - participants, other researchers, program staff, other community members, and so on.
Then we put all data in single framework & apply various statistical tools to find out the dynamic on the market.
During the analysis stage, feedback from the stakeholder groups would be compared to determine areas of agreement as well as areas of divergence