

Key Insights
The Analog & Mixed Signal (AMS) IP market is experiencing robust growth, driven by the increasing demand for advanced functionalities in diverse applications. The market, valued at $193.82 million in 2025, is projected to expand at a Compound Annual Growth Rate (CAGR) of 15.17% from 2025 to 2033. This surge is fueled by several key factors. The proliferation of smart devices, the rise of the Internet of Things (IoT), and the advancements in automotive electronics are significantly boosting the demand for high-performance AMS IPs. Furthermore, the growing adoption of 5G and the increasing need for energy-efficient solutions are pushing innovation and adoption in this sector. Key segments contributing to this growth include the A2D and D2A converters, power management modules, and RF components, which are integrated into various end-user industries such as consumer electronics, telecommunications, automotive, and industrial applications. The dominance of hard IP currently reflects the need for high performance and security in critical applications. However, a growing preference for flexible and customizable solutions is fostering the growth of the soft/firm IP segment. Leading companies such as Xilinx, Renesas, and Synopsys are actively shaping the market landscape through continuous innovation and strategic acquisitions.
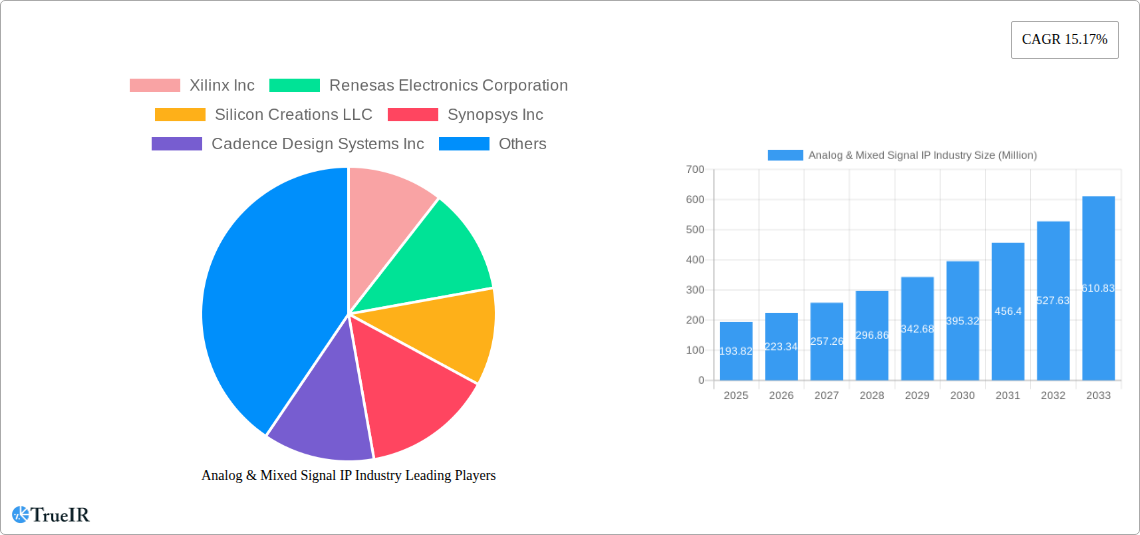
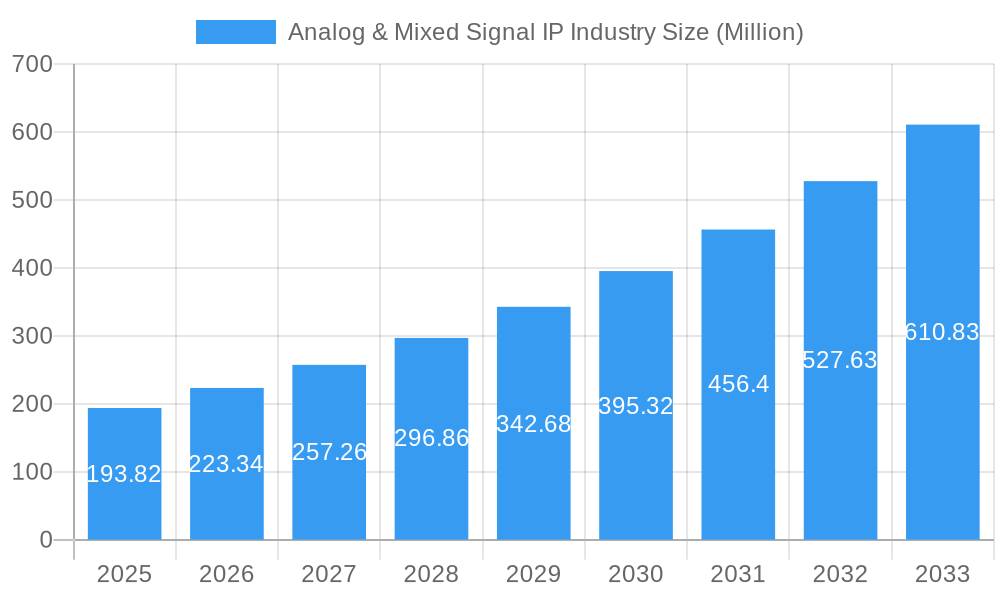
Analog & Mixed Signal IP Industry Market Size (In Million)
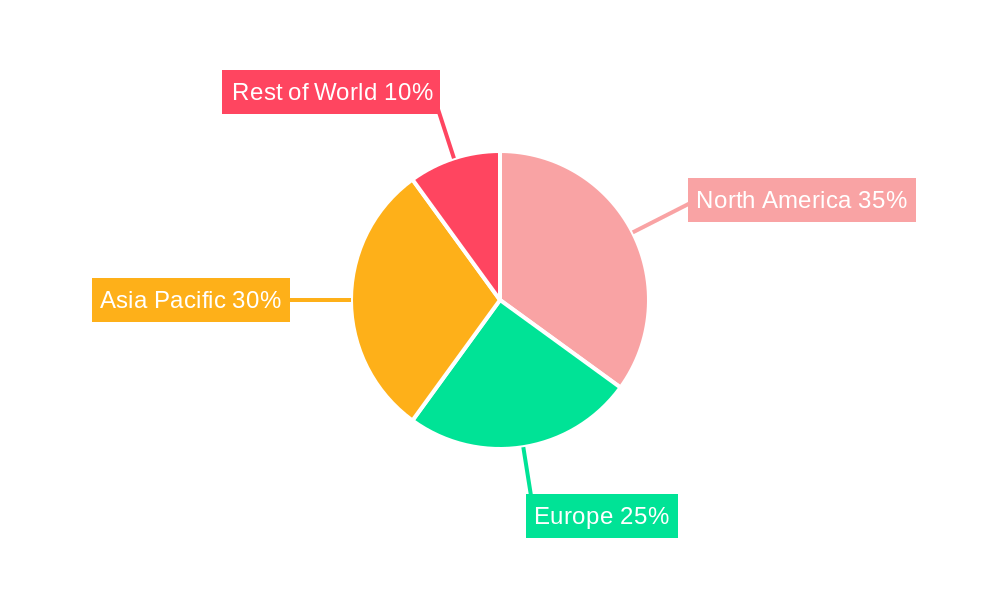
Geographical distribution reveals a significant concentration in North America and Asia Pacific, driven by strong technological advancements and high manufacturing hubs. However, Europe and other regions are also experiencing substantial growth as the adoption of AMS IP technologies expands globally. The forecast period (2025-2033) anticipates continued strong growth, fueled by technological innovation, including advancements in process technology, increased integration of mixed signal components, and the continuous demand for enhanced power efficiency and performance across various applications. The market is expected to witness increased competition, consolidation, and strategic partnerships among key players as they strive to cater to the evolving needs of their customers. The ongoing investment in research and development (R&D) further underpins the positive outlook for the AMS IP market's future growth trajectory.
Analog & Mixed Signal IP Industry Company Market Share
Analog & Mixed Signal IP Industry Market Report: 2019-2033
This comprehensive report provides a detailed analysis of the Analog & Mixed Signal IP industry, offering invaluable insights for businesses, investors, and researchers. Covering the period from 2019 to 2033, with a focus on 2025, this report leverages extensive market research and data analysis to forecast future trends and identify key opportunities within this dynamic sector. The report offers a granular view across various segments, including product types, end-user industries, and design methodologies, providing a 360-degree perspective on the current market landscape and its future trajectory. The report projects a market size of $XX Million in 2025, with a Compound Annual Growth Rate (CAGR) of XX% from 2025 to 2033.
Analog & Mixed Signal IP Industry Market Structure & Competitive Landscape
The Analog & Mixed Signal IP market exhibits a moderately concentrated structure, with several major players holding significant market share. The Herfindahl-Hirschman Index (HHI) for 2024 is estimated at xx, suggesting a moderately competitive landscape. However, the market is characterized by continuous innovation, driving both organic growth and mergers and acquisitions (M&A) activity. Regulatory changes, particularly around data privacy and security in various end-user sectors, significantly impact market dynamics. Product substitution is a factor, particularly with the rise of software-defined solutions. The market is broadly segmented by end-user industry, with significant opportunities in Consumer Electronics, Telecommunication, Automotive, and Industrial sectors. M&A activity has been significant in recent years, with a total deal volume of approximately $XX Million in 2024, primarily driven by consolidation efforts and the acquisition of specialized IP portfolios.
- Key Market Concentration Indicators: HHI (2024) = xx, Top 5 Market Share = xx%
- Innovation Drivers: Advancements in semiconductor technology (e.g., node shrinking), increasing demand for high-performance, low-power devices, development of new communication standards (e.g., 5G, 6G).
- Regulatory Impacts: Compliance with data privacy regulations (GDPR, CCPA), industry-specific safety standards (e.g., automotive), increasing cybersecurity concerns.
- Product Substitutes: Software-defined radios, software-based signal processing solutions.
- End-User Segmentation: Consumer Electronics (xx%), Telecommunication (xx%), Automotive (xx%), Industrial (xx%), Other (xx%).
- M&A Trends: Consolidation among major players, acquisitions of smaller firms with specialized IP.
Analog & Mixed Signal IP Industry Market Trends & Opportunities
The Analog & Mixed Signal IP market is experiencing robust growth, driven by several key trends. The increasing demand for high-bandwidth, low-latency communication in various applications, such as 5G infrastructure and IoT devices, fuels the demand for advanced Analog & Mixed Signal IP. Technological advancements, particularly in process technology, enable the creation of more efficient and powerful solutions. Consumer preference for miniaturization, increased functionality, and improved power efficiency also influence market growth. Intense competition among market leaders drives continuous innovation and competitive pricing. The market demonstrates a significant growth trajectory, with a projected market size of $XX Million in 2025, and an estimated CAGR of XX% during the forecast period (2025-2033). Market penetration rates vary significantly across segments, with the highest penetration observed in established sectors like consumer electronics and a faster growth rate expected in the emerging segments like automotive and industrial automation.
Dominant Markets & Segments in Analog & Mixed Signal IP Industry
The North American region currently holds the largest market share in the Analog & Mixed Signal IP industry, driven by a strong presence of major players and substantial R&D investments. Within product segments, RF components are experiencing the highest growth, fueled by increasing demand in 5G and other wireless communication technologies. The Automotive end-user industry presents substantial opportunities, driven by the increasing adoption of advanced driver-assistance systems (ADAS) and autonomous vehicles. Hard IP dominates the design methodology segment due to its performance advantages and easier integration.
Key Growth Drivers:
- North America: Strong presence of major players, significant R&D investments.
- RF Segment: 5G infrastructure deployment, growth in wireless communication technologies.
- Automotive Segment: Expansion of ADAS and autonomous vehicles.
- Hard IP Segment: Performance advantages, easier integration.
Market Dominance Analysis: The dominance of North America is attributed to its mature technology ecosystem and the presence of leading companies such as Analog Devices and Texas Instruments. The automotive segment's rapid expansion is driven by the ongoing development of self-driving and advanced driver assistance systems.
Analog & Mixed Signal IP Industry Product Analysis
The Analog & Mixed Signal IP market is characterized by continuous innovation, with advancements in A2D and D2A converters offering improved resolution, higher speed, and lower power consumption. Power management modules are becoming increasingly sophisticated, with features such as intelligent power allocation and energy harvesting. RF components are evolving to support higher frequencies and broader bandwidths to meet the demands of 5G and beyond. These advancements are key to meeting the demands of various applications, from high-performance computing to energy-efficient wearable devices. The ability to integrate these components seamlessly into larger systems is a significant competitive advantage.
Key Drivers, Barriers & Challenges in Analog & Mixed Signal IP Industry
Key Drivers: The increasing adoption of 5G, IoT, and AI applications is driving demand for high-performance, low-power analog and mixed-signal components. Advancements in semiconductor fabrication processes enable the creation of smaller, more energy-efficient chips. Government initiatives promoting technological advancements in various sectors also boost market growth. For instance, government funding for R&D in automotive electronics and 5G infrastructure are significant drivers.
Key Challenges: Supply chain disruptions, particularly concerning specialized components and materials, can significantly impact production. Stringent regulatory compliance requirements (e.g., automotive safety standards) impose costs on manufacturers. Intense competition among market leaders leads to price pressure, requiring ongoing innovation to maintain profitability. The projected impact of supply chain issues on the market revenue is estimated at $XX Million annually by 2033.
Growth Drivers in the Analog & Mixed Signal IP Industry Market
Several factors are driving the growth of the Analog & Mixed Signal IP market. These include the increasing demand for high-bandwidth communication in 5G and beyond, the rapid growth of IoT devices requiring advanced signal processing, and the increasing complexity of automotive electronics, especially with the introduction of autonomous driving features. Government regulations and incentives promoting technological advancements further fuel market expansion.
Challenges Impacting Analog & Mixed Signal IP Industry Growth
The Analog & Mixed Signal IP industry faces several challenges including the rising cost of semiconductor manufacturing, the complexity of integrating various components into a single system, and the ever-increasing demand for higher performance and lower power consumption. Stringent regulatory requirements and standards can also create barriers to entry for new players.
Key Players Shaping the Analog & Mixed Signal IP Industry Market
Significant Analog & Mixed Signal IP Industry Industry Milestones
- August 2020: Silicon Creations' SerDes technology deployed in an 8K digital TV SoC by NovatekMicroelectronics Corp. This highlights the growing demand for high-bandwidth solutions in consumer electronics.
- February 2020: Marvell and Analog Devices' collaboration on 5G base station solutions signifies the strategic importance of partnerships in developing next-generation wireless technology. This partnership demonstrates the increasing complexity of 5G infrastructure and the need for collaboration across different areas of expertise.
Future Outlook for Analog & Mixed Signal IP Industry Market
The Analog & Mixed Signal IP market is poised for continued strong growth, driven by the ongoing expansion of 5G networks, the proliferation of IoT devices, and the increasing sophistication of automotive electronics. Strategic investments in R&D and partnerships will be crucial for companies to maintain a competitive edge. The market is expected to see significant growth opportunities particularly in the automotive, industrial, and healthcare sectors. These advancements and strategic initiatives will help propel the Analog & Mixed Signal IP industry toward significant growth in the years ahead.
Analog & Mixed Signal IP Industry Segmentation
-
1. Design
- 1.1. Firm/Soft IP
- 1.2. Hard IP
-
2. Product
- 2.1. A2D and D2A Converter
- 2.2. Power Management Modules
- 2.3. RF
- 2.4. Other Products
-
3. End-user Industry
- 3.1. Consumer Electronics
- 3.2. Telecommunication
- 3.3. Automotive
- 3.4. Industrial
- 3.5. Other End-user Industries
Analog & Mixed Signal IP Industry Segmentation By Geography
- 1. North America
- 2. Europe
- 3. Asia Pacific
- 4. Latin America
- 5. Middle East
Analog & Mixed Signal IP Industry Regional Market Share
Geographic Coverage of Analog & Mixed Signal IP Industry
Analog & Mixed Signal IP Industry REPORT HIGHLIGHTS
| Aspects | Details |
|---|---|
| Study Period | 2020-2034 |
| Base Year | 2025 |
| Estimated Year | 2026 |
| Forecast Period | 2026-2034 |
| Historical Period | 2020-2025 |
| Growth Rate | CAGR of 15.17% from 2020-2034 |
| Segmentation |
|
Table of Contents
- 1. Introduction
- 1.1. Research Scope
- 1.2. Market Segmentation
- 1.3. Research Objective
- 1.4. Definitions and Assumptions
- 2. Executive Summary
- 2.1. Market Snapshot
- 3. Market Dynamics
- 3.1. Market Drivers
- 3.2. Market Restrains
- 3.3. Market Trends
- 3.4. Market Opportunities
- 4. Market Factor Analysis
- 4.1. Porters Five Forces
- 4.1.1. Bargaining Power of Suppliers
- 4.1.2. Bargaining Power of Buyers
- 4.1.3. Threat of New Entrants
- 4.1.4. Threat of Substitutes
- 4.1.5. Competitive Rivalry
- 4.2. PESTEL analysis
- 4.3. BCG Analysis
- 4.3.1. Stars (High Growth, High Market Share)
- 4.3.2. Cash Cows (Low Growth, High Market Share)
- 4.3.3. Question Mark (High Growth, Low Market Share)
- 4.3.4. Dogs (Low Growth, Low Market Share)
- 4.4. Ansoff Matrix Analysis
- 4.5. Supply Chain Analysis
- 4.6. Regulatory Landscape
- 4.7. Current Market Potential and Opportunity Assessment (TAM–SAM–SOM Framework)
- 4.8. TIR Analyst Note
- 4.1. Porters Five Forces
- 5. Market Analysis, Insights and Forecast 2021-2033
- 5.1. Market Analysis, Insights and Forecast - by Design
- 5.1.1. Firm/Soft IP
- 5.1.2. Hard IP
- 5.2. Market Analysis, Insights and Forecast - by Product
- 5.2.1. A2D and D2A Converter
- 5.2.2. Power Management Modules
- 5.2.3. RF
- 5.2.4. Other Products
- 5.3. Market Analysis, Insights and Forecast - by End-user Industry
- 5.3.1. Consumer Electronics
- 5.3.2. Telecommunication
- 5.3.3. Automotive
- 5.3.4. Industrial
- 5.3.5. Other End-user Industries
- 5.4. Market Analysis, Insights and Forecast - by Region
- 5.4.1. North America
- 5.4.2. Europe
- 5.4.3. Asia Pacific
- 5.4.4. Latin America
- 5.4.5. Middle East
- 5.1. Market Analysis, Insights and Forecast - by Design
- 6. Global Analog & Mixed Signal IP Industry Analysis, Insights and Forecast, 2021-2033
- 6.1. Market Analysis, Insights and Forecast - by Design
- 6.1.1. Firm/Soft IP
- 6.1.2. Hard IP
- 6.2. Market Analysis, Insights and Forecast - by Product
- 6.2.1. A2D and D2A Converter
- 6.2.2. Power Management Modules
- 6.2.3. RF
- 6.2.4. Other Products
- 6.3. Market Analysis, Insights and Forecast - by End-user Industry
- 6.3.1. Consumer Electronics
- 6.3.2. Telecommunication
- 6.3.3. Automotive
- 6.3.4. Industrial
- 6.3.5. Other End-user Industries
- 6.1. Market Analysis, Insights and Forecast - by Design
- 7. North America Analog & Mixed Signal IP Industry Analysis, Insights and Forecast, 2020-2032
- 7.1. Market Analysis, Insights and Forecast - by Design
- 7.1.1. Firm/Soft IP
- 7.1.2. Hard IP
- 7.2. Market Analysis, Insights and Forecast - by Product
- 7.2.1. A2D and D2A Converter
- 7.2.2. Power Management Modules
- 7.2.3. RF
- 7.2.4. Other Products
- 7.3. Market Analysis, Insights and Forecast - by End-user Industry
- 7.3.1. Consumer Electronics
- 7.3.2. Telecommunication
- 7.3.3. Automotive
- 7.3.4. Industrial
- 7.3.5. Other End-user Industries
- 7.1. Market Analysis, Insights and Forecast - by Design
- 8. Europe Analog & Mixed Signal IP Industry Analysis, Insights and Forecast, 2020-2032
- 8.1. Market Analysis, Insights and Forecast - by Design
- 8.1.1. Firm/Soft IP
- 8.1.2. Hard IP
- 8.2. Market Analysis, Insights and Forecast - by Product
- 8.2.1. A2D and D2A Converter
- 8.2.2. Power Management Modules
- 8.2.3. RF
- 8.2.4. Other Products
- 8.3. Market Analysis, Insights and Forecast - by End-user Industry
- 8.3.1. Consumer Electronics
- 8.3.2. Telecommunication
- 8.3.3. Automotive
- 8.3.4. Industrial
- 8.3.5. Other End-user Industries
- 8.1. Market Analysis, Insights and Forecast - by Design
- 9. Asia Pacific Analog & Mixed Signal IP Industry Analysis, Insights and Forecast, 2020-2032
- 9.1. Market Analysis, Insights and Forecast - by Design
- 9.1.1. Firm/Soft IP
- 9.1.2. Hard IP
- 9.2. Market Analysis, Insights and Forecast - by Product
- 9.2.1. A2D and D2A Converter
- 9.2.2. Power Management Modules
- 9.2.3. RF
- 9.2.4. Other Products
- 9.3. Market Analysis, Insights and Forecast - by End-user Industry
- 9.3.1. Consumer Electronics
- 9.3.2. Telecommunication
- 9.3.3. Automotive
- 9.3.4. Industrial
- 9.3.5. Other End-user Industries
- 9.1. Market Analysis, Insights and Forecast - by Design
- 10. Latin America Analog & Mixed Signal IP Industry Analysis, Insights and Forecast, 2020-2032
- 10.1. Market Analysis, Insights and Forecast - by Design
- 10.1.1. Firm/Soft IP
- 10.1.2. Hard IP
- 10.2. Market Analysis, Insights and Forecast - by Product
- 10.2.1. A2D and D2A Converter
- 10.2.2. Power Management Modules
- 10.2.3. RF
- 10.2.4. Other Products
- 10.3. Market Analysis, Insights and Forecast - by End-user Industry
- 10.3.1. Consumer Electronics
- 10.3.2. Telecommunication
- 10.3.3. Automotive
- 10.3.4. Industrial
- 10.3.5. Other End-user Industries
- 10.1. Market Analysis, Insights and Forecast - by Design
- 11. Middle East Analog & Mixed Signal IP Industry Analysis, Insights and Forecast, 2020-2032
- 11.1. Market Analysis, Insights and Forecast - by Design
- 11.1.1. Firm/Soft IP
- 11.1.2. Hard IP
- 11.2. Market Analysis, Insights and Forecast - by Product
- 11.2.1. A2D and D2A Converter
- 11.2.2. Power Management Modules
- 11.2.3. RF
- 11.2.4. Other Products
- 11.3. Market Analysis, Insights and Forecast - by End-user Industry
- 11.3.1. Consumer Electronics
- 11.3.2. Telecommunication
- 11.3.3. Automotive
- 11.3.4. Industrial
- 11.3.5. Other End-user Industries
- 11.1. Market Analysis, Insights and Forecast - by Design
- 12. Competitive Analysis
- 12.1. Company Profiles
- 12.1.1 Xilinx Inc
- 12.1.1.1. Company Overview
- 12.1.1.2. Products
- 12.1.1.3. Company Financials
- 12.1.1.4. SWOT Analysis
- 12.1.2 Renesas Electronics Corporation
- 12.1.2.1. Company Overview
- 12.1.2.2. Products
- 12.1.2.3. Company Financials
- 12.1.2.4. SWOT Analysis
- 12.1.3 Silicon Creations LLC
- 12.1.3.1. Company Overview
- 12.1.3.2. Products
- 12.1.3.3. Company Financials
- 12.1.3.4. SWOT Analysis
- 12.1.4 Synopsys Inc
- 12.1.4.1. Company Overview
- 12.1.4.2. Products
- 12.1.4.3. Company Financials
- 12.1.4.4. SWOT Analysis
- 12.1.5 Cadence Design Systems Inc
- 12.1.5.1. Company Overview
- 12.1.5.2. Products
- 12.1.5.3. Company Financials
- 12.1.5.4. SWOT Analysis
- 12.1.6 VeriSilicon Holdings Co Ltd
- 12.1.6.1. Company Overview
- 12.1.6.2. Products
- 12.1.6.3. Company Financials
- 12.1.6.4. SWOT Analysis
- 12.1.7 Analog Devices Inc
- 12.1.7.1. Company Overview
- 12.1.7.2. Products
- 12.1.7.3. Company Financials
- 12.1.7.4. SWOT Analysis
- 12.1.8 Maxim Integrated Products Inc
- 12.1.8.1. Company Overview
- 12.1.8.2. Products
- 12.1.8.3. Company Financials
- 12.1.8.4. SWOT Analysis
- 12.1.9 Texas Instruments Limite
- 12.1.9.1. Company Overview
- 12.1.9.2. Products
- 12.1.9.3. Company Financials
- 12.1.9.4. SWOT Analysis
- 12.1.10 ARM Holdings PLC
- 12.1.10.1. Company Overview
- 12.1.10.2. Products
- 12.1.10.3. Company Financials
- 12.1.10.4. SWOT Analysis
- 12.1.11 Intel Corporation
- 12.1.11.1. Company Overview
- 12.1.11.2. Products
- 12.1.11.3. Company Financials
- 12.1.11.4. SWOT Analysis
- 12.1.1 Xilinx Inc
- 12.2. Market Entropy
- 12.2.1 Company's Key Areas Served
- 12.2.2 Recent Developments
- 12.3. Company Market Share Analysis 2025
- 12.3.1 Top 5 Companies Market Share Analysis
- 12.3.2 Top 3 Companies Market Share Analysis
- 12.4. List of Potential Customers
- 13. Research Methodology
List of Figures
- Figure 1: Global Analog & Mixed Signal IP Industry Revenue Breakdown (Million, %) by Region 2025 & 2033
- Figure 2: North America Analog & Mixed Signal IP Industry Revenue (Million), by Design 2025 & 2033
- Figure 3: North America Analog & Mixed Signal IP Industry Revenue Share (%), by Design 2025 & 2033
- Figure 4: North America Analog & Mixed Signal IP Industry Revenue (Million), by Product 2025 & 2033
- Figure 5: North America Analog & Mixed Signal IP Industry Revenue Share (%), by Product 2025 & 2033
- Figure 6: North America Analog & Mixed Signal IP Industry Revenue (Million), by End-user Industry 2025 & 2033
- Figure 7: North America Analog & Mixed Signal IP Industry Revenue Share (%), by End-user Industry 2025 & 2033
- Figure 8: North America Analog & Mixed Signal IP Industry Revenue (Million), by Country 2025 & 2033
- Figure 9: North America Analog & Mixed Signal IP Industry Revenue Share (%), by Country 2025 & 2033
- Figure 10: Europe Analog & Mixed Signal IP Industry Revenue (Million), by Design 2025 & 2033
- Figure 11: Europe Analog & Mixed Signal IP Industry Revenue Share (%), by Design 2025 & 2033
- Figure 12: Europe Analog & Mixed Signal IP Industry Revenue (Million), by Product 2025 & 2033
- Figure 13: Europe Analog & Mixed Signal IP Industry Revenue Share (%), by Product 2025 & 2033
- Figure 14: Europe Analog & Mixed Signal IP Industry Revenue (Million), by End-user Industry 2025 & 2033
- Figure 15: Europe Analog & Mixed Signal IP Industry Revenue Share (%), by End-user Industry 2025 & 2033
- Figure 16: Europe Analog & Mixed Signal IP Industry Revenue (Million), by Country 2025 & 2033
- Figure 17: Europe Analog & Mixed Signal IP Industry Revenue Share (%), by Country 2025 & 2033
- Figure 18: Asia Pacific Analog & Mixed Signal IP Industry Revenue (Million), by Design 2025 & 2033
- Figure 19: Asia Pacific Analog & Mixed Signal IP Industry Revenue Share (%), by Design 2025 & 2033
- Figure 20: Asia Pacific Analog & Mixed Signal IP Industry Revenue (Million), by Product 2025 & 2033
- Figure 21: Asia Pacific Analog & Mixed Signal IP Industry Revenue Share (%), by Product 2025 & 2033
- Figure 22: Asia Pacific Analog & Mixed Signal IP Industry Revenue (Million), by End-user Industry 2025 & 2033
- Figure 23: Asia Pacific Analog & Mixed Signal IP Industry Revenue Share (%), by End-user Industry 2025 & 2033
- Figure 24: Asia Pacific Analog & Mixed Signal IP Industry Revenue (Million), by Country 2025 & 2033
- Figure 25: Asia Pacific Analog & Mixed Signal IP Industry Revenue Share (%), by Country 2025 & 2033
- Figure 26: Latin America Analog & Mixed Signal IP Industry Revenue (Million), by Design 2025 & 2033
- Figure 27: Latin America Analog & Mixed Signal IP Industry Revenue Share (%), by Design 2025 & 2033
- Figure 28: Latin America Analog & Mixed Signal IP Industry Revenue (Million), by Product 2025 & 2033
- Figure 29: Latin America Analog & Mixed Signal IP Industry Revenue Share (%), by Product 2025 & 2033
- Figure 30: Latin America Analog & Mixed Signal IP Industry Revenue (Million), by End-user Industry 2025 & 2033
- Figure 31: Latin America Analog & Mixed Signal IP Industry Revenue Share (%), by End-user Industry 2025 & 2033
- Figure 32: Latin America Analog & Mixed Signal IP Industry Revenue (Million), by Country 2025 & 2033
- Figure 33: Latin America Analog & Mixed Signal IP Industry Revenue Share (%), by Country 2025 & 2033
- Figure 34: Middle East Analog & Mixed Signal IP Industry Revenue (Million), by Design 2025 & 2033
- Figure 35: Middle East Analog & Mixed Signal IP Industry Revenue Share (%), by Design 2025 & 2033
- Figure 36: Middle East Analog & Mixed Signal IP Industry Revenue (Million), by Product 2025 & 2033
- Figure 37: Middle East Analog & Mixed Signal IP Industry Revenue Share (%), by Product 2025 & 2033
- Figure 38: Middle East Analog & Mixed Signal IP Industry Revenue (Million), by End-user Industry 2025 & 2033
- Figure 39: Middle East Analog & Mixed Signal IP Industry Revenue Share (%), by End-user Industry 2025 & 2033
- Figure 40: Middle East Analog & Mixed Signal IP Industry Revenue (Million), by Country 2025 & 2033
- Figure 41: Middle East Analog & Mixed Signal IP Industry Revenue Share (%), by Country 2025 & 2033
List of Tables
- Table 1: Global Analog & Mixed Signal IP Industry Revenue Million Forecast, by Design 2020 & 2033
- Table 2: Global Analog & Mixed Signal IP Industry Revenue Million Forecast, by Product 2020 & 2033
- Table 3: Global Analog & Mixed Signal IP Industry Revenue Million Forecast, by End-user Industry 2020 & 2033
- Table 4: Global Analog & Mixed Signal IP Industry Revenue Million Forecast, by Region 2020 & 2033
- Table 5: Global Analog & Mixed Signal IP Industry Revenue Million Forecast, by Design 2020 & 2033
- Table 6: Global Analog & Mixed Signal IP Industry Revenue Million Forecast, by Product 2020 & 2033
- Table 7: Global Analog & Mixed Signal IP Industry Revenue Million Forecast, by End-user Industry 2020 & 2033
- Table 8: Global Analog & Mixed Signal IP Industry Revenue Million Forecast, by Country 2020 & 2033
- Table 9: Global Analog & Mixed Signal IP Industry Revenue Million Forecast, by Design 2020 & 2033
- Table 10: Global Analog & Mixed Signal IP Industry Revenue Million Forecast, by Product 2020 & 2033
- Table 11: Global Analog & Mixed Signal IP Industry Revenue Million Forecast, by End-user Industry 2020 & 2033
- Table 12: Global Analog & Mixed Signal IP Industry Revenue Million Forecast, by Country 2020 & 2033
- Table 13: Global Analog & Mixed Signal IP Industry Revenue Million Forecast, by Design 2020 & 2033
- Table 14: Global Analog & Mixed Signal IP Industry Revenue Million Forecast, by Product 2020 & 2033
- Table 15: Global Analog & Mixed Signal IP Industry Revenue Million Forecast, by End-user Industry 2020 & 2033
- Table 16: Global Analog & Mixed Signal IP Industry Revenue Million Forecast, by Country 2020 & 2033
- Table 17: Global Analog & Mixed Signal IP Industry Revenue Million Forecast, by Design 2020 & 2033
- Table 18: Global Analog & Mixed Signal IP Industry Revenue Million Forecast, by Product 2020 & 2033
- Table 19: Global Analog & Mixed Signal IP Industry Revenue Million Forecast, by End-user Industry 2020 & 2033
- Table 20: Global Analog & Mixed Signal IP Industry Revenue Million Forecast, by Country 2020 & 2033
- Table 21: Global Analog & Mixed Signal IP Industry Revenue Million Forecast, by Design 2020 & 2033
- Table 22: Global Analog & Mixed Signal IP Industry Revenue Million Forecast, by Product 2020 & 2033
- Table 23: Global Analog & Mixed Signal IP Industry Revenue Million Forecast, by End-user Industry 2020 & 2033
- Table 24: Global Analog & Mixed Signal IP Industry Revenue Million Forecast, by Country 2020 & 2033
Frequently Asked Questions
1. What is the projected Compound Annual Growth Rate (CAGR) of the Analog & Mixed Signal IP Industry?
The projected CAGR is approximately 15.17%.
2. Which companies are prominent players in the Analog & Mixed Signal IP Industry?
Key companies in the market include Xilinx Inc, Renesas Electronics Corporation, Silicon Creations LLC, Synopsys Inc, Cadence Design Systems Inc, VeriSilicon Holdings Co Ltd, Analog Devices Inc, Maxim Integrated Products Inc, Texas Instruments Limite, ARM Holdings PLC, Intel Corporation.
3. What are the main segments of the Analog & Mixed Signal IP Industry?
The market segments include Design, Product, End-user Industry.
4. Can you provide details about the market size?
The market size is estimated to be USD 193.82 Million as of 2022.
5. What are some drivers contributing to market growth?
Increasing Reusability of AMS Block; Growing Prevalence of Wireless Communications.
6. What are the notable trends driving market growth?
Telecommunication is Expected Hold a Significant Share.
7. Are there any restraints impacting market growth?
Complexity and Sensitivity of Analog/Mixed-Signal (AMS) design.
8. Can you provide examples of recent developments in the market?
August 2020 - The SerDes Technology of Silicon Creations was deployed as a V-by-One HS receiver in an SoC designed by NovatekMicroelectronics Corp. for an 8K digital TV application. The company designed the frame-rate converter SoC on TSMC's 12nm process.
9. What pricing options are available for accessing the report?
Pricing options include single-user, multi-user, and enterprise licenses priced at USD 4750, USD 5250, and USD 8750 respectively.
10. Is the market size provided in terms of value or volume?
The market size is provided in terms of value, measured in Million.
11. Are there any specific market keywords associated with the report?
Yes, the market keyword associated with the report is "Analog & Mixed Signal IP Industry," which aids in identifying and referencing the specific market segment covered.
12. How do I determine which pricing option suits my needs best?
The pricing options vary based on user requirements and access needs. Individual users may opt for single-user licenses, while businesses requiring broader access may choose multi-user or enterprise licenses for cost-effective access to the report.
13. Are there any additional resources or data provided in the Analog & Mixed Signal IP Industry report?
While the report offers comprehensive insights, it's advisable to review the specific contents or supplementary materials provided to ascertain if additional resources or data are available.
14. How can I stay updated on further developments or reports in the Analog & Mixed Signal IP Industry?
To stay informed about further developments, trends, and reports in the Analog & Mixed Signal IP Industry, consider subscribing to industry newsletters, following relevant companies and organizations, or regularly checking reputable industry news sources and publications.
Methodology
Step 1 - Identification of Relevant Samples Size from Population Database


Step 2 - Approaches for Defining Global Market Size (Value, Volume* & Price*)

Note*: In applicable scenarios
Step 3 - Data Sources
Primary Research
- Web Analytics
- Survey Reports
- Research Institute
- Latest Research Reports
- Opinion Leaders
Secondary Research
- Annual Reports
- White Paper
- Latest Press Release
- Industry Association
- Paid Database
- Investor Presentations

Step 4 - Data Triangulation
Involves using different sources of information in order to increase the validity of a study
These sources are likely to be stakeholders in a program - participants, other researchers, program staff, other community members, and so on.
Then we put all data in single framework & apply various statistical tools to find out the dynamic on the market.
During the analysis stage, feedback from the stakeholder groups would be compared to determine areas of agreement as well as areas of divergence