

Key Insights
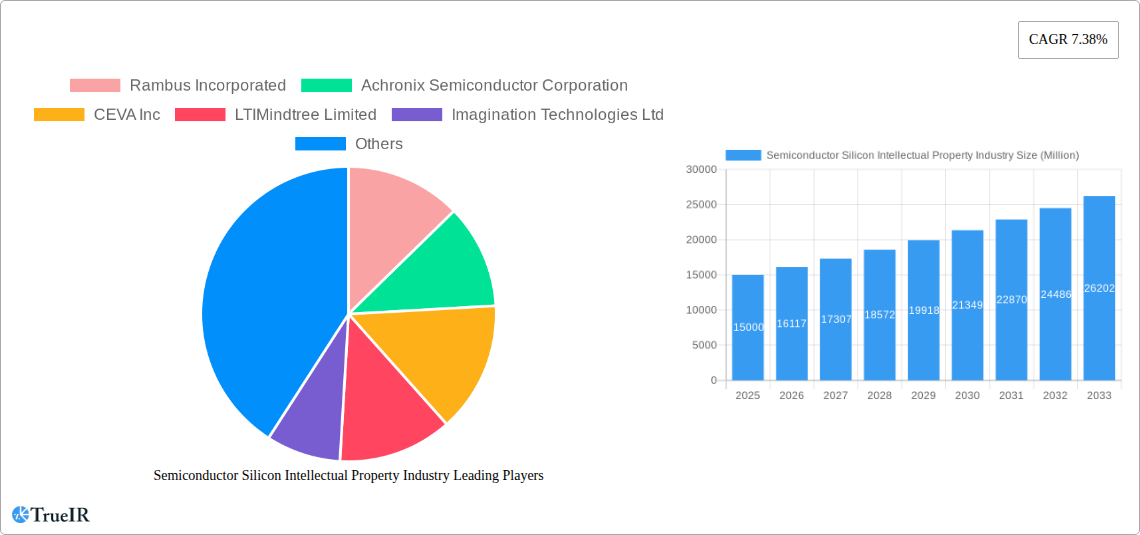
The Semiconductor Silicon Intellectual Property (IP) market is experiencing robust growth, projected to reach a substantial size by 2033. A compound annual growth rate (CAGR) of 7.38% from 2025 to 2033 indicates a significant expansion driven by several key factors. The increasing demand for advanced computing power in diverse sectors like consumer electronics (driven by smartphones, IoT devices, and wearables), automotive (fueling autonomous driving and advanced driver-assistance systems), and industrial automation (powering smart factories and robotics) are primary growth drivers. Furthermore, the trend towards system-on-chip (SoC) designs, enabling greater integration and efficiency, fuels the demand for high-quality, readily available IP cores. While some restraints exist, such as the complexity of IP licensing and integration, and the potential for IP security breaches, these challenges are being addressed by industry innovations and improved security protocols. The market segmentation reveals strong performance across various IP types, including processor IP, wired and wireless interface IP, and others. Licensing remains a dominant revenue stream, though services and royalty models are also gaining traction. Geographically, North America and Asia-Pacific are currently leading the market, with significant growth potential in emerging economies. The competitive landscape is characterized by a mix of established players like ARM, Synopsys, and Cadence, and emerging companies specializing in niche IP segments. This dynamic interplay ensures continuous innovation and a wide range of choices for semiconductor designers.
The forecast for the Semiconductor Silicon Intellectual Property market through 2033 points toward continued expansion, although the rate of growth may moderate slightly as the market matures. The ongoing development of advanced technologies like 5G, AI, and edge computing will continue to drive demand for specialized IP cores. The success of semiconductor companies will increasingly hinge on their ability to efficiently integrate and leverage these IPs to produce cutting-edge, power-efficient, and cost-effective products. Strategic partnerships and acquisitions will likely continue to shape the competitive landscape, leading to further market consolidation. The successful navigation of evolving security protocols and intellectual property rights will be critical to maintain sustainable growth and protect market share. Therefore, market players should prioritize R&D investments, strategic collaborations, and enhanced security measures to capitalize on the promising opportunities within this dynamic market.
Semiconductor Silicon Intellectual Property Industry Report: 2019-2033
This comprehensive report provides a detailed analysis of the Semiconductor Silicon Intellectual Property (IP) industry, offering invaluable insights for stakeholders, investors, and industry professionals. Covering the period from 2019 to 2033, with a focus on 2025, this report leverages rigorous market research to forecast future trends and growth opportunities. The global market is expected to reach xx Million by 2033, exhibiting a CAGR of xx% during the forecast period (2025-2033).
This in-depth study analyzes key market segments, competitive dynamics, and emerging technologies to provide a holistic understanding of this rapidly evolving landscape.
Semiconductor Silicon Intellectual Property Industry Market Structure & Competitive Landscape
The Semiconductor Silicon Intellectual Property (IP) market exhibits a moderately concentrated structure, with a few dominant players and numerous smaller niche players. The Herfindahl-Hirschman Index (HHI) for the market is estimated at xx, indicating a moderately competitive landscape. However, the market is characterized by significant innovation, driven by advancements in AI, 5G, and other emerging technologies.
- Key Players: Synopsys Inc, Cadence Design Systems Inc, ARM Ltd (SoftBank), and others mentioned in the subsequent sections are significant players shaping the market dynamics.
- Innovation Drivers: The demand for higher performance, lower power consumption, and smaller form factor devices fuels constant innovation in semiconductor IP. AI and machine learning are playing a crucial role in accelerating the design process and improving chip efficiency.
- Regulatory Impacts: Government policies and regulations related to data privacy, cybersecurity, and intellectual property rights influence market dynamics. Stringent regulations can increase development costs and complexity, while supportive policies can stimulate growth.
- Product Substitutes: While direct substitutes are limited, the market faces indirect competition from alternative design methodologies and open-source IP solutions. The emergence of open-source IP could potentially disrupt the market in the long term.
- End-User Segmentation: The industry caters to diverse end-user verticals, including consumer electronics, computers and peripherals, automobiles, and industrial applications. Growth is driven by the increasing demand for advanced semiconductor technologies across these sectors.
- M&A Trends: The Semiconductor Silicon IP market has witnessed several mergers and acquisitions (M&As) in recent years, primarily driven by the need to expand product portfolios and gain market share. The volume of M&A deals in the last five years is estimated at xx deals, with a total value of xx Million. This reflects the consolidating nature of the industry.
Semiconductor Silicon Intellectual Property Industry Market Trends & Opportunities
The Semiconductor Silicon IP market is experiencing robust growth fueled by several key trends. The market size was valued at xx Million in 2024 and is projected to reach xx Million by 2033, driven primarily by increasing demand for sophisticated electronic devices across multiple end-user verticals. The market displays notable growth in emerging markets, particularly in Asia. Technological advancements like AI, IoT, and 5G are catalyzing innovation and creating new opportunities. Consumer preference for feature-rich, energy-efficient devices is further stimulating demand for advanced semiconductor IP solutions. The rising adoption of cloud computing and edge computing also fuels market expansion. Intense competition among major players drives innovation and competitive pricing. The market penetration rate of semiconductor IP in several end-user applications is still relatively low, presenting significant untapped potential for growth.

Dominant Markets & Segments in Semiconductor Silicon Intellectual Property Industry
- By Revenue Type: The License segment currently holds the largest market share, contributing to approximately xx Million in revenue. This is followed by Royalty and Services. The projected growth of the Services segment is particularly high owing to the increasing demand for customized and optimized solutions.
- By IP Type: Processor IP dominates the market with a revenue share of approximately xx%, driven by growing demand for advanced computing capabilities in diverse applications. The Wired and Wireless Interface IP segment shows a strong CAGR, fueled by the expanding adoption of 5G technology and connected devices.
- By End-user Vertical: Consumer Electronics accounts for the largest market segment, primarily due to the high volume production of smartphones, wearables, and other consumer gadgets. The Automotive segment presents a significant growth opportunity due to the burgeoning adoption of advanced driver-assistance systems (ADAS) and autonomous vehicles.
Key Growth Drivers:
- Rapid technological advancements: The continuous evolution of AI, IoT, 5G, and other technologies drives the demand for advanced semiconductor IP solutions.
- Infrastructure development: Investments in 5G infrastructure and data centers are spurring market expansion.
- Government support: Government initiatives and policies promoting technological innovation and semiconductor manufacturing further fuel market growth.
Semiconductor Silicon Intellectual Property Industry Product Analysis
The Semiconductor Silicon IP market offers a diverse range of products, including processor IP cores, memory controllers, wired and wireless interface IPs, and other specialized IPs tailored to specific applications. Key features include high performance, low power consumption, advanced security features, and ease of integration. The competitive advantage is primarily determined by performance, power efficiency, security features, and the availability of comprehensive software and support. Recent technological advancements include the integration of AI and machine learning capabilities into IP cores, enabling more efficient and intelligent chip designs.
Key Drivers, Barriers & Challenges in Semiconductor Silicon Intellectual Property Industry
Key Drivers:
- Technological advancements: The continuous development of AI, 5G, and other technologies fuels demand for sophisticated semiconductor IP.
- Economic growth: Increasing global economic activity and expanding consumer electronics market drive market expansion.
- Government regulations: supportive policies promoting semiconductor manufacturing are enhancing growth.
Key Challenges and Restraints:
- Supply chain disruptions: Geopolitical factors and global events can impact the availability of critical components.
- Regulatory hurdles: Complex regulations related to intellectual property rights and data security can slow down innovation.
- Intense competition: Competition among major players limits profit margins. Estimated loss due to competition in 2024 is xx Million.
Growth Drivers in the Semiconductor Silicon Intellectual Property Industry Market
The Semiconductor Silicon IP market is propelled by advancements in AI, 5G, and IoT technologies. The rising demand for high-performance computing and advanced automotive systems also fuels substantial growth. Government incentives and investments in semiconductor manufacturing further bolster market expansion.
Challenges Impacting Semiconductor Silicon Intellectual Property Industry Growth
Major challenges include supply chain vulnerabilities, geopolitical uncertainty, and intense competition. Regulatory hurdles and the high cost of research and development also pose significant barriers to entry. Maintaining intellectual property rights and dealing with cybersecurity threats are also crucial challenges.
Key Players Shaping the Semiconductor Silicon Intellectual Property Industry Market
- Rambus Incorporated
- Achronix Semiconductor Corporation
- CEVA Inc
- LTIMindtree Limited
- Imagination Technologies Ltd
- Fujitsu Ltd
- Andes Technology Corporation
- Faraday Technology Corporation
- MIPS Tech LLC
- Digital Media Professionals
- Synopsys Inc
- Cadence Design Systems Inc
- eMemory Technology Inc
- MediaTek Inc
- VeriSilicon Holdings Co Ltd
- ARM Ltd (SoftBank)
Significant Semiconductor Silicon Intellectual Property Industry Industry Milestones
- May 2023: CEVA Inc. acquired RealSpace 3D Spatial Audio technology from VisiSonicsCorporation, strengthening its position in the wearables market.
- March 2023: Synopsys launched the Synopsys.ai suite, revolutionizing chip design with AI-powered tools, significantly reducing development time and costs.
Future Outlook for Semiconductor Silicon Intellectual Property Industry Market
The Semiconductor Silicon IP market is poised for continued robust growth, driven by technological advancements and expanding applications across various industries. Strategic partnerships, investments in R&D, and the development of innovative IP solutions will play a vital role in shaping the future of this dynamic market. The increasing demand for high-performance, low-power, and secure semiconductor chips will continue to drive market expansion.
Semiconductor Silicon Intellectual Property Industry Segmentation
-
1. Revenue Type
- 1.1. License
- 1.2. Royalty
- 1.3. Services
-
2. IP Type
- 2.1. Processor IP
- 2.2. Wired and Wireless Interface IP
- 2.3. Other IP Types
-
3. End-user Vertical
- 3.1. Consumer Electronics
- 3.2. Computers and Peripherals
- 3.3. Automobile
- 3.4. Industrial
- 3.5. Other End-user Verticals
Semiconductor Silicon Intellectual Property Industry Segmentation By Geography
-
1. North America
- 1.1. United States
- 1.2. Canada
-
2. Europe
- 2.1. United Kingdom
- 2.2. Germany
- 2.3. France
-
3. Asia
- 3.1. China
- 3.2. Taiwan
- 3.3. Japan
- 3.4. South Korea
- 3.5. India
- 3.6. Australia and New Zealand
- 4. Latin America
- 5. Middle East and Africa

Semiconductor Silicon Intellectual Property Industry REPORT HIGHLIGHTS
| Aspects | Details |
|---|---|
| Study Period | 2019-2033 |
| Base Year | 2024 |
| Estimated Year | 2025 |
| Forecast Period | 2025-2033 |
| Historical Period | 2019-2024 |
| Growth Rate | CAGR of 7.38% from 2019-2033 |
| Segmentation |
|
Table of Contents
- 1. Introduction
- 1.1. Research Scope
- 1.2. Market Segmentation
- 1.3. Research Methodology
- 1.4. Definitions and Assumptions
- 2. Executive Summary
- 2.1. Introduction
- 3. Market Dynamics
- 3.1. Introduction
- 3.2. Market Drivers
- 3.2.1. Growing Demand for Connected Devices; Growing Demand for Modern SoC Designs
- 3.3. Market Restrains
- 3.3.1. IP Business Model and Economies of Scale
- 3.4. Market Trends
- 3.4.1. Consumer Electronics to be the Largest End-user Vertical
- 4. Market Factor Analysis
- 4.1. Porters Five Forces
- 4.2. Supply/Value Chain
- 4.3. PESTEL analysis
- 4.4. Market Entropy
- 4.5. Patent/Trademark Analysis
- 5. Global Semiconductor Silicon Intellectual Property Industry Analysis, Insights and Forecast, 2019-2031
- 5.1. Market Analysis, Insights and Forecast - by Revenue Type
- 5.1.1. License
- 5.1.2. Royalty
- 5.1.3. Services
- 5.2. Market Analysis, Insights and Forecast - by IP Type
- 5.2.1. Processor IP
- 5.2.2. Wired and Wireless Interface IP
- 5.2.3. Other IP Types
- 5.3. Market Analysis, Insights and Forecast - by End-user Vertical
- 5.3.1. Consumer Electronics
- 5.3.2. Computers and Peripherals
- 5.3.3. Automobile
- 5.3.4. Industrial
- 5.3.5. Other End-user Verticals
- 5.4. Market Analysis, Insights and Forecast - by Region
- 5.4.1. North America
- 5.4.2. Europe
- 5.4.3. Asia
- 5.4.4. Latin America
- 5.4.5. Middle East and Africa
- 5.1. Market Analysis, Insights and Forecast - by Revenue Type
- 6. North America Semiconductor Silicon Intellectual Property Industry Analysis, Insights and Forecast, 2019-2031
- 6.1. Market Analysis, Insights and Forecast - by Revenue Type
- 6.1.1. License
- 6.1.2. Royalty
- 6.1.3. Services
- 6.2. Market Analysis, Insights and Forecast - by IP Type
- 6.2.1. Processor IP
- 6.2.2. Wired and Wireless Interface IP
- 6.2.3. Other IP Types
- 6.3. Market Analysis, Insights and Forecast - by End-user Vertical
- 6.3.1. Consumer Electronics
- 6.3.2. Computers and Peripherals
- 6.3.3. Automobile
- 6.3.4. Industrial
- 6.3.5. Other End-user Verticals
- 6.1. Market Analysis, Insights and Forecast - by Revenue Type
- 7. Europe Semiconductor Silicon Intellectual Property Industry Analysis, Insights and Forecast, 2019-2031
- 7.1. Market Analysis, Insights and Forecast - by Revenue Type
- 7.1.1. License
- 7.1.2. Royalty
- 7.1.3. Services
- 7.2. Market Analysis, Insights and Forecast - by IP Type
- 7.2.1. Processor IP
- 7.2.2. Wired and Wireless Interface IP
- 7.2.3. Other IP Types
- 7.3. Market Analysis, Insights and Forecast - by End-user Vertical
- 7.3.1. Consumer Electronics
- 7.3.2. Computers and Peripherals
- 7.3.3. Automobile
- 7.3.4. Industrial
- 7.3.5. Other End-user Verticals
- 7.1. Market Analysis, Insights and Forecast - by Revenue Type
- 8. Asia Semiconductor Silicon Intellectual Property Industry Analysis, Insights and Forecast, 2019-2031
- 8.1. Market Analysis, Insights and Forecast - by Revenue Type
- 8.1.1. License
- 8.1.2. Royalty
- 8.1.3. Services
- 8.2. Market Analysis, Insights and Forecast - by IP Type
- 8.2.1. Processor IP
- 8.2.2. Wired and Wireless Interface IP
- 8.2.3. Other IP Types
- 8.3. Market Analysis, Insights and Forecast - by End-user Vertical
- 8.3.1. Consumer Electronics
- 8.3.2. Computers and Peripherals
- 8.3.3. Automobile
- 8.3.4. Industrial
- 8.3.5. Other End-user Verticals
- 8.1. Market Analysis, Insights and Forecast - by Revenue Type
- 9. Latin America Semiconductor Silicon Intellectual Property Industry Analysis, Insights and Forecast, 2019-2031
- 9.1. Market Analysis, Insights and Forecast - by Revenue Type
- 9.1.1. License
- 9.1.2. Royalty
- 9.1.3. Services
- 9.2. Market Analysis, Insights and Forecast - by IP Type
- 9.2.1. Processor IP
- 9.2.2. Wired and Wireless Interface IP
- 9.2.3. Other IP Types
- 9.3. Market Analysis, Insights and Forecast - by End-user Vertical
- 9.3.1. Consumer Electronics
- 9.3.2. Computers and Peripherals
- 9.3.3. Automobile
- 9.3.4. Industrial
- 9.3.5. Other End-user Verticals
- 9.1. Market Analysis, Insights and Forecast - by Revenue Type
- 10. Middle East and Africa Semiconductor Silicon Intellectual Property Industry Analysis, Insights and Forecast, 2019-2031
- 10.1. Market Analysis, Insights and Forecast - by Revenue Type
- 10.1.1. License
- 10.1.2. Royalty
- 10.1.3. Services
- 10.2. Market Analysis, Insights and Forecast - by IP Type
- 10.2.1. Processor IP
- 10.2.2. Wired and Wireless Interface IP
- 10.2.3. Other IP Types
- 10.3. Market Analysis, Insights and Forecast - by End-user Vertical
- 10.3.1. Consumer Electronics
- 10.3.2. Computers and Peripherals
- 10.3.3. Automobile
- 10.3.4. Industrial
- 10.3.5. Other End-user Verticals
- 10.1. Market Analysis, Insights and Forecast - by Revenue Type
- 11. North America Semiconductor Silicon Intellectual Property Industry Analysis, Insights and Forecast, 2019-2031
- 11.1. Market Analysis, Insights and Forecast - By Country/Sub-region
- 11.1.1 United States
- 11.1.2 Canada
- 11.1.3 Mexico
- 12. Europe Semiconductor Silicon Intellectual Property Industry Analysis, Insights and Forecast, 2019-2031
- 12.1. Market Analysis, Insights and Forecast - By Country/Sub-region
- 12.1.1 Germany
- 12.1.2 United Kingdom
- 12.1.3 France
- 12.1.4 Spain
- 12.1.5 Italy
- 12.1.6 Spain
- 12.1.7 Belgium
- 12.1.8 Netherland
- 12.1.9 Nordics
- 12.1.10 Rest of Europe
- 13. Asia Pacific Semiconductor Silicon Intellectual Property Industry Analysis, Insights and Forecast, 2019-2031
- 13.1. Market Analysis, Insights and Forecast - By Country/Sub-region
- 13.1.1 China
- 13.1.2 Japan
- 13.1.3 India
- 13.1.4 South Korea
- 13.1.5 Southeast Asia
- 13.1.6 Australia
- 13.1.7 Indonesia
- 13.1.8 Phillipes
- 13.1.9 Singapore
- 13.1.10 Thailandc
- 13.1.11 Rest of Asia Pacific
- 14. South America Semiconductor Silicon Intellectual Property Industry Analysis, Insights and Forecast, 2019-2031
- 14.1. Market Analysis, Insights and Forecast - By Country/Sub-region
- 14.1.1 Brazil
- 14.1.2 Argentina
- 14.1.3 Peru
- 14.1.4 Chile
- 14.1.5 Colombia
- 14.1.6 Ecuador
- 14.1.7 Venezuela
- 14.1.8 Rest of South America
- 15. North America Semiconductor Silicon Intellectual Property Industry Analysis, Insights and Forecast, 2019-2031
- 15.1. Market Analysis, Insights and Forecast - By Country/Sub-region
- 15.1.1 United States
- 15.1.2 Canada
- 15.1.3 Mexico
- 16. MEA Semiconductor Silicon Intellectual Property Industry Analysis, Insights and Forecast, 2019-2031
- 16.1. Market Analysis, Insights and Forecast - By Country/Sub-region
- 16.1.1 United Arab Emirates
- 16.1.2 Saudi Arabia
- 16.1.3 South Africa
- 16.1.4 Rest of Middle East and Africa
- 17. Competitive Analysis
- 17.1. Global Market Share Analysis 2024
- 17.2. Company Profiles
- 17.2.1 Rambus Incorporated
- 17.2.1.1. Overview
- 17.2.1.2. Products
- 17.2.1.3. SWOT Analysis
- 17.2.1.4. Recent Developments
- 17.2.1.5. Financials (Based on Availability)
- 17.2.2 Achronix Semiconductor Corporation
- 17.2.2.1. Overview
- 17.2.2.2. Products
- 17.2.2.3. SWOT Analysis
- 17.2.2.4. Recent Developments
- 17.2.2.5. Financials (Based on Availability)
- 17.2.3 CEVA Inc
- 17.2.3.1. Overview
- 17.2.3.2. Products
- 17.2.3.3. SWOT Analysis
- 17.2.3.4. Recent Developments
- 17.2.3.5. Financials (Based on Availability)
- 17.2.4 LTIMindtree Limited
- 17.2.4.1. Overview
- 17.2.4.2. Products
- 17.2.4.3. SWOT Analysis
- 17.2.4.4. Recent Developments
- 17.2.4.5. Financials (Based on Availability)
- 17.2.5 Imagination Technologies Ltd
- 17.2.5.1. Overview
- 17.2.5.2. Products
- 17.2.5.3. SWOT Analysis
- 17.2.5.4. Recent Developments
- 17.2.5.5. Financials (Based on Availability)
- 17.2.6 Fujitsu Ltd
- 17.2.6.1. Overview
- 17.2.6.2. Products
- 17.2.6.3. SWOT Analysis
- 17.2.6.4. Recent Developments
- 17.2.6.5. Financials (Based on Availability)
- 17.2.7 Andes Technology Corporation
- 17.2.7.1. Overview
- 17.2.7.2. Products
- 17.2.7.3. SWOT Analysis
- 17.2.7.4. Recent Developments
- 17.2.7.5. Financials (Based on Availability)
- 17.2.8 Faraday Technology Corporation
- 17.2.8.1. Overview
- 17.2.8.2. Products
- 17.2.8.3. SWOT Analysis
- 17.2.8.4. Recent Developments
- 17.2.8.5. Financials (Based on Availability)
- 17.2.9 MIPS Tech LLC
- 17.2.9.1. Overview
- 17.2.9.2. Products
- 17.2.9.3. SWOT Analysis
- 17.2.9.4. Recent Developments
- 17.2.9.5. Financials (Based on Availability)
- 17.2.10 Digital Media Professionals
- 17.2.10.1. Overview
- 17.2.10.2. Products
- 17.2.10.3. SWOT Analysis
- 17.2.10.4. Recent Developments
- 17.2.10.5. Financials (Based on Availability)
- 17.2.11 Synopsys Inc
- 17.2.11.1. Overview
- 17.2.11.2. Products
- 17.2.11.3. SWOT Analysis
- 17.2.11.4. Recent Developments
- 17.2.11.5. Financials (Based on Availability)
- 17.2.12 Cadence Design Systems Inc
- 17.2.12.1. Overview
- 17.2.12.2. Products
- 17.2.12.3. SWOT Analysis
- 17.2.12.4. Recent Developments
- 17.2.12.5. Financials (Based on Availability)
- 17.2.13 eMemory Technology Inc
- 17.2.13.1. Overview
- 17.2.13.2. Products
- 17.2.13.3. SWOT Analysis
- 17.2.13.4. Recent Developments
- 17.2.13.5. Financials (Based on Availability)
- 17.2.14 MediaTek Inc
- 17.2.14.1. Overview
- 17.2.14.2. Products
- 17.2.14.3. SWOT Analysis
- 17.2.14.4. Recent Developments
- 17.2.14.5. Financials (Based on Availability)
- 17.2.15 VeriSilicon Holdings Co Ltd
- 17.2.15.1. Overview
- 17.2.15.2. Products
- 17.2.15.3. SWOT Analysis
- 17.2.15.4. Recent Developments
- 17.2.15.5. Financials (Based on Availability)
- 17.2.16 ARM Ltd (SoftBank )
- 17.2.16.1. Overview
- 17.2.16.2. Products
- 17.2.16.3. SWOT Analysis
- 17.2.16.4. Recent Developments
- 17.2.16.5. Financials (Based on Availability)
- 17.2.1 Rambus Incorporated
List of Figures
- Figure 1: Global Semiconductor Silicon Intellectual Property Industry Revenue Breakdown (Million, %) by Region 2024 & 2032
- Figure 2: North America Semiconductor Silicon Intellectual Property Industry Revenue (Million), by Country 2024 & 2032
- Figure 3: North America Semiconductor Silicon Intellectual Property Industry Revenue Share (%), by Country 2024 & 2032
- Figure 4: Europe Semiconductor Silicon Intellectual Property Industry Revenue (Million), by Country 2024 & 2032
- Figure 5: Europe Semiconductor Silicon Intellectual Property Industry Revenue Share (%), by Country 2024 & 2032
- Figure 6: Asia Pacific Semiconductor Silicon Intellectual Property Industry Revenue (Million), by Country 2024 & 2032
- Figure 7: Asia Pacific Semiconductor Silicon Intellectual Property Industry Revenue Share (%), by Country 2024 & 2032
- Figure 8: South America Semiconductor Silicon Intellectual Property Industry Revenue (Million), by Country 2024 & 2032
- Figure 9: South America Semiconductor Silicon Intellectual Property Industry Revenue Share (%), by Country 2024 & 2032
- Figure 10: North America Semiconductor Silicon Intellectual Property Industry Revenue (Million), by Country 2024 & 2032
- Figure 11: North America Semiconductor Silicon Intellectual Property Industry Revenue Share (%), by Country 2024 & 2032
- Figure 12: MEA Semiconductor Silicon Intellectual Property Industry Revenue (Million), by Country 2024 & 2032
- Figure 13: MEA Semiconductor Silicon Intellectual Property Industry Revenue Share (%), by Country 2024 & 2032
- Figure 14: North America Semiconductor Silicon Intellectual Property Industry Revenue (Million), by Revenue Type 2024 & 2032
- Figure 15: North America Semiconductor Silicon Intellectual Property Industry Revenue Share (%), by Revenue Type 2024 & 2032
- Figure 16: North America Semiconductor Silicon Intellectual Property Industry Revenue (Million), by IP Type 2024 & 2032
- Figure 17: North America Semiconductor Silicon Intellectual Property Industry Revenue Share (%), by IP Type 2024 & 2032
- Figure 18: North America Semiconductor Silicon Intellectual Property Industry Revenue (Million), by End-user Vertical 2024 & 2032
- Figure 19: North America Semiconductor Silicon Intellectual Property Industry Revenue Share (%), by End-user Vertical 2024 & 2032
- Figure 20: North America Semiconductor Silicon Intellectual Property Industry Revenue (Million), by Country 2024 & 2032
- Figure 21: North America Semiconductor Silicon Intellectual Property Industry Revenue Share (%), by Country 2024 & 2032
- Figure 22: Europe Semiconductor Silicon Intellectual Property Industry Revenue (Million), by Revenue Type 2024 & 2032
- Figure 23: Europe Semiconductor Silicon Intellectual Property Industry Revenue Share (%), by Revenue Type 2024 & 2032
- Figure 24: Europe Semiconductor Silicon Intellectual Property Industry Revenue (Million), by IP Type 2024 & 2032
- Figure 25: Europe Semiconductor Silicon Intellectual Property Industry Revenue Share (%), by IP Type 2024 & 2032
- Figure 26: Europe Semiconductor Silicon Intellectual Property Industry Revenue (Million), by End-user Vertical 2024 & 2032
- Figure 27: Europe Semiconductor Silicon Intellectual Property Industry Revenue Share (%), by End-user Vertical 2024 & 2032
- Figure 28: Europe Semiconductor Silicon Intellectual Property Industry Revenue (Million), by Country 2024 & 2032
- Figure 29: Europe Semiconductor Silicon Intellectual Property Industry Revenue Share (%), by Country 2024 & 2032
- Figure 30: Asia Semiconductor Silicon Intellectual Property Industry Revenue (Million), by Revenue Type 2024 & 2032
- Figure 31: Asia Semiconductor Silicon Intellectual Property Industry Revenue Share (%), by Revenue Type 2024 & 2032
- Figure 32: Asia Semiconductor Silicon Intellectual Property Industry Revenue (Million), by IP Type 2024 & 2032
- Figure 33: Asia Semiconductor Silicon Intellectual Property Industry Revenue Share (%), by IP Type 2024 & 2032
- Figure 34: Asia Semiconductor Silicon Intellectual Property Industry Revenue (Million), by End-user Vertical 2024 & 2032
- Figure 35: Asia Semiconductor Silicon Intellectual Property Industry Revenue Share (%), by End-user Vertical 2024 & 2032
- Figure 36: Asia Semiconductor Silicon Intellectual Property Industry Revenue (Million), by Country 2024 & 2032
- Figure 37: Asia Semiconductor Silicon Intellectual Property Industry Revenue Share (%), by Country 2024 & 2032
- Figure 38: Latin America Semiconductor Silicon Intellectual Property Industry Revenue (Million), by Revenue Type 2024 & 2032
- Figure 39: Latin America Semiconductor Silicon Intellectual Property Industry Revenue Share (%), by Revenue Type 2024 & 2032
- Figure 40: Latin America Semiconductor Silicon Intellectual Property Industry Revenue (Million), by IP Type 2024 & 2032
- Figure 41: Latin America Semiconductor Silicon Intellectual Property Industry Revenue Share (%), by IP Type 2024 & 2032
- Figure 42: Latin America Semiconductor Silicon Intellectual Property Industry Revenue (Million), by End-user Vertical 2024 & 2032
- Figure 43: Latin America Semiconductor Silicon Intellectual Property Industry Revenue Share (%), by End-user Vertical 2024 & 2032
- Figure 44: Latin America Semiconductor Silicon Intellectual Property Industry Revenue (Million), by Country 2024 & 2032
- Figure 45: Latin America Semiconductor Silicon Intellectual Property Industry Revenue Share (%), by Country 2024 & 2032
- Figure 46: Middle East and Africa Semiconductor Silicon Intellectual Property Industry Revenue (Million), by Revenue Type 2024 & 2032
- Figure 47: Middle East and Africa Semiconductor Silicon Intellectual Property Industry Revenue Share (%), by Revenue Type 2024 & 2032
- Figure 48: Middle East and Africa Semiconductor Silicon Intellectual Property Industry Revenue (Million), by IP Type 2024 & 2032
- Figure 49: Middle East and Africa Semiconductor Silicon Intellectual Property Industry Revenue Share (%), by IP Type 2024 & 2032
- Figure 50: Middle East and Africa Semiconductor Silicon Intellectual Property Industry Revenue (Million), by End-user Vertical 2024 & 2032
- Figure 51: Middle East and Africa Semiconductor Silicon Intellectual Property Industry Revenue Share (%), by End-user Vertical 2024 & 2032
- Figure 52: Middle East and Africa Semiconductor Silicon Intellectual Property Industry Revenue (Million), by Country 2024 & 2032
- Figure 53: Middle East and Africa Semiconductor Silicon Intellectual Property Industry Revenue Share (%), by Country 2024 & 2032
List of Tables
- Table 1: Global Semiconductor Silicon Intellectual Property Industry Revenue Million Forecast, by Region 2019 & 2032
- Table 2: Global Semiconductor Silicon Intellectual Property Industry Revenue Million Forecast, by Revenue Type 2019 & 2032
- Table 3: Global Semiconductor Silicon Intellectual Property Industry Revenue Million Forecast, by IP Type 2019 & 2032
- Table 4: Global Semiconductor Silicon Intellectual Property Industry Revenue Million Forecast, by End-user Vertical 2019 & 2032
- Table 5: Global Semiconductor Silicon Intellectual Property Industry Revenue Million Forecast, by Region 2019 & 2032
- Table 6: Global Semiconductor Silicon Intellectual Property Industry Revenue Million Forecast, by Country 2019 & 2032
- Table 7: United States Semiconductor Silicon Intellectual Property Industry Revenue (Million) Forecast, by Application 2019 & 2032
- Table 8: Canada Semiconductor Silicon Intellectual Property Industry Revenue (Million) Forecast, by Application 2019 & 2032
- Table 9: Mexico Semiconductor Silicon Intellectual Property Industry Revenue (Million) Forecast, by Application 2019 & 2032
- Table 10: Global Semiconductor Silicon Intellectual Property Industry Revenue Million Forecast, by Country 2019 & 2032
- Table 11: Germany Semiconductor Silicon Intellectual Property Industry Revenue (Million) Forecast, by Application 2019 & 2032
- Table 12: United Kingdom Semiconductor Silicon Intellectual Property Industry Revenue (Million) Forecast, by Application 2019 & 2032
- Table 13: France Semiconductor Silicon Intellectual Property Industry Revenue (Million) Forecast, by Application 2019 & 2032
- Table 14: Spain Semiconductor Silicon Intellectual Property Industry Revenue (Million) Forecast, by Application 2019 & 2032
- Table 15: Italy Semiconductor Silicon Intellectual Property Industry Revenue (Million) Forecast, by Application 2019 & 2032
- Table 16: Spain Semiconductor Silicon Intellectual Property Industry Revenue (Million) Forecast, by Application 2019 & 2032
- Table 17: Belgium Semiconductor Silicon Intellectual Property Industry Revenue (Million) Forecast, by Application 2019 & 2032
- Table 18: Netherland Semiconductor Silicon Intellectual Property Industry Revenue (Million) Forecast, by Application 2019 & 2032
- Table 19: Nordics Semiconductor Silicon Intellectual Property Industry Revenue (Million) Forecast, by Application 2019 & 2032
- Table 20: Rest of Europe Semiconductor Silicon Intellectual Property Industry Revenue (Million) Forecast, by Application 2019 & 2032
- Table 21: Global Semiconductor Silicon Intellectual Property Industry Revenue Million Forecast, by Country 2019 & 2032
- Table 22: China Semiconductor Silicon Intellectual Property Industry Revenue (Million) Forecast, by Application 2019 & 2032
- Table 23: Japan Semiconductor Silicon Intellectual Property Industry Revenue (Million) Forecast, by Application 2019 & 2032
- Table 24: India Semiconductor Silicon Intellectual Property Industry Revenue (Million) Forecast, by Application 2019 & 2032
- Table 25: South Korea Semiconductor Silicon Intellectual Property Industry Revenue (Million) Forecast, by Application 2019 & 2032
- Table 26: Southeast Asia Semiconductor Silicon Intellectual Property Industry Revenue (Million) Forecast, by Application 2019 & 2032
- Table 27: Australia Semiconductor Silicon Intellectual Property Industry Revenue (Million) Forecast, by Application 2019 & 2032
- Table 28: Indonesia Semiconductor Silicon Intellectual Property Industry Revenue (Million) Forecast, by Application 2019 & 2032
- Table 29: Phillipes Semiconductor Silicon Intellectual Property Industry Revenue (Million) Forecast, by Application 2019 & 2032
- Table 30: Singapore Semiconductor Silicon Intellectual Property Industry Revenue (Million) Forecast, by Application 2019 & 2032
- Table 31: Thailandc Semiconductor Silicon Intellectual Property Industry Revenue (Million) Forecast, by Application 2019 & 2032
- Table 32: Rest of Asia Pacific Semiconductor Silicon Intellectual Property Industry Revenue (Million) Forecast, by Application 2019 & 2032
- Table 33: Global Semiconductor Silicon Intellectual Property Industry Revenue Million Forecast, by Country 2019 & 2032
- Table 34: Brazil Semiconductor Silicon Intellectual Property Industry Revenue (Million) Forecast, by Application 2019 & 2032
- Table 35: Argentina Semiconductor Silicon Intellectual Property Industry Revenue (Million) Forecast, by Application 2019 & 2032
- Table 36: Peru Semiconductor Silicon Intellectual Property Industry Revenue (Million) Forecast, by Application 2019 & 2032
- Table 37: Chile Semiconductor Silicon Intellectual Property Industry Revenue (Million) Forecast, by Application 2019 & 2032
- Table 38: Colombia Semiconductor Silicon Intellectual Property Industry Revenue (Million) Forecast, by Application 2019 & 2032
- Table 39: Ecuador Semiconductor Silicon Intellectual Property Industry Revenue (Million) Forecast, by Application 2019 & 2032
- Table 40: Venezuela Semiconductor Silicon Intellectual Property Industry Revenue (Million) Forecast, by Application 2019 & 2032
- Table 41: Rest of South America Semiconductor Silicon Intellectual Property Industry Revenue (Million) Forecast, by Application 2019 & 2032
- Table 42: Global Semiconductor Silicon Intellectual Property Industry Revenue Million Forecast, by Country 2019 & 2032
- Table 43: United States Semiconductor Silicon Intellectual Property Industry Revenue (Million) Forecast, by Application 2019 & 2032
- Table 44: Canada Semiconductor Silicon Intellectual Property Industry Revenue (Million) Forecast, by Application 2019 & 2032
- Table 45: Mexico Semiconductor Silicon Intellectual Property Industry Revenue (Million) Forecast, by Application 2019 & 2032
- Table 46: Global Semiconductor Silicon Intellectual Property Industry Revenue Million Forecast, by Country 2019 & 2032
- Table 47: United Arab Emirates Semiconductor Silicon Intellectual Property Industry Revenue (Million) Forecast, by Application 2019 & 2032
- Table 48: Saudi Arabia Semiconductor Silicon Intellectual Property Industry Revenue (Million) Forecast, by Application 2019 & 2032
- Table 49: South Africa Semiconductor Silicon Intellectual Property Industry Revenue (Million) Forecast, by Application 2019 & 2032
- Table 50: Rest of Middle East and Africa Semiconductor Silicon Intellectual Property Industry Revenue (Million) Forecast, by Application 2019 & 2032
- Table 51: Global Semiconductor Silicon Intellectual Property Industry Revenue Million Forecast, by Revenue Type 2019 & 2032
- Table 52: Global Semiconductor Silicon Intellectual Property Industry Revenue Million Forecast, by IP Type 2019 & 2032
- Table 53: Global Semiconductor Silicon Intellectual Property Industry Revenue Million Forecast, by End-user Vertical 2019 & 2032
- Table 54: Global Semiconductor Silicon Intellectual Property Industry Revenue Million Forecast, by Country 2019 & 2032
- Table 55: United States Semiconductor Silicon Intellectual Property Industry Revenue (Million) Forecast, by Application 2019 & 2032
- Table 56: Canada Semiconductor Silicon Intellectual Property Industry Revenue (Million) Forecast, by Application 2019 & 2032
- Table 57: Global Semiconductor Silicon Intellectual Property Industry Revenue Million Forecast, by Revenue Type 2019 & 2032
- Table 58: Global Semiconductor Silicon Intellectual Property Industry Revenue Million Forecast, by IP Type 2019 & 2032
- Table 59: Global Semiconductor Silicon Intellectual Property Industry Revenue Million Forecast, by End-user Vertical 2019 & 2032
- Table 60: Global Semiconductor Silicon Intellectual Property Industry Revenue Million Forecast, by Country 2019 & 2032
- Table 61: United Kingdom Semiconductor Silicon Intellectual Property Industry Revenue (Million) Forecast, by Application 2019 & 2032
- Table 62: Germany Semiconductor Silicon Intellectual Property Industry Revenue (Million) Forecast, by Application 2019 & 2032
- Table 63: France Semiconductor Silicon Intellectual Property Industry Revenue (Million) Forecast, by Application 2019 & 2032
- Table 64: Global Semiconductor Silicon Intellectual Property Industry Revenue Million Forecast, by Revenue Type 2019 & 2032
- Table 65: Global Semiconductor Silicon Intellectual Property Industry Revenue Million Forecast, by IP Type 2019 & 2032
- Table 66: Global Semiconductor Silicon Intellectual Property Industry Revenue Million Forecast, by End-user Vertical 2019 & 2032
- Table 67: Global Semiconductor Silicon Intellectual Property Industry Revenue Million Forecast, by Country 2019 & 2032
- Table 68: China Semiconductor Silicon Intellectual Property Industry Revenue (Million) Forecast, by Application 2019 & 2032
- Table 69: Taiwan Semiconductor Silicon Intellectual Property Industry Revenue (Million) Forecast, by Application 2019 & 2032
- Table 70: Japan Semiconductor Silicon Intellectual Property Industry Revenue (Million) Forecast, by Application 2019 & 2032
- Table 71: South Korea Semiconductor Silicon Intellectual Property Industry Revenue (Million) Forecast, by Application 2019 & 2032
- Table 72: India Semiconductor Silicon Intellectual Property Industry Revenue (Million) Forecast, by Application 2019 & 2032
- Table 73: Australia and New Zealand Semiconductor Silicon Intellectual Property Industry Revenue (Million) Forecast, by Application 2019 & 2032
- Table 74: Global Semiconductor Silicon Intellectual Property Industry Revenue Million Forecast, by Revenue Type 2019 & 2032
- Table 75: Global Semiconductor Silicon Intellectual Property Industry Revenue Million Forecast, by IP Type 2019 & 2032
- Table 76: Global Semiconductor Silicon Intellectual Property Industry Revenue Million Forecast, by End-user Vertical 2019 & 2032
- Table 77: Global Semiconductor Silicon Intellectual Property Industry Revenue Million Forecast, by Country 2019 & 2032
- Table 78: Global Semiconductor Silicon Intellectual Property Industry Revenue Million Forecast, by Revenue Type 2019 & 2032
- Table 79: Global Semiconductor Silicon Intellectual Property Industry Revenue Million Forecast, by IP Type 2019 & 2032
- Table 80: Global Semiconductor Silicon Intellectual Property Industry Revenue Million Forecast, by End-user Vertical 2019 & 2032
- Table 81: Global Semiconductor Silicon Intellectual Property Industry Revenue Million Forecast, by Country 2019 & 2032
Frequently Asked Questions
1. What is the projected Compound Annual Growth Rate (CAGR) of the Semiconductor Silicon Intellectual Property Industry?
The projected CAGR is approximately 7.38%.
2. Which companies are prominent players in the Semiconductor Silicon Intellectual Property Industry?
Key companies in the market include Rambus Incorporated, Achronix Semiconductor Corporation, CEVA Inc, LTIMindtree Limited, Imagination Technologies Ltd, Fujitsu Ltd, Andes Technology Corporation, Faraday Technology Corporation, MIPS Tech LLC, Digital Media Professionals, Synopsys Inc, Cadence Design Systems Inc, eMemory Technology Inc, MediaTek Inc, VeriSilicon Holdings Co Ltd, ARM Ltd (SoftBank ).
3. What are the main segments of the Semiconductor Silicon Intellectual Property Industry?
The market segments include Revenue Type, IP Type, End-user Vertical.
4. Can you provide details about the market size?
The market size is estimated to be USD XX Million as of 2022.
5. What are some drivers contributing to market growth?
Growing Demand for Connected Devices; Growing Demand for Modern SoC Designs.
6. What are the notable trends driving market growth?
Consumer Electronics to be the Largest End-user Vertical.
7. Are there any restraints impacting market growth?
IP Business Model and Economies of Scale.
8. Can you provide examples of recent developments in the market?
May 2023: CEVA Inc. announced the acquisition of the RealSpace 3D Spatial Audio business, technology, and patents from VisiSonicsCorporation. Based in Maryland, close to CEVA's sensor fusion R&D development center, the VisiSonicsspatial audio R&D team and software expand the Company's application software portfolio for embedded systems, bolstering CEVA's strong market position in wearables, where spatial audio is fast becoming a must-have component.
9. What pricing options are available for accessing the report?
Pricing options include single-user, multi-user, and enterprise licenses priced at USD 4750, USD 5250, and USD 8750 respectively.
10. Is the market size provided in terms of value or volume?
The market size is provided in terms of value, measured in Million.
11. Are there any specific market keywords associated with the report?
Yes, the market keyword associated with the report is "Semiconductor Silicon Intellectual Property Industry," which aids in identifying and referencing the specific market segment covered.
12. How do I determine which pricing option suits my needs best?
The pricing options vary based on user requirements and access needs. Individual users may opt for single-user licenses, while businesses requiring broader access may choose multi-user or enterprise licenses for cost-effective access to the report.
13. Are there any additional resources or data provided in the Semiconductor Silicon Intellectual Property Industry report?
While the report offers comprehensive insights, it's advisable to review the specific contents or supplementary materials provided to ascertain if additional resources or data are available.
14. How can I stay updated on further developments or reports in the Semiconductor Silicon Intellectual Property Industry?
To stay informed about further developments, trends, and reports in the Semiconductor Silicon Intellectual Property Industry, consider subscribing to industry newsletters, following relevant companies and organizations, or regularly checking reputable industry news sources and publications.
Methodology
Step 1 - Identification of Relevant Samples Size from Population Database


Step 2 - Approaches for Defining Global Market Size (Value, Volume* & Price*)

Note*: In applicable scenarios
Step 3 - Data Sources
Primary Research
- Web Analytics
- Survey Reports
- Research Institute
- Latest Research Reports
- Opinion Leaders
Secondary Research
- Annual Reports
- White Paper
- Latest Press Release
- Industry Association
- Paid Database
- Investor Presentations

Step 4 - Data Triangulation
Involves using different sources of information in order to increase the validity of a study
These sources are likely to be stakeholders in a program - participants, other researchers, program staff, other community members, and so on.
Then we put all data in single framework & apply various statistical tools to find out the dynamic on the market.
During the analysis stage, feedback from the stakeholder groups would be compared to determine areas of agreement as well as areas of divergence
