

Key Insights
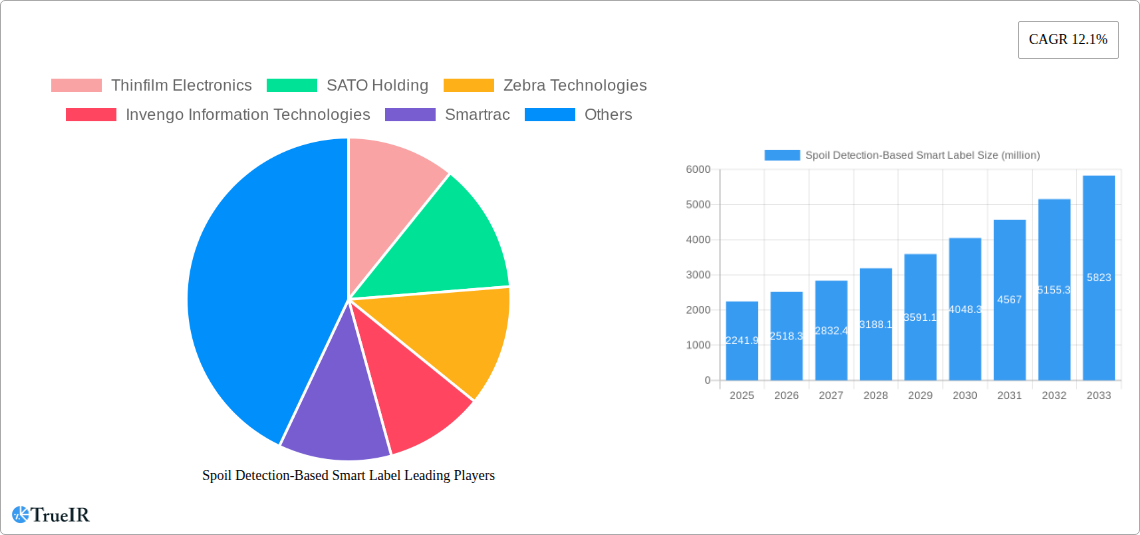
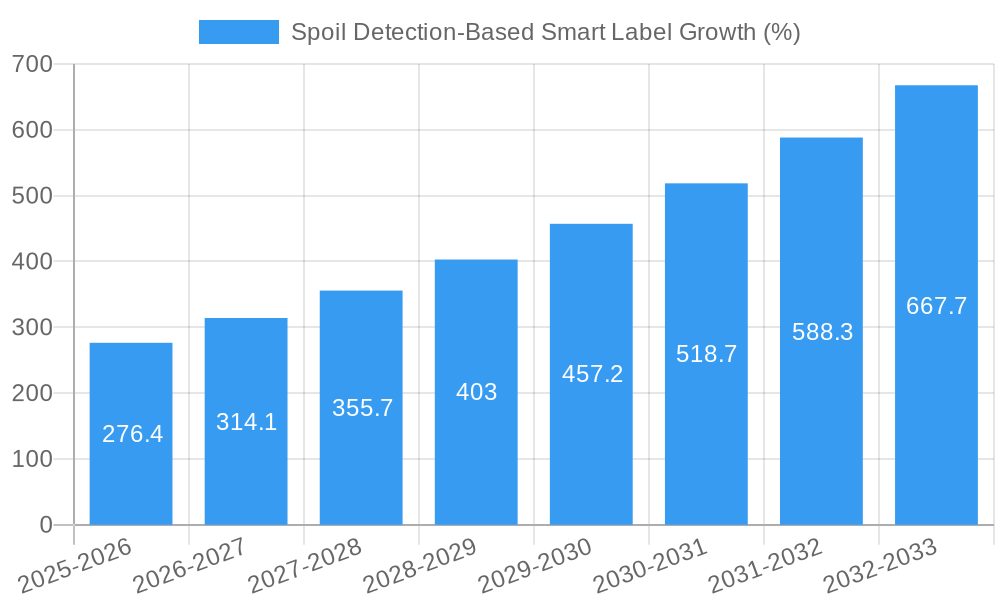
The global market for spoil detection-based smart labels is experiencing robust growth, projected to reach $2241.9 million in 2025 and exhibiting a Compound Annual Growth Rate (CAGR) of 12.1% from 2025 to 2033. This expansion is driven by several key factors. Increasing consumer demand for fresh and high-quality food products fuels the adoption of these labels, providing real-time information on product freshness and reducing food waste. Furthermore, stringent government regulations regarding food safety and traceability are incentivizing the use of smart labels across the supply chain. Technological advancements, including the development of more sophisticated sensor technologies and improved data analytics capabilities, are also contributing to market growth. The competitive landscape is characterized by a mix of established players like Thinfilm Electronics, SATO Holding, Zebra Technologies, Invengo Information Technologies, and Smartrac, alongside emerging companies innovating in this space. The market is segmented based on label type (e.g., time-temperature indicators, gas indicators), application (e.g., fresh produce, meat, dairy), and technology (e.g., RFID, NFC). The market's growth is expected to be strongest in regions with increasing consumer awareness of food waste and robust food retail infrastructure.
Market restraints primarily include the relatively higher initial cost of implementing smart label technology compared to traditional labeling methods. However, the long-term cost savings associated with reduced waste and improved supply chain efficiency are expected to offset this initial investment. Future growth will be significantly influenced by the continued adoption of these technologies in developing economies, advancements in sensor technology leading to improved accuracy and reliability, and the development of integrated solutions that combine smart labels with other supply chain management tools. Further research into environmentally friendly materials for label construction will also play a crucial role in shaping market growth and sustainability.
Spoil Detection-Based Smart Label Market Report: A Comprehensive Analysis (2019-2033)
This dynamic report provides a comprehensive analysis of the global Spoil Detection-Based Smart Label market, projecting a market valuation exceeding $XX million by 2033. The study covers the period 2019-2033, with a base year of 2025 and a forecast period of 2025-2033. Key players such as Thinfilm Electronics, SATO Holding, Zebra Technologies, Invengo Information Technologies, and Smartrac are analyzed, offering critical insights for investors, industry professionals, and strategic decision-makers. This report leverages high-volume keywords to enhance search visibility and provide actionable intelligence on this rapidly growing market segment.
Spoil Detection-Based Smart Label Market Structure & Competitive Landscape
The Spoil Detection-Based Smart Label market exhibits a moderately concentrated structure, with a Herfindahl-Hirschman Index (HHI) estimated at xx in 2025. Key players account for approximately xx% of the total market share, indicating opportunities for both established players and emerging innovators. The market is driven by technological advancements in sensor technology, increasing consumer demand for food safety and quality, and stringent regulatory requirements regarding food traceability. Product substitutes, such as traditional labeling methods, are gradually losing market share due to the superior performance and data-driven capabilities of smart labels.
- Market Concentration: HHI of xx in 2025, indicating moderate concentration.
- Innovation Drivers: Miniaturization of sensors, improved data analytics, and integration with IoT platforms.
- Regulatory Impacts: Stringent food safety regulations and traceability mandates driving adoption.
- Product Substitutes: Traditional labels face declining market share due to limited functionality.
- End-User Segmentation: Primarily focused on the food and beverage industry, with expansion into pharmaceuticals and other sectors.
- M&A Trends: A modest number of mergers and acquisitions (estimated at xx deals) occurred between 2019 and 2024, primarily focused on enhancing technological capabilities and market reach. This trend is expected to increase in the coming years.
Spoil Detection-Based Smart Label Market Trends & Opportunities
The global Spoil Detection-Based Smart Label market is experiencing robust growth, with a projected Compound Annual Growth Rate (CAGR) of xx% during the forecast period (2025-2033). Market size is estimated at $XX million in 2025 and is projected to reach $XX million by 2033. This growth is fueled by several key trends including increasing consumer awareness of food safety, the rising adoption of smart packaging technologies across various industries, and the decreasing cost of sensor technology. The market penetration rate for smart labels in the food and beverage sector is currently at approximately xx%, with significant potential for future expansion. Competitive dynamics are characterized by innovation in sensor technology, improvements in data analytics, and efforts to integrate smart labels with existing supply chain management systems. Changing consumer preferences toward convenience, transparency, and sustainability also contribute to market growth.
Dominant Markets & Segments in Spoil Detection-Based Smart Label
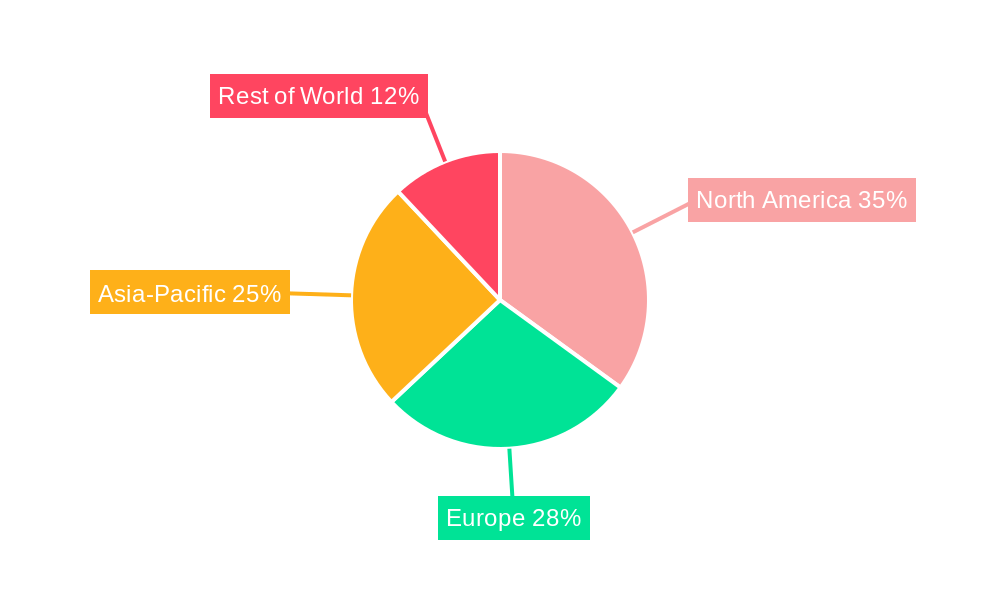
The North American region currently holds the dominant position in the Spoil Detection-Based Smart Label market, accounting for approximately xx% of the global market share in 2025. This dominance is attributed to several factors:
- Advanced Infrastructure: Well-developed infrastructure supporting technological advancements and widespread adoption of smart technologies.
- Stringent Regulations: Strict food safety regulations incentivize the adoption of smart labels.
- High Consumer Awareness: High levels of consumer awareness of food safety and traceability issues.
- Early Adoption of Technology: Early adoption of new technologies in various sectors drives market growth.
The European market is anticipated to witness significant growth during the forecast period, driven by increasing regulatory compliance requirements and rising consumer demand for food quality and safety. Other regions are gradually adopting smart label technologies, albeit at slower paces, resulting in substantial future potential for overall market expansion.
Spoil Detection-Based Smart Label Product Analysis
Spoil detection-based smart labels leverage advancements in sensor technology, such as time-temperature indicators (TTIs) and electrochemical sensors, to monitor product freshness and quality. These labels offer a cost-effective and convenient method for tracking food products throughout their supply chain, ensuring product safety and reducing waste. The integration of these labels with IoT platforms enables real-time monitoring and data analysis, improving efficiency and supply chain transparency. Product innovation focuses on miniaturization, longer shelf-life, and enhanced sensor accuracy. The competitive advantage lies in the accuracy of the sensor, ease of integration with existing systems, and the ability to provide actionable insights to consumers and businesses.
Key Drivers, Barriers & Challenges in Spoil Detection-Based Smart Label
Key Drivers: Technological advancements in sensor technology, increasing demand for food safety and quality, stringent regulations regarding food traceability, and rising consumer awareness are driving significant growth in the market.
Challenges: High initial investment costs, integration challenges with existing supply chain infrastructure, and potential concerns about data security and privacy present significant barriers to market expansion. The lack of standardization and interoperability across different smart label technologies can limit wider adoption. Supply chain disruptions, particularly concerning sensor components, pose a further challenge.
Growth Drivers in the Spoil Detection-Based Smart Label Market
The market is propelled by the increasing demand for food safety and security, particularly concerning reducing food waste and enhancing supply chain transparency. Stringent government regulations related to food traceability and labeling requirements are also key drivers. Technological advancements in sensor technology, miniaturization, and the integration of smart labels with IoT platforms further stimulate market expansion.
Challenges Impacting Spoil Detection-Based Smart Label Growth
High initial investment costs associated with the implementation of smart label technologies can deter smaller businesses and hinder widespread adoption. Supply chain complexities and potential disruptions in the supply of critical sensor components can impact production and negatively affect market growth. The need for standardized protocols and interoperability between different technologies remains a significant challenge.
Key Players Shaping the Spoil Detection-Based Smart Label Market
- Thinfilm Electronics
- SATO Holding
- Zebra Technologies
- Invengo Information Technologies
- Smartrac
Significant Spoil Detection-Based Smart Label Industry Milestones
- 2020: Introduction of a new generation of low-cost, high-accuracy sensors.
- 2021: Partnership between a major food retailer and a smart label provider to implement a large-scale pilot program.
- 2022: Launch of a new software platform facilitating data integration and analysis from smart labels.
- 2023: Several new regulations mandating smart labels for certain food products enacted across different regions.
Future Outlook for Spoil Detection-Based Smart Label Market
The Spoil Detection-Based Smart Label market exhibits significant growth potential, driven by continuing advancements in sensor technology, increasing consumer demand for transparency and safety, and supportive regulatory frameworks. The market is poised for considerable expansion, with promising opportunities for innovation and strategic partnerships. The integration of smart labels with blockchain technology offers further possibilities for enhancing food traceability and reducing counterfeiting.
Spoil Detection-Based Smart Label Segmentation
-
1. Application
- 1.1. Food & Beverage
- 1.2. Healthcare Industries
- 1.3. Other
-
2. Types
- 2.1. Fish
- 2.2. Meat
- 2.3. Vegetables
- 2.4. Dairy Products
- 2.5. Other
Spoil Detection-Based Smart Label Segmentation By Geography
-
1. North America
- 1.1. United States
- 1.2. Canada
- 1.3. Mexico
-
2. South America
- 2.1. Brazil
- 2.2. Argentina
- 2.3. Rest of South America
-
3. Europe
- 3.1. United Kingdom
- 3.2. Germany
- 3.3. France
- 3.4. Italy
- 3.5. Spain
- 3.6. Russia
- 3.7. Benelux
- 3.8. Nordics
- 3.9. Rest of Europe
-
4. Middle East & Africa
- 4.1. Turkey
- 4.2. Israel
- 4.3. GCC
- 4.4. North Africa
- 4.5. South Africa
- 4.6. Rest of Middle East & Africa
-
5. Asia Pacific
- 5.1. China
- 5.2. India
- 5.3. Japan
- 5.4. South Korea
- 5.5. ASEAN
- 5.6. Oceania
- 5.7. Rest of Asia Pacific
Spoil Detection-Based Smart Label REPORT HIGHLIGHTS
| Aspects | Details |
|---|---|
| Study Period | 2019-2033 |
| Base Year | 2024 |
| Estimated Year | 2025 |
| Forecast Period | 2025-2033 |
| Historical Period | 2019-2024 |
| Growth Rate | CAGR of 12.1% from 2019-2033 |
| Segmentation |
|
Table of Contents
- 1. Introduction
- 1.1. Research Scope
- 1.2. Market Segmentation
- 1.3. Research Methodology
- 1.4. Definitions and Assumptions
- 2. Executive Summary
- 2.1. Introduction
- 3. Market Dynamics
- 3.1. Introduction
- 3.2. Market Drivers
- 3.3. Market Restrains
- 3.4. Market Trends
- 4. Market Factor Analysis
- 4.1. Porters Five Forces
- 4.2. Supply/Value Chain
- 4.3. PESTEL analysis
- 4.4. Market Entropy
- 4.5. Patent/Trademark Analysis
- 5. Global Spoil Detection-Based Smart Label Analysis, Insights and Forecast, 2019-2031
- 5.1. Market Analysis, Insights and Forecast - by Application
- 5.1.1. Food & Beverage
- 5.1.2. Healthcare Industries
- 5.1.3. Other
- 5.2. Market Analysis, Insights and Forecast - by Types
- 5.2.1. Fish
- 5.2.2. Meat
- 5.2.3. Vegetables
- 5.2.4. Dairy Products
- 5.2.5. Other
- 5.3. Market Analysis, Insights and Forecast - by Region
- 5.3.1. North America
- 5.3.2. South America
- 5.3.3. Europe
- 5.3.4. Middle East & Africa
- 5.3.5. Asia Pacific
- 5.1. Market Analysis, Insights and Forecast - by Application
- 6. North America Spoil Detection-Based Smart Label Analysis, Insights and Forecast, 2019-2031
- 6.1. Market Analysis, Insights and Forecast - by Application
- 6.1.1. Food & Beverage
- 6.1.2. Healthcare Industries
- 6.1.3. Other
- 6.2. Market Analysis, Insights and Forecast - by Types
- 6.2.1. Fish
- 6.2.2. Meat
- 6.2.3. Vegetables
- 6.2.4. Dairy Products
- 6.2.5. Other
- 6.1. Market Analysis, Insights and Forecast - by Application
- 7. South America Spoil Detection-Based Smart Label Analysis, Insights and Forecast, 2019-2031
- 7.1. Market Analysis, Insights and Forecast - by Application
- 7.1.1. Food & Beverage
- 7.1.2. Healthcare Industries
- 7.1.3. Other
- 7.2. Market Analysis, Insights and Forecast - by Types
- 7.2.1. Fish
- 7.2.2. Meat
- 7.2.3. Vegetables
- 7.2.4. Dairy Products
- 7.2.5. Other
- 7.1. Market Analysis, Insights and Forecast - by Application
- 8. Europe Spoil Detection-Based Smart Label Analysis, Insights and Forecast, 2019-2031
- 8.1. Market Analysis, Insights and Forecast - by Application
- 8.1.1. Food & Beverage
- 8.1.2. Healthcare Industries
- 8.1.3. Other
- 8.2. Market Analysis, Insights and Forecast - by Types
- 8.2.1. Fish
- 8.2.2. Meat
- 8.2.3. Vegetables
- 8.2.4. Dairy Products
- 8.2.5. Other
- 8.1. Market Analysis, Insights and Forecast - by Application
- 9. Middle East & Africa Spoil Detection-Based Smart Label Analysis, Insights and Forecast, 2019-2031
- 9.1. Market Analysis, Insights and Forecast - by Application
- 9.1.1. Food & Beverage
- 9.1.2. Healthcare Industries
- 9.1.3. Other
- 9.2. Market Analysis, Insights and Forecast - by Types
- 9.2.1. Fish
- 9.2.2. Meat
- 9.2.3. Vegetables
- 9.2.4. Dairy Products
- 9.2.5. Other
- 9.1. Market Analysis, Insights and Forecast - by Application
- 10. Asia Pacific Spoil Detection-Based Smart Label Analysis, Insights and Forecast, 2019-2031
- 10.1. Market Analysis, Insights and Forecast - by Application
- 10.1.1. Food & Beverage
- 10.1.2. Healthcare Industries
- 10.1.3. Other
- 10.2. Market Analysis, Insights and Forecast - by Types
- 10.2.1. Fish
- 10.2.2. Meat
- 10.2.3. Vegetables
- 10.2.4. Dairy Products
- 10.2.5. Other
- 10.1. Market Analysis, Insights and Forecast - by Application
- 11. Competitive Analysis
- 11.1. Global Market Share Analysis 2024
- 11.2. Company Profiles
- 11.2.1 Thinfilm Electronics
- 11.2.1.1. Overview
- 11.2.1.2. Products
- 11.2.1.3. SWOT Analysis
- 11.2.1.4. Recent Developments
- 11.2.1.5. Financials (Based on Availability)
- 11.2.2 SATO Holding
- 11.2.2.1. Overview
- 11.2.2.2. Products
- 11.2.2.3. SWOT Analysis
- 11.2.2.4. Recent Developments
- 11.2.2.5. Financials (Based on Availability)
- 11.2.3 Zebra Technologies
- 11.2.3.1. Overview
- 11.2.3.2. Products
- 11.2.3.3. SWOT Analysis
- 11.2.3.4. Recent Developments
- 11.2.3.5. Financials (Based on Availability)
- 11.2.4 Invengo Information Technologies
- 11.2.4.1. Overview
- 11.2.4.2. Products
- 11.2.4.3. SWOT Analysis
- 11.2.4.4. Recent Developments
- 11.2.4.5. Financials (Based on Availability)
- 11.2.5 Smartrac
- 11.2.5.1. Overview
- 11.2.5.2. Products
- 11.2.5.3. SWOT Analysis
- 11.2.5.4. Recent Developments
- 11.2.5.5. Financials (Based on Availability)
- 11.2.1 Thinfilm Electronics
List of Figures
- Figure 1: Global Spoil Detection-Based Smart Label Revenue Breakdown (million, %) by Region 2024 & 2032
- Figure 2: North America Spoil Detection-Based Smart Label Revenue (million), by Application 2024 & 2032
- Figure 3: North America Spoil Detection-Based Smart Label Revenue Share (%), by Application 2024 & 2032
- Figure 4: North America Spoil Detection-Based Smart Label Revenue (million), by Types 2024 & 2032
- Figure 5: North America Spoil Detection-Based Smart Label Revenue Share (%), by Types 2024 & 2032
- Figure 6: North America Spoil Detection-Based Smart Label Revenue (million), by Country 2024 & 2032
- Figure 7: North America Spoil Detection-Based Smart Label Revenue Share (%), by Country 2024 & 2032
- Figure 8: South America Spoil Detection-Based Smart Label Revenue (million), by Application 2024 & 2032
- Figure 9: South America Spoil Detection-Based Smart Label Revenue Share (%), by Application 2024 & 2032
- Figure 10: South America Spoil Detection-Based Smart Label Revenue (million), by Types 2024 & 2032
- Figure 11: South America Spoil Detection-Based Smart Label Revenue Share (%), by Types 2024 & 2032
- Figure 12: South America Spoil Detection-Based Smart Label Revenue (million), by Country 2024 & 2032
- Figure 13: South America Spoil Detection-Based Smart Label Revenue Share (%), by Country 2024 & 2032
- Figure 14: Europe Spoil Detection-Based Smart Label Revenue (million), by Application 2024 & 2032
- Figure 15: Europe Spoil Detection-Based Smart Label Revenue Share (%), by Application 2024 & 2032
- Figure 16: Europe Spoil Detection-Based Smart Label Revenue (million), by Types 2024 & 2032
- Figure 17: Europe Spoil Detection-Based Smart Label Revenue Share (%), by Types 2024 & 2032
- Figure 18: Europe Spoil Detection-Based Smart Label Revenue (million), by Country 2024 & 2032
- Figure 19: Europe Spoil Detection-Based Smart Label Revenue Share (%), by Country 2024 & 2032
- Figure 20: Middle East & Africa Spoil Detection-Based Smart Label Revenue (million), by Application 2024 & 2032
- Figure 21: Middle East & Africa Spoil Detection-Based Smart Label Revenue Share (%), by Application 2024 & 2032
- Figure 22: Middle East & Africa Spoil Detection-Based Smart Label Revenue (million), by Types 2024 & 2032
- Figure 23: Middle East & Africa Spoil Detection-Based Smart Label Revenue Share (%), by Types 2024 & 2032
- Figure 24: Middle East & Africa Spoil Detection-Based Smart Label Revenue (million), by Country 2024 & 2032
- Figure 25: Middle East & Africa Spoil Detection-Based Smart Label Revenue Share (%), by Country 2024 & 2032
- Figure 26: Asia Pacific Spoil Detection-Based Smart Label Revenue (million), by Application 2024 & 2032
- Figure 27: Asia Pacific Spoil Detection-Based Smart Label Revenue Share (%), by Application 2024 & 2032
- Figure 28: Asia Pacific Spoil Detection-Based Smart Label Revenue (million), by Types 2024 & 2032
- Figure 29: Asia Pacific Spoil Detection-Based Smart Label Revenue Share (%), by Types 2024 & 2032
- Figure 30: Asia Pacific Spoil Detection-Based Smart Label Revenue (million), by Country 2024 & 2032
- Figure 31: Asia Pacific Spoil Detection-Based Smart Label Revenue Share (%), by Country 2024 & 2032
List of Tables
- Table 1: Global Spoil Detection-Based Smart Label Revenue million Forecast, by Region 2019 & 2032
- Table 2: Global Spoil Detection-Based Smart Label Revenue million Forecast, by Application 2019 & 2032
- Table 3: Global Spoil Detection-Based Smart Label Revenue million Forecast, by Types 2019 & 2032
- Table 4: Global Spoil Detection-Based Smart Label Revenue million Forecast, by Region 2019 & 2032
- Table 5: Global Spoil Detection-Based Smart Label Revenue million Forecast, by Application 2019 & 2032
- Table 6: Global Spoil Detection-Based Smart Label Revenue million Forecast, by Types 2019 & 2032
- Table 7: Global Spoil Detection-Based Smart Label Revenue million Forecast, by Country 2019 & 2032
- Table 8: United States Spoil Detection-Based Smart Label Revenue (million) Forecast, by Application 2019 & 2032
- Table 9: Canada Spoil Detection-Based Smart Label Revenue (million) Forecast, by Application 2019 & 2032
- Table 10: Mexico Spoil Detection-Based Smart Label Revenue (million) Forecast, by Application 2019 & 2032
- Table 11: Global Spoil Detection-Based Smart Label Revenue million Forecast, by Application 2019 & 2032
- Table 12: Global Spoil Detection-Based Smart Label Revenue million Forecast, by Types 2019 & 2032
- Table 13: Global Spoil Detection-Based Smart Label Revenue million Forecast, by Country 2019 & 2032
- Table 14: Brazil Spoil Detection-Based Smart Label Revenue (million) Forecast, by Application 2019 & 2032
- Table 15: Argentina Spoil Detection-Based Smart Label Revenue (million) Forecast, by Application 2019 & 2032
- Table 16: Rest of South America Spoil Detection-Based Smart Label Revenue (million) Forecast, by Application 2019 & 2032
- Table 17: Global Spoil Detection-Based Smart Label Revenue million Forecast, by Application 2019 & 2032
- Table 18: Global Spoil Detection-Based Smart Label Revenue million Forecast, by Types 2019 & 2032
- Table 19: Global Spoil Detection-Based Smart Label Revenue million Forecast, by Country 2019 & 2032
- Table 20: United Kingdom Spoil Detection-Based Smart Label Revenue (million) Forecast, by Application 2019 & 2032
- Table 21: Germany Spoil Detection-Based Smart Label Revenue (million) Forecast, by Application 2019 & 2032
- Table 22: France Spoil Detection-Based Smart Label Revenue (million) Forecast, by Application 2019 & 2032
- Table 23: Italy Spoil Detection-Based Smart Label Revenue (million) Forecast, by Application 2019 & 2032
- Table 24: Spain Spoil Detection-Based Smart Label Revenue (million) Forecast, by Application 2019 & 2032
- Table 25: Russia Spoil Detection-Based Smart Label Revenue (million) Forecast, by Application 2019 & 2032
- Table 26: Benelux Spoil Detection-Based Smart Label Revenue (million) Forecast, by Application 2019 & 2032
- Table 27: Nordics Spoil Detection-Based Smart Label Revenue (million) Forecast, by Application 2019 & 2032
- Table 28: Rest of Europe Spoil Detection-Based Smart Label Revenue (million) Forecast, by Application 2019 & 2032
- Table 29: Global Spoil Detection-Based Smart Label Revenue million Forecast, by Application 2019 & 2032
- Table 30: Global Spoil Detection-Based Smart Label Revenue million Forecast, by Types 2019 & 2032
- Table 31: Global Spoil Detection-Based Smart Label Revenue million Forecast, by Country 2019 & 2032
- Table 32: Turkey Spoil Detection-Based Smart Label Revenue (million) Forecast, by Application 2019 & 2032
- Table 33: Israel Spoil Detection-Based Smart Label Revenue (million) Forecast, by Application 2019 & 2032
- Table 34: GCC Spoil Detection-Based Smart Label Revenue (million) Forecast, by Application 2019 & 2032
- Table 35: North Africa Spoil Detection-Based Smart Label Revenue (million) Forecast, by Application 2019 & 2032
- Table 36: South Africa Spoil Detection-Based Smart Label Revenue (million) Forecast, by Application 2019 & 2032
- Table 37: Rest of Middle East & Africa Spoil Detection-Based Smart Label Revenue (million) Forecast, by Application 2019 & 2032
- Table 38: Global Spoil Detection-Based Smart Label Revenue million Forecast, by Application 2019 & 2032
- Table 39: Global Spoil Detection-Based Smart Label Revenue million Forecast, by Types 2019 & 2032
- Table 40: Global Spoil Detection-Based Smart Label Revenue million Forecast, by Country 2019 & 2032
- Table 41: China Spoil Detection-Based Smart Label Revenue (million) Forecast, by Application 2019 & 2032
- Table 42: India Spoil Detection-Based Smart Label Revenue (million) Forecast, by Application 2019 & 2032
- Table 43: Japan Spoil Detection-Based Smart Label Revenue (million) Forecast, by Application 2019 & 2032
- Table 44: South Korea Spoil Detection-Based Smart Label Revenue (million) Forecast, by Application 2019 & 2032
- Table 45: ASEAN Spoil Detection-Based Smart Label Revenue (million) Forecast, by Application 2019 & 2032
- Table 46: Oceania Spoil Detection-Based Smart Label Revenue (million) Forecast, by Application 2019 & 2032
- Table 47: Rest of Asia Pacific Spoil Detection-Based Smart Label Revenue (million) Forecast, by Application 2019 & 2032
Frequently Asked Questions
1. What is the projected Compound Annual Growth Rate (CAGR) of the Spoil Detection-Based Smart Label?
The projected CAGR is approximately 12.1%.
2. Which companies are prominent players in the Spoil Detection-Based Smart Label?
Key companies in the market include Thinfilm Electronics, SATO Holding, Zebra Technologies, Invengo Information Technologies, Smartrac.
3. What are the main segments of the Spoil Detection-Based Smart Label?
The market segments include Application, Types.
4. Can you provide details about the market size?
The market size is estimated to be USD 2241.9 million as of 2022.
5. What are some drivers contributing to market growth?
N/A
6. What are the notable trends driving market growth?
N/A
7. Are there any restraints impacting market growth?
N/A
8. Can you provide examples of recent developments in the market?
N/A
9. What pricing options are available for accessing the report?
Pricing options include single-user, multi-user, and enterprise licenses priced at USD 4900.00, USD 7350.00, and USD 9800.00 respectively.
10. Is the market size provided in terms of value or volume?
The market size is provided in terms of value, measured in million.
11. Are there any specific market keywords associated with the report?
Yes, the market keyword associated with the report is "Spoil Detection-Based Smart Label," which aids in identifying and referencing the specific market segment covered.
12. How do I determine which pricing option suits my needs best?
The pricing options vary based on user requirements and access needs. Individual users may opt for single-user licenses, while businesses requiring broader access may choose multi-user or enterprise licenses for cost-effective access to the report.
13. Are there any additional resources or data provided in the Spoil Detection-Based Smart Label report?
While the report offers comprehensive insights, it's advisable to review the specific contents or supplementary materials provided to ascertain if additional resources or data are available.
14. How can I stay updated on further developments or reports in the Spoil Detection-Based Smart Label?
To stay informed about further developments, trends, and reports in the Spoil Detection-Based Smart Label, consider subscribing to industry newsletters, following relevant companies and organizations, or regularly checking reputable industry news sources and publications.
Methodology
Step 1 - Identification of Relevant Samples Size from Population Database


Step 2 - Approaches for Defining Global Market Size (Value, Volume* & Price*)

Note*: In applicable scenarios
Step 3 - Data Sources
Primary Research
- Web Analytics
- Survey Reports
- Research Institute
- Latest Research Reports
- Opinion Leaders
Secondary Research
- Annual Reports
- White Paper
- Latest Press Release
- Industry Association
- Paid Database
- Investor Presentations

Step 4 - Data Triangulation
Involves using different sources of information in order to increase the validity of a study
These sources are likely to be stakeholders in a program - participants, other researchers, program staff, other community members, and so on.
Then we put all data in single framework & apply various statistical tools to find out the dynamic on the market.
During the analysis stage, feedback from the stakeholder groups would be compared to determine areas of agreement as well as areas of divergence
