

Key Insights
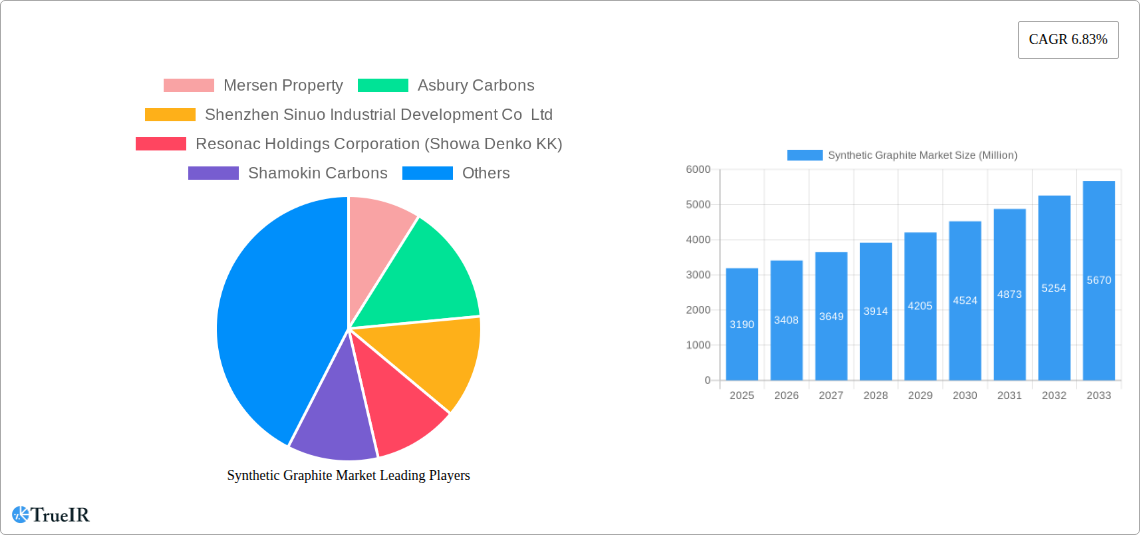
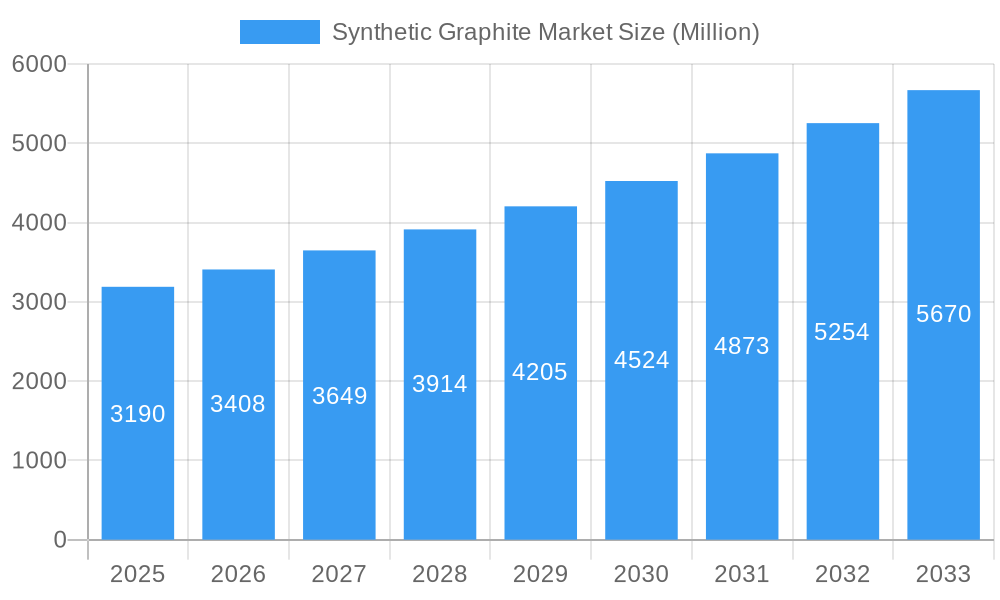
The global synthetic graphite market, valued at $3.19 billion in 2025, is projected to experience robust growth, driven primarily by the burgeoning electric vehicle (EV) battery industry. The increasing demand for energy storage solutions and the global shift towards renewable energy sources are significant catalysts. The market's Compound Annual Growth Rate (CAGR) of 6.83% from 2025 to 2033 indicates a substantial expansion, with projected market values exceeding $5 billion by 2033. Key application segments include batteries, metallurgy, and parts and components, each contributing significantly to overall market growth. Within the type segment, graphite anodes are expected to maintain a dominant position due to their widespread use in lithium-ion batteries. Geographical analysis reveals strong growth in the Asia-Pacific region, particularly in China, India, and South Korea, driven by substantial manufacturing capabilities and high demand from the burgeoning electronics and automotive sectors. North America and Europe are also significant markets, influenced by strong government policies supporting renewable energy and the electric vehicle transition. However, fluctuating raw material prices and the potential environmental concerns associated with graphite production pose challenges to market growth, requiring manufacturers to focus on sustainable sourcing and production methods.
Synthetic Graphite Market Market Size (In Billion)
The competitive landscape is characterized by a mix of established multinational corporations and regional players. Companies like Mersen Property, Asbury Carbons, and several prominent Japanese and Chinese firms are actively engaged in expanding their production capacity and R&D efforts to meet the growing demand. Strategic collaborations, acquisitions, and technological advancements are key competitive strategies. The market is likely to witness consolidation in the coming years, as companies strive to achieve economies of scale and secure a larger market share. Furthermore, increasing focus on developing high-performance synthetic graphite materials with enhanced properties, such as improved conductivity and longevity, will be crucial for maintaining a competitive edge. The long-term outlook for the synthetic graphite market remains positive, supported by continued advancements in battery technology and the global push toward sustainable energy solutions.
Synthetic Graphite Market Company Market Share
Synthetic Graphite Market: A Comprehensive Market Report (2019-2033)
This dynamic report provides a detailed analysis of the Synthetic Graphite Market, offering invaluable insights for industry stakeholders, investors, and researchers. Covering the period from 2019 to 2033, with a base year of 2025 and a forecast period of 2025-2033, this report leverages extensive data and expert analysis to provide a comprehensive understanding of this rapidly evolving market. The report explores key segments, competitive dynamics, and future growth potential, helping you navigate the complexities of the synthetic graphite landscape. The market size is projected to reach xx Million by 2033, exhibiting a healthy CAGR of xx%.
Synthetic Graphite Market Market Structure & Competitive Landscape
The global synthetic graphite market is characterized by a moderately concentrated landscape, with several major players dominating market share. The Herfindahl-Hirschman Index (HHI) for 2024 is estimated at xx, indicating a moderately concentrated market. Innovation is a key driver, with companies focusing on developing high-performance materials for advanced applications. Stringent environmental regulations are influencing production processes and driving the adoption of sustainable practices. Product substitutes, such as carbon nanotubes and graphene, present ongoing competitive challenges, pushing innovation and diversification. End-user segmentation is primarily driven by the burgeoning electric vehicle (EV) battery market, followed by metallurgy, nuclear, and other applications.
Mergers and acquisitions (M&A) activity has been moderate in recent years, with a total volume of xx deals recorded between 2019 and 2024, valued at approximately xx Million. This trend is expected to continue as companies seek to expand their market reach and secure access to key raw materials.
- Market Concentration: Moderately concentrated, with HHI of xx in 2024.
- Innovation Drivers: Development of high-performance materials for advanced applications.
- Regulatory Impacts: Stringent environmental regulations driving sustainable production.
- Product Substitutes: Carbon nanotubes and graphene pose competitive challenges.
- End-User Segmentation: Dominated by the EV battery market, followed by metallurgy and nuclear applications.
- M&A Trends: Moderate activity (xx deals, xx Million value) from 2019-2024.
Synthetic Graphite Market Market Trends & Opportunities
The synthetic graphite market is experiencing robust growth, fueled primarily by the expanding electric vehicle (EV) industry. The increasing demand for lithium-ion batteries, which utilize synthetic graphite as a crucial anode material, is the primary driver of market expansion. Technological advancements in graphite production and purification techniques are also contributing to improved product quality and efficiency. Consumer preferences for environmentally friendly and sustainable energy solutions are bolstering demand for EVs and consequently, synthetic graphite. Competitive dynamics are shaped by ongoing innovation, strategic partnerships, and investments in capacity expansion.
The market size is projected to witness significant expansion, with a CAGR of xx% from 2025 to 2033. Market penetration rates are increasing across various regions, particularly in Asia-Pacific and North America. Technological shifts are marked by the development of high-capacity, high-purity synthetic graphite materials optimized for next-generation battery chemistries. The focus on enhancing the energy density and cycle life of batteries is driving investments in advanced production processes and material science.
Dominant Markets & Segments in Synthetic Graphite Market
The Asia-Pacific region dominates the synthetic graphite market, driven by the rapid growth of the EV industry and the presence of major battery manufacturers in China, Japan, and South Korea. Within the market segments, the Graphite Anode segment holds the largest market share, followed by Graphite Block (Fine Carbon), due to their extensive use in lithium-ion batteries. The battery application segment is the fastest-growing segment, exhibiting substantial growth potential driven by the widespread adoption of EVs and energy storage systems.
Key Growth Drivers (Asia-Pacific):
- Rapid growth of the electric vehicle industry.
- Presence of major battery manufacturers.
- Favorable government policies and incentives.
- Growing demand for renewable energy storage solutions.
Key Growth Drivers (Graphite Anode Segment):
- Increasing demand from lithium-ion battery manufacturers.
- Advances in anode material technology.
- Cost-effectiveness compared to other anode materials.
Key Growth Drivers (Battery Application Segment):
- Explosive growth of the electric vehicle market.
- Rising demand for grid-scale energy storage systems.
- Growing adoption of portable electronic devices.
Synthetic Graphite Market Product Analysis
Product innovations in synthetic graphite are focused on enhancing purity, improving electrical conductivity, and increasing the surface area for enhanced battery performance. Technological advancements involve the development of specialized processing techniques, such as fluidized bed graphitization and high-temperature annealing, to create high-performance graphite materials. These advancements are enhancing market fit by providing optimized materials for various applications, including high-energy-density batteries, advanced metallurgical processes, and nuclear reactors. The competitive advantages are primarily derived from superior product quality, lower production costs, and strong supply chain capabilities.
Key Drivers, Barriers & Challenges in Synthetic Graphite Market
Key Drivers:
The primary drivers are the booming EV market, stringent environmental regulations promoting renewable energy, and ongoing technological advancements in battery technology. Government incentives and subsidies for EV adoption are further bolstering market growth.
Challenges:
Supply chain disruptions and fluctuations in raw material prices pose significant challenges. Strict environmental regulations can increase production costs, while intense competition among major players creates pricing pressures.
Growth Drivers in the Synthetic Graphite Market Market
Growth is primarily fueled by the explosive growth of the electric vehicle market, which is driving a surge in demand for high-performance lithium-ion batteries. The increasing adoption of renewable energy solutions and energy storage systems further supports market expansion. Government policies promoting sustainable energy are also contributing to the growth of this market. Technological innovations in graphite production and purification techniques are leading to higher quality and more cost-effective materials.
Challenges Impacting Synthetic Graphite Market Growth
Challenges include the volatility of raw material prices, potential supply chain disruptions, and intense competition among established players. Strict environmental regulations can increase production costs, and the emergence of alternative anode materials for batteries poses a competitive threat.
Key Players Shaping the Synthetic Graphite Market Market
- Mersen Property
- Asbury Carbons
- Shenzhen Sinuo Industrial Development Co Ltd
- Resonac Holdings Corporation (Showa Denko KK)
- Shamokin Carbons
- Mitsubishi Chemical Corporation
- Nippon Carbon Co Ltd
- Jiangxi Zichen Technology Co Ltd
- Tokai Cobex GmbH
- GrafTech International
- BTR New Materials Group Co Ltd
- Imerys
- Shanghai Shanshan Technology Co Ltd
- Graphit Kropfmühl GmbH
- Graphite India Limited
- Lianyungang Jinli Carbon Co Ltd
Significant Synthetic Graphite Market Industry Milestones
- October 2022: Imerys Imerys Graphite & Carbon Company launched the EMILI Project, a landmark lithium exploitation project aimed at reducing lithium imports and producing nearly 700,000 EV batteries annually. This significantly impacts the supply chain and reduces reliance on imported lithium.
- April 2022: Shanshan Corporation secured USD 477 Million in investment from strategic investors (Wending Investment, BYD, ATL, and Kunlun Fund), boosting its lithium battery material production capacity and strengthening its market position. This signifies increased investment in the lithium-ion battery supply chain, driving demand for synthetic graphite.
Future Outlook for Synthetic Graphite Market Market
The synthetic graphite market is poised for continued robust growth, driven by the sustained expansion of the EV market and the growing demand for energy storage solutions. Strategic opportunities lie in developing advanced graphite materials with superior performance characteristics, focusing on sustainability and optimizing supply chain efficiency. The market holds significant potential for innovation and expansion, particularly in emerging markets with strong EV adoption rates. The market is expected to witness a further consolidation as companies invest in R&D and expand their production capacity.
Synthetic Graphite Market Segmentation
-
1. Type
- 1.1. Graphite Anode
- 1.2. Graphite Block (Fine Carbon)
- 1.3. Other Types (Graphite Electrode, etc.)
-
2. Application
- 2.1. Metallurgy
- 2.2. Parts and Components
- 2.3. Batteries
- 2.4. Nuclear
- 2.5. Other Applications
Synthetic Graphite Market Segmentation By Geography
-
1. Asia Pacific
- 1.1. China
- 1.2. India
- 1.3. Japan
- 1.4. South Korea
- 1.5. Asean Countries
- 1.6. Rest of Asia Pacific
-
2. North America
- 2.1. United States
- 2.2. Canada
- 2.3. Mexico
-
3. Europe
- 3.1. Germany
- 3.2. United Kingdom
- 3.3. Italy
- 3.4. France
- 3.5. Russia
- 3.6. Rest of Europe
-
4. South America
- 4.1. Brazil
- 4.2. Argentina
- 4.3. Rest of South America
-
5. Middle East and Africa
- 5.1. Saudi Arabia
- 5.2. South Africa
- 5.3. Rest of Middle East and Africa
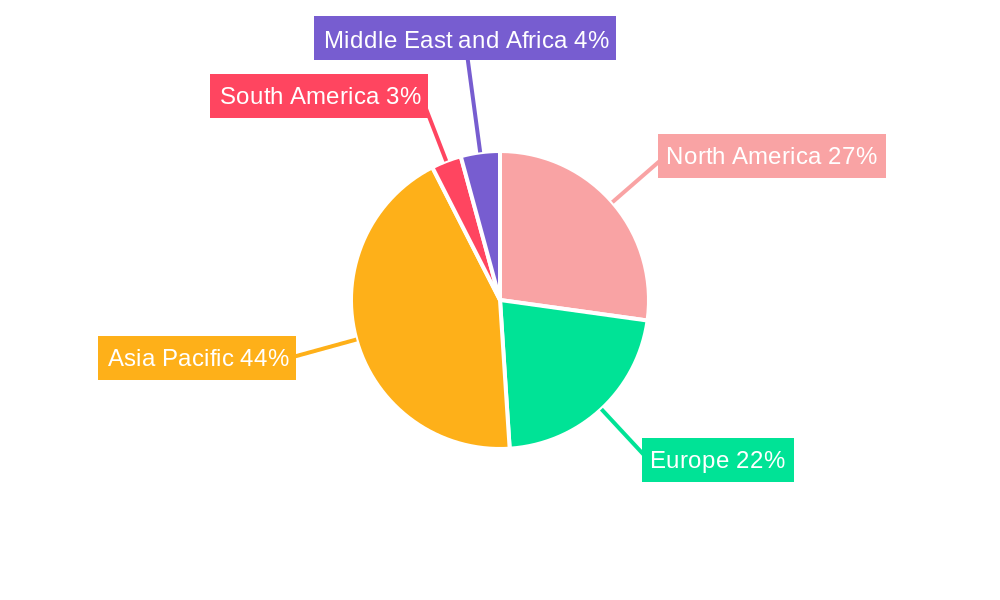
Synthetic Graphite Market Regional Market Share
Geographic Coverage of Synthetic Graphite Market
Synthetic Graphite Market REPORT HIGHLIGHTS
| Aspects | Details |
|---|---|
| Study Period | 2020-2034 |
| Base Year | 2025 |
| Estimated Year | 2026 |
| Forecast Period | 2026-2034 |
| Historical Period | 2020-2025 |
| Growth Rate | CAGR of 15.1% from 2020-2034 |
| Segmentation |
|
Table of Contents
- 1. Introduction
- 1.1. Research Scope
- 1.2. Market Segmentation
- 1.3. Research Objective
- 1.4. Definitions and Assumptions
- 2. Executive Summary
- 2.1. Market Snapshot
- 3. Market Dynamics
- 3.1. Market Drivers
- 3.2. Market Restrains
- 3.3. Market Trends
- 3.4. Market Opportunities
- 4. Market Factor Analysis
- 4.1. Porters Five Forces
- 4.1.1. Bargaining Power of Suppliers
- 4.1.2. Bargaining Power of Buyers
- 4.1.3. Threat of New Entrants
- 4.1.4. Threat of Substitutes
- 4.1.5. Competitive Rivalry
- 4.2. PESTEL analysis
- 4.3. BCG Analysis
- 4.3.1. Stars (High Growth, High Market Share)
- 4.3.2. Cash Cows (Low Growth, High Market Share)
- 4.3.3. Question Mark (High Growth, Low Market Share)
- 4.3.4. Dogs (Low Growth, Low Market Share)
- 4.4. Ansoff Matrix Analysis
- 4.5. Supply Chain Analysis
- 4.6. Regulatory Landscape
- 4.7. Current Market Potential and Opportunity Assessment (TAM–SAM–SOM Framework)
- 4.8. TIR Analyst Note
- 4.1. Porters Five Forces
- 5. Market Analysis, Insights and Forecast 2021-2033
- 5.1. Market Analysis, Insights and Forecast - by Type
- 5.1.1. Graphite Anode
- 5.1.2. Graphite Block (Fine Carbon)
- 5.1.3. Other Types (Graphite Electrode, etc.)
- 5.2. Market Analysis, Insights and Forecast - by Application
- 5.2.1. Metallurgy
- 5.2.2. Parts and Components
- 5.2.3. Batteries
- 5.2.4. Nuclear
- 5.2.5. Other Applications
- 5.3. Market Analysis, Insights and Forecast - by Region
- 5.3.1. Asia Pacific
- 5.3.2. North America
- 5.3.3. Europe
- 5.3.4. South America
- 5.3.5. Middle East and Africa
- 5.1. Market Analysis, Insights and Forecast - by Type
- 6. Global Synthetic Graphite Market Analysis, Insights and Forecast, 2021-2033
- 6.1. Market Analysis, Insights and Forecast - by Type
- 6.1.1. Graphite Anode
- 6.1.2. Graphite Block (Fine Carbon)
- 6.1.3. Other Types (Graphite Electrode, etc.)
- 6.2. Market Analysis, Insights and Forecast - by Application
- 6.2.1. Metallurgy
- 6.2.2. Parts and Components
- 6.2.3. Batteries
- 6.2.4. Nuclear
- 6.2.5. Other Applications
- 6.1. Market Analysis, Insights and Forecast - by Type
- 7. Asia Pacific Synthetic Graphite Market Analysis, Insights and Forecast, 2020-2032
- 7.1. Market Analysis, Insights and Forecast - by Type
- 7.1.1. Graphite Anode
- 7.1.2. Graphite Block (Fine Carbon)
- 7.1.3. Other Types (Graphite Electrode, etc.)
- 7.2. Market Analysis, Insights and Forecast - by Application
- 7.2.1. Metallurgy
- 7.2.2. Parts and Components
- 7.2.3. Batteries
- 7.2.4. Nuclear
- 7.2.5. Other Applications
- 7.1. Market Analysis, Insights and Forecast - by Type
- 8. North America Synthetic Graphite Market Analysis, Insights and Forecast, 2020-2032
- 8.1. Market Analysis, Insights and Forecast - by Type
- 8.1.1. Graphite Anode
- 8.1.2. Graphite Block (Fine Carbon)
- 8.1.3. Other Types (Graphite Electrode, etc.)
- 8.2. Market Analysis, Insights and Forecast - by Application
- 8.2.1. Metallurgy
- 8.2.2. Parts and Components
- 8.2.3. Batteries
- 8.2.4. Nuclear
- 8.2.5. Other Applications
- 8.1. Market Analysis, Insights and Forecast - by Type
- 9. Europe Synthetic Graphite Market Analysis, Insights and Forecast, 2020-2032
- 9.1. Market Analysis, Insights and Forecast - by Type
- 9.1.1. Graphite Anode
- 9.1.2. Graphite Block (Fine Carbon)
- 9.1.3. Other Types (Graphite Electrode, etc.)
- 9.2. Market Analysis, Insights and Forecast - by Application
- 9.2.1. Metallurgy
- 9.2.2. Parts and Components
- 9.2.3. Batteries
- 9.2.4. Nuclear
- 9.2.5. Other Applications
- 9.1. Market Analysis, Insights and Forecast - by Type
- 10. South America Synthetic Graphite Market Analysis, Insights and Forecast, 2020-2032
- 10.1. Market Analysis, Insights and Forecast - by Type
- 10.1.1. Graphite Anode
- 10.1.2. Graphite Block (Fine Carbon)
- 10.1.3. Other Types (Graphite Electrode, etc.)
- 10.2. Market Analysis, Insights and Forecast - by Application
- 10.2.1. Metallurgy
- 10.2.2. Parts and Components
- 10.2.3. Batteries
- 10.2.4. Nuclear
- 10.2.5. Other Applications
- 10.1. Market Analysis, Insights and Forecast - by Type
- 11. Middle East and Africa Synthetic Graphite Market Analysis, Insights and Forecast, 2020-2032
- 11.1. Market Analysis, Insights and Forecast - by Type
- 11.1.1. Graphite Anode
- 11.1.2. Graphite Block (Fine Carbon)
- 11.1.3. Other Types (Graphite Electrode, etc.)
- 11.2. Market Analysis, Insights and Forecast - by Application
- 11.2.1. Metallurgy
- 11.2.2. Parts and Components
- 11.2.3. Batteries
- 11.2.4. Nuclear
- 11.2.5. Other Applications
- 11.1. Market Analysis, Insights and Forecast - by Type
- 12. Competitive Analysis
- 12.1. Company Profiles
- 12.1.1 Mersen Property
- 12.1.1.1. Company Overview
- 12.1.1.2. Products
- 12.1.1.3. Company Financials
- 12.1.1.4. SWOT Analysis
- 12.1.2 Asbury Carbons
- 12.1.2.1. Company Overview
- 12.1.2.2. Products
- 12.1.2.3. Company Financials
- 12.1.2.4. SWOT Analysis
- 12.1.3 Shenzhen Sinuo Industrial Development Co Ltd
- 12.1.3.1. Company Overview
- 12.1.3.2. Products
- 12.1.3.3. Company Financials
- 12.1.3.4. SWOT Analysis
- 12.1.4 Resonac Holdings Corporation (Showa Denko KK)
- 12.1.4.1. Company Overview
- 12.1.4.2. Products
- 12.1.4.3. Company Financials
- 12.1.4.4. SWOT Analysis
- 12.1.5 Shamokin Carbons
- 12.1.5.1. Company Overview
- 12.1.5.2. Products
- 12.1.5.3. Company Financials
- 12.1.5.4. SWOT Analysis
- 12.1.6 Mitsubishi Chemical Corporation
- 12.1.6.1. Company Overview
- 12.1.6.2. Products
- 12.1.6.3. Company Financials
- 12.1.6.4. SWOT Analysis
- 12.1.7 Nippon Carbon Co Ltd
- 12.1.7.1. Company Overview
- 12.1.7.2. Products
- 12.1.7.3. Company Financials
- 12.1.7.4. SWOT Analysis
- 12.1.8 Jiangxi Zichen Technology Co Ltd
- 12.1.8.1. Company Overview
- 12.1.8.2. Products
- 12.1.8.3. Company Financials
- 12.1.8.4. SWOT Analysis
- 12.1.9 Tokai Cobex GmbH
- 12.1.9.1. Company Overview
- 12.1.9.2. Products
- 12.1.9.3. Company Financials
- 12.1.9.4. SWOT Analysis
- 12.1.10 GrafTech International
- 12.1.10.1. Company Overview
- 12.1.10.2. Products
- 12.1.10.3. Company Financials
- 12.1.10.4. SWOT Analysis
- 12.1.11 BTR New Materials Group Co Ltd
- 12.1.11.1. Company Overview
- 12.1.11.2. Products
- 12.1.11.3. Company Financials
- 12.1.11.4. SWOT Analysis
- 12.1.12 Imerys
- 12.1.12.1. Company Overview
- 12.1.12.2. Products
- 12.1.12.3. Company Financials
- 12.1.12.4. SWOT Analysis
- 12.1.13 Shanghai Shanshan Technology Co Ltd
- 12.1.13.1. Company Overview
- 12.1.13.2. Products
- 12.1.13.3. Company Financials
- 12.1.13.4. SWOT Analysis
- 12.1.14 Graphit Kropfmhl GmbH
- 12.1.14.1. Company Overview
- 12.1.14.2. Products
- 12.1.14.3. Company Financials
- 12.1.14.4. SWOT Analysis
- 12.1.15 Graphite India Limited
- 12.1.15.1. Company Overview
- 12.1.15.2. Products
- 12.1.15.3. Company Financials
- 12.1.15.4. SWOT Analysis
- 12.1.16 Lianyungang Jinli Carbon Co Ltd
- 12.1.16.1. Company Overview
- 12.1.16.2. Products
- 12.1.16.3. Company Financials
- 12.1.16.4. SWOT Analysis
- 12.1.1 Mersen Property
- 12.2. Market Entropy
- 12.2.1 Company's Key Areas Served
- 12.2.2 Recent Developments
- 12.3. Company Market Share Analysis 2025
- 12.3.1 Top 5 Companies Market Share Analysis
- 12.3.2 Top 3 Companies Market Share Analysis
- 12.4. List of Potential Customers
- 13. Research Methodology
List of Figures
- Figure 1: Global Synthetic Graphite Market Revenue Breakdown (billion, %) by Region 2025 & 2033
- Figure 2: Global Synthetic Graphite Market Volume Breakdown (K Tons, %) by Region 2025 & 2033
- Figure 3: Asia Pacific Synthetic Graphite Market Revenue (billion), by Type 2025 & 2033
- Figure 4: Asia Pacific Synthetic Graphite Market Volume (K Tons), by Type 2025 & 2033
- Figure 5: Asia Pacific Synthetic Graphite Market Revenue Share (%), by Type 2025 & 2033
- Figure 6: Asia Pacific Synthetic Graphite Market Volume Share (%), by Type 2025 & 2033
- Figure 7: Asia Pacific Synthetic Graphite Market Revenue (billion), by Application 2025 & 2033
- Figure 8: Asia Pacific Synthetic Graphite Market Volume (K Tons), by Application 2025 & 2033
- Figure 9: Asia Pacific Synthetic Graphite Market Revenue Share (%), by Application 2025 & 2033
- Figure 10: Asia Pacific Synthetic Graphite Market Volume Share (%), by Application 2025 & 2033
- Figure 11: Asia Pacific Synthetic Graphite Market Revenue (billion), by Country 2025 & 2033
- Figure 12: Asia Pacific Synthetic Graphite Market Volume (K Tons), by Country 2025 & 2033
- Figure 13: Asia Pacific Synthetic Graphite Market Revenue Share (%), by Country 2025 & 2033
- Figure 14: Asia Pacific Synthetic Graphite Market Volume Share (%), by Country 2025 & 2033
- Figure 15: North America Synthetic Graphite Market Revenue (billion), by Type 2025 & 2033
- Figure 16: North America Synthetic Graphite Market Volume (K Tons), by Type 2025 & 2033
- Figure 17: North America Synthetic Graphite Market Revenue Share (%), by Type 2025 & 2033
- Figure 18: North America Synthetic Graphite Market Volume Share (%), by Type 2025 & 2033
- Figure 19: North America Synthetic Graphite Market Revenue (billion), by Application 2025 & 2033
- Figure 20: North America Synthetic Graphite Market Volume (K Tons), by Application 2025 & 2033
- Figure 21: North America Synthetic Graphite Market Revenue Share (%), by Application 2025 & 2033
- Figure 22: North America Synthetic Graphite Market Volume Share (%), by Application 2025 & 2033
- Figure 23: North America Synthetic Graphite Market Revenue (billion), by Country 2025 & 2033
- Figure 24: North America Synthetic Graphite Market Volume (K Tons), by Country 2025 & 2033
- Figure 25: North America Synthetic Graphite Market Revenue Share (%), by Country 2025 & 2033
- Figure 26: North America Synthetic Graphite Market Volume Share (%), by Country 2025 & 2033
- Figure 27: Europe Synthetic Graphite Market Revenue (billion), by Type 2025 & 2033
- Figure 28: Europe Synthetic Graphite Market Volume (K Tons), by Type 2025 & 2033
- Figure 29: Europe Synthetic Graphite Market Revenue Share (%), by Type 2025 & 2033
- Figure 30: Europe Synthetic Graphite Market Volume Share (%), by Type 2025 & 2033
- Figure 31: Europe Synthetic Graphite Market Revenue (billion), by Application 2025 & 2033
- Figure 32: Europe Synthetic Graphite Market Volume (K Tons), by Application 2025 & 2033
- Figure 33: Europe Synthetic Graphite Market Revenue Share (%), by Application 2025 & 2033
- Figure 34: Europe Synthetic Graphite Market Volume Share (%), by Application 2025 & 2033
- Figure 35: Europe Synthetic Graphite Market Revenue (billion), by Country 2025 & 2033
- Figure 36: Europe Synthetic Graphite Market Volume (K Tons), by Country 2025 & 2033
- Figure 37: Europe Synthetic Graphite Market Revenue Share (%), by Country 2025 & 2033
- Figure 38: Europe Synthetic Graphite Market Volume Share (%), by Country 2025 & 2033
- Figure 39: South America Synthetic Graphite Market Revenue (billion), by Type 2025 & 2033
- Figure 40: South America Synthetic Graphite Market Volume (K Tons), by Type 2025 & 2033
- Figure 41: South America Synthetic Graphite Market Revenue Share (%), by Type 2025 & 2033
- Figure 42: South America Synthetic Graphite Market Volume Share (%), by Type 2025 & 2033
- Figure 43: South America Synthetic Graphite Market Revenue (billion), by Application 2025 & 2033
- Figure 44: South America Synthetic Graphite Market Volume (K Tons), by Application 2025 & 2033
- Figure 45: South America Synthetic Graphite Market Revenue Share (%), by Application 2025 & 2033
- Figure 46: South America Synthetic Graphite Market Volume Share (%), by Application 2025 & 2033
- Figure 47: South America Synthetic Graphite Market Revenue (billion), by Country 2025 & 2033
- Figure 48: South America Synthetic Graphite Market Volume (K Tons), by Country 2025 & 2033
- Figure 49: South America Synthetic Graphite Market Revenue Share (%), by Country 2025 & 2033
- Figure 50: South America Synthetic Graphite Market Volume Share (%), by Country 2025 & 2033
- Figure 51: Middle East and Africa Synthetic Graphite Market Revenue (billion), by Type 2025 & 2033
- Figure 52: Middle East and Africa Synthetic Graphite Market Volume (K Tons), by Type 2025 & 2033
- Figure 53: Middle East and Africa Synthetic Graphite Market Revenue Share (%), by Type 2025 & 2033
- Figure 54: Middle East and Africa Synthetic Graphite Market Volume Share (%), by Type 2025 & 2033
- Figure 55: Middle East and Africa Synthetic Graphite Market Revenue (billion), by Application 2025 & 2033
- Figure 56: Middle East and Africa Synthetic Graphite Market Volume (K Tons), by Application 2025 & 2033
- Figure 57: Middle East and Africa Synthetic Graphite Market Revenue Share (%), by Application 2025 & 2033
- Figure 58: Middle East and Africa Synthetic Graphite Market Volume Share (%), by Application 2025 & 2033
- Figure 59: Middle East and Africa Synthetic Graphite Market Revenue (billion), by Country 2025 & 2033
- Figure 60: Middle East and Africa Synthetic Graphite Market Volume (K Tons), by Country 2025 & 2033
- Figure 61: Middle East and Africa Synthetic Graphite Market Revenue Share (%), by Country 2025 & 2033
- Figure 62: Middle East and Africa Synthetic Graphite Market Volume Share (%), by Country 2025 & 2033
List of Tables
- Table 1: Global Synthetic Graphite Market Revenue billion Forecast, by Type 2020 & 2033
- Table 2: Global Synthetic Graphite Market Volume K Tons Forecast, by Type 2020 & 2033
- Table 3: Global Synthetic Graphite Market Revenue billion Forecast, by Application 2020 & 2033
- Table 4: Global Synthetic Graphite Market Volume K Tons Forecast, by Application 2020 & 2033
- Table 5: Global Synthetic Graphite Market Revenue billion Forecast, by Region 2020 & 2033
- Table 6: Global Synthetic Graphite Market Volume K Tons Forecast, by Region 2020 & 2033
- Table 7: Global Synthetic Graphite Market Revenue billion Forecast, by Type 2020 & 2033
- Table 8: Global Synthetic Graphite Market Volume K Tons Forecast, by Type 2020 & 2033
- Table 9: Global Synthetic Graphite Market Revenue billion Forecast, by Application 2020 & 2033
- Table 10: Global Synthetic Graphite Market Volume K Tons Forecast, by Application 2020 & 2033
- Table 11: Global Synthetic Graphite Market Revenue billion Forecast, by Country 2020 & 2033
- Table 12: Global Synthetic Graphite Market Volume K Tons Forecast, by Country 2020 & 2033
- Table 13: China Synthetic Graphite Market Revenue (billion) Forecast, by Application 2020 & 2033
- Table 14: China Synthetic Graphite Market Volume (K Tons) Forecast, by Application 2020 & 2033
- Table 15: India Synthetic Graphite Market Revenue (billion) Forecast, by Application 2020 & 2033
- Table 16: India Synthetic Graphite Market Volume (K Tons) Forecast, by Application 2020 & 2033
- Table 17: Japan Synthetic Graphite Market Revenue (billion) Forecast, by Application 2020 & 2033
- Table 18: Japan Synthetic Graphite Market Volume (K Tons) Forecast, by Application 2020 & 2033
- Table 19: South Korea Synthetic Graphite Market Revenue (billion) Forecast, by Application 2020 & 2033
- Table 20: South Korea Synthetic Graphite Market Volume (K Tons) Forecast, by Application 2020 & 2033
- Table 21: Asean Countries Synthetic Graphite Market Revenue (billion) Forecast, by Application 2020 & 2033
- Table 22: Asean Countries Synthetic Graphite Market Volume (K Tons) Forecast, by Application 2020 & 2033
- Table 23: Rest of Asia Pacific Synthetic Graphite Market Revenue (billion) Forecast, by Application 2020 & 2033
- Table 24: Rest of Asia Pacific Synthetic Graphite Market Volume (K Tons) Forecast, by Application 2020 & 2033
- Table 25: Global Synthetic Graphite Market Revenue billion Forecast, by Type 2020 & 2033
- Table 26: Global Synthetic Graphite Market Volume K Tons Forecast, by Type 2020 & 2033
- Table 27: Global Synthetic Graphite Market Revenue billion Forecast, by Application 2020 & 2033
- Table 28: Global Synthetic Graphite Market Volume K Tons Forecast, by Application 2020 & 2033
- Table 29: Global Synthetic Graphite Market Revenue billion Forecast, by Country 2020 & 2033
- Table 30: Global Synthetic Graphite Market Volume K Tons Forecast, by Country 2020 & 2033
- Table 31: United States Synthetic Graphite Market Revenue (billion) Forecast, by Application 2020 & 2033
- Table 32: United States Synthetic Graphite Market Volume (K Tons) Forecast, by Application 2020 & 2033
- Table 33: Canada Synthetic Graphite Market Revenue (billion) Forecast, by Application 2020 & 2033
- Table 34: Canada Synthetic Graphite Market Volume (K Tons) Forecast, by Application 2020 & 2033
- Table 35: Mexico Synthetic Graphite Market Revenue (billion) Forecast, by Application 2020 & 2033
- Table 36: Mexico Synthetic Graphite Market Volume (K Tons) Forecast, by Application 2020 & 2033
- Table 37: Global Synthetic Graphite Market Revenue billion Forecast, by Type 2020 & 2033
- Table 38: Global Synthetic Graphite Market Volume K Tons Forecast, by Type 2020 & 2033
- Table 39: Global Synthetic Graphite Market Revenue billion Forecast, by Application 2020 & 2033
- Table 40: Global Synthetic Graphite Market Volume K Tons Forecast, by Application 2020 & 2033
- Table 41: Global Synthetic Graphite Market Revenue billion Forecast, by Country 2020 & 2033
- Table 42: Global Synthetic Graphite Market Volume K Tons Forecast, by Country 2020 & 2033
- Table 43: Germany Synthetic Graphite Market Revenue (billion) Forecast, by Application 2020 & 2033
- Table 44: Germany Synthetic Graphite Market Volume (K Tons) Forecast, by Application 2020 & 2033
- Table 45: United Kingdom Synthetic Graphite Market Revenue (billion) Forecast, by Application 2020 & 2033
- Table 46: United Kingdom Synthetic Graphite Market Volume (K Tons) Forecast, by Application 2020 & 2033
- Table 47: Italy Synthetic Graphite Market Revenue (billion) Forecast, by Application 2020 & 2033
- Table 48: Italy Synthetic Graphite Market Volume (K Tons) Forecast, by Application 2020 & 2033
- Table 49: France Synthetic Graphite Market Revenue (billion) Forecast, by Application 2020 & 2033
- Table 50: France Synthetic Graphite Market Volume (K Tons) Forecast, by Application 2020 & 2033
- Table 51: Russia Synthetic Graphite Market Revenue (billion) Forecast, by Application 2020 & 2033
- Table 52: Russia Synthetic Graphite Market Volume (K Tons) Forecast, by Application 2020 & 2033
- Table 53: Rest of Europe Synthetic Graphite Market Revenue (billion) Forecast, by Application 2020 & 2033
- Table 54: Rest of Europe Synthetic Graphite Market Volume (K Tons) Forecast, by Application 2020 & 2033
- Table 55: Global Synthetic Graphite Market Revenue billion Forecast, by Type 2020 & 2033
- Table 56: Global Synthetic Graphite Market Volume K Tons Forecast, by Type 2020 & 2033
- Table 57: Global Synthetic Graphite Market Revenue billion Forecast, by Application 2020 & 2033
- Table 58: Global Synthetic Graphite Market Volume K Tons Forecast, by Application 2020 & 2033
- Table 59: Global Synthetic Graphite Market Revenue billion Forecast, by Country 2020 & 2033
- Table 60: Global Synthetic Graphite Market Volume K Tons Forecast, by Country 2020 & 2033
- Table 61: Brazil Synthetic Graphite Market Revenue (billion) Forecast, by Application 2020 & 2033
- Table 62: Brazil Synthetic Graphite Market Volume (K Tons) Forecast, by Application 2020 & 2033
- Table 63: Argentina Synthetic Graphite Market Revenue (billion) Forecast, by Application 2020 & 2033
- Table 64: Argentina Synthetic Graphite Market Volume (K Tons) Forecast, by Application 2020 & 2033
- Table 65: Rest of South America Synthetic Graphite Market Revenue (billion) Forecast, by Application 2020 & 2033
- Table 66: Rest of South America Synthetic Graphite Market Volume (K Tons) Forecast, by Application 2020 & 2033
- Table 67: Global Synthetic Graphite Market Revenue billion Forecast, by Type 2020 & 2033
- Table 68: Global Synthetic Graphite Market Volume K Tons Forecast, by Type 2020 & 2033
- Table 69: Global Synthetic Graphite Market Revenue billion Forecast, by Application 2020 & 2033
- Table 70: Global Synthetic Graphite Market Volume K Tons Forecast, by Application 2020 & 2033
- Table 71: Global Synthetic Graphite Market Revenue billion Forecast, by Country 2020 & 2033
- Table 72: Global Synthetic Graphite Market Volume K Tons Forecast, by Country 2020 & 2033
- Table 73: Saudi Arabia Synthetic Graphite Market Revenue (billion) Forecast, by Application 2020 & 2033
- Table 74: Saudi Arabia Synthetic Graphite Market Volume (K Tons) Forecast, by Application 2020 & 2033
- Table 75: South Africa Synthetic Graphite Market Revenue (billion) Forecast, by Application 2020 & 2033
- Table 76: South Africa Synthetic Graphite Market Volume (K Tons) Forecast, by Application 2020 & 2033
- Table 77: Rest of Middle East and Africa Synthetic Graphite Market Revenue (billion) Forecast, by Application 2020 & 2033
- Table 78: Rest of Middle East and Africa Synthetic Graphite Market Volume (K Tons) Forecast, by Application 2020 & 2033
Frequently Asked Questions
1. What is the projected Compound Annual Growth Rate (CAGR) of the Synthetic Graphite Market?
The projected CAGR is approximately 15.1%.
2. Which companies are prominent players in the Synthetic Graphite Market?
Key companies in the market include Mersen Property, Asbury Carbons, Shenzhen Sinuo Industrial Development Co Ltd, Resonac Holdings Corporation (Showa Denko KK), Shamokin Carbons, Mitsubishi Chemical Corporation, Nippon Carbon Co Ltd, Jiangxi Zichen Technology Co Ltd, Tokai Cobex GmbH, GrafTech International, BTR New Materials Group Co Ltd, Imerys, Shanghai Shanshan Technology Co Ltd, Graphit Kropfmhl GmbH, Graphite India Limited, Lianyungang Jinli Carbon Co Ltd.
3. What are the main segments of the Synthetic Graphite Market?
The market segments include Type, Application.
4. Can you provide details about the market size?
The market size is estimated to be USD 15.67 billion as of 2022.
5. What are some drivers contributing to market growth?
Increasing Demand for Electric Vehicles; Growing Utilization of Electric ARC Furnace Process for Steel Production.
6. What are the notable trends driving market growth?
Metallurgy Segment to Drive the Market.
7. Are there any restraints impacting market growth?
Stringent Environmental Regulations; Decreasing Production of Steel.
8. Can you provide examples of recent developments in the market?
October 2022: Imerys Imerys Graphite & Carbon Company announced the launch of a landmark lithium exploitation project ('the EMILI Project'). It may significantly reduce the need to import lithium and aid in producing nearly 700,000 electric vehicle batteries annually.
9. What pricing options are available for accessing the report?
Pricing options include single-user, multi-user, and enterprise licenses priced at USD 4750, USD 5250, and USD 8750 respectively.
10. Is the market size provided in terms of value or volume?
The market size is provided in terms of value, measured in billion and volume, measured in K Tons.
11. Are there any specific market keywords associated with the report?
Yes, the market keyword associated with the report is "Synthetic Graphite Market," which aids in identifying and referencing the specific market segment covered.
12. How do I determine which pricing option suits my needs best?
The pricing options vary based on user requirements and access needs. Individual users may opt for single-user licenses, while businesses requiring broader access may choose multi-user or enterprise licenses for cost-effective access to the report.
13. Are there any additional resources or data provided in the Synthetic Graphite Market report?
While the report offers comprehensive insights, it's advisable to review the specific contents or supplementary materials provided to ascertain if additional resources or data are available.
14. How can I stay updated on further developments or reports in the Synthetic Graphite Market?
To stay informed about further developments, trends, and reports in the Synthetic Graphite Market, consider subscribing to industry newsletters, following relevant companies and organizations, or regularly checking reputable industry news sources and publications.
Methodology
Step 1 - Identification of Relevant Samples Size from Population Database


Step 2 - Approaches for Defining Global Market Size (Value, Volume* & Price*)

Note*: In applicable scenarios
Step 3 - Data Sources
Primary Research
- Web Analytics
- Survey Reports
- Research Institute
- Latest Research Reports
- Opinion Leaders
Secondary Research
- Annual Reports
- White Paper
- Latest Press Release
- Industry Association
- Paid Database
- Investor Presentations

Step 4 - Data Triangulation
Involves using different sources of information in order to increase the validity of a study
These sources are likely to be stakeholders in a program - participants, other researchers, program staff, other community members, and so on.
Then we put all data in single framework & apply various statistical tools to find out the dynamic on the market.
During the analysis stage, feedback from the stakeholder groups would be compared to determine areas of agreement as well as areas of divergence