

Key Insights
The North American oil and gas lubricants market is projected for robust expansion, fueled by escalating exploration and production activities. This market is anticipated to reach approximately $7.29 billion by 2025, exhibiting a Compound Annual Growth Rate (CAGR) of 0.16. Key growth drivers include rising energy demand and stringent regulations promoting the adoption of high-performance lubricants for enhanced equipment efficiency and longevity. Technological advancements in lubricant formulations, focusing on improved viscosity, thermal stability, and biodegradability, are further propelling market growth. However, crude oil price volatility and broader economic conditions present potential restraints. The long-term shift towards renewable energy sources may pose a challenge, although the continued reliance on fossil fuels currently mitigates this impact. Specialized lubricants for drilling fluids and compressor oils are expected to be significant market segments. Leading companies such as BP, Chevron, ExxonMobil, and Shell dominate the market through extensive distribution networks and strong brand recognition. The forecast period (2025-2033) indicates sustained market growth, contingent on global economic stability and energy market dynamics. Regional variations in growth within North America (U.S., Canada, Mexico) will be influenced by local production and regulatory environments.
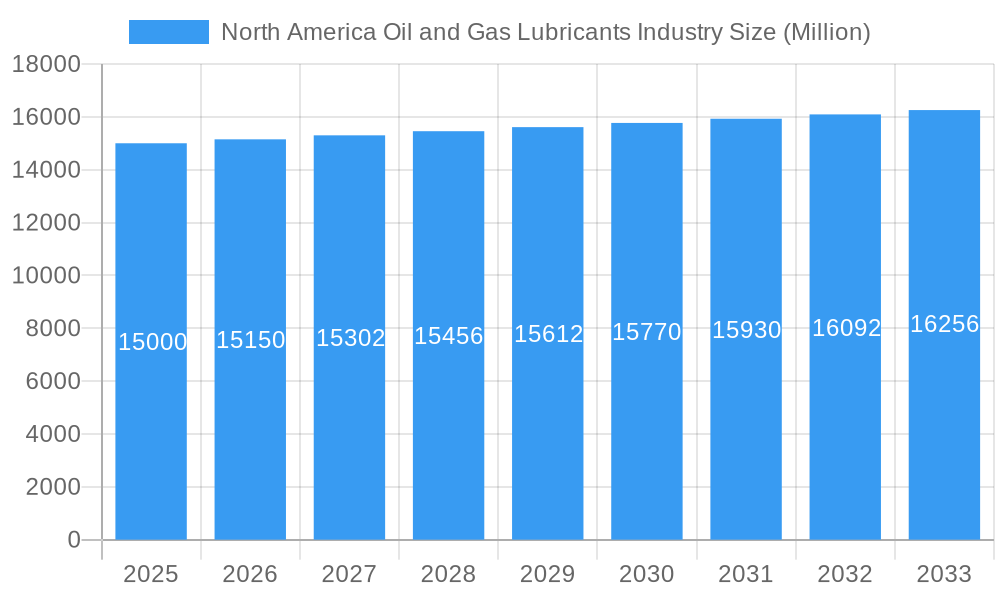
North America Oil and Gas Lubricants Industry Market Size (In Billion)
The competitive landscape features established multinational corporations and specialized lubricant manufacturers. Niche players often focus on specialized formulations, driving innovation and competition for improved lubricant technology and performance. Industry consolidation through mergers and acquisitions is a possibility, aimed at achieving economies of scale and market expansion. Future market expansion will depend on technological innovation, regulatory adherence, and the stability of the global energy sector. Continued investment in R&D to address environmental concerns will be vital for long-term market sustainability.
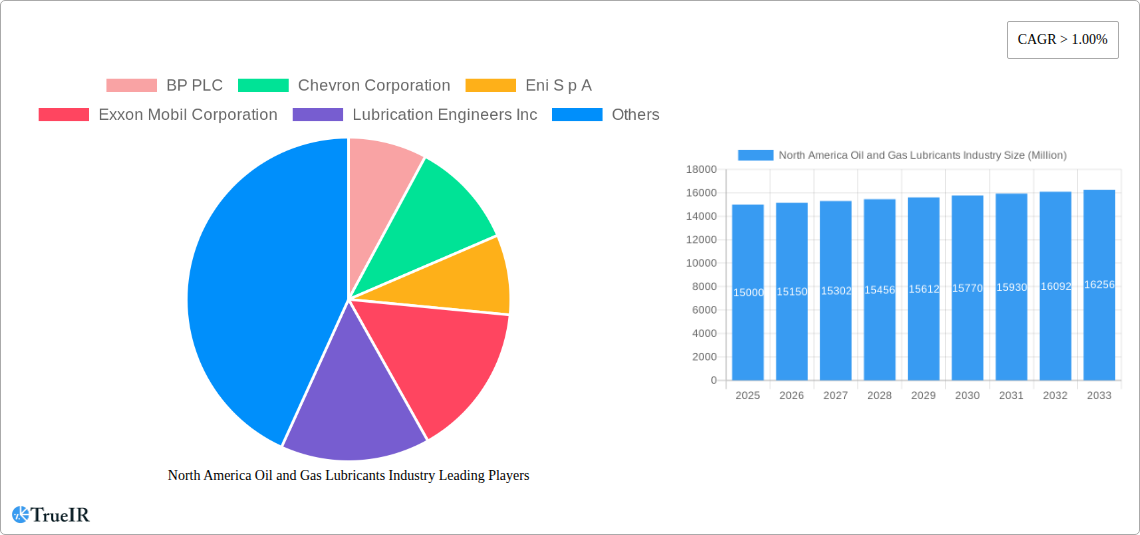
North America Oil and Gas Lubricants Industry Company Market Share
North America Oil and Gas Lubricants Industry: A Comprehensive Market Report (2019-2033)
This dynamic report provides a detailed analysis of the North America oil and gas lubricants industry, offering invaluable insights for investors, industry professionals, and strategic decision-makers. Leveraging extensive market research and data analysis across the historical period (2019-2024), base year (2025), and forecast period (2025-2033), this report unveils the key trends, challenges, and opportunities shaping this lucrative sector. The market size is projected to reach xx Million by 2033, exhibiting a significant CAGR of xx%.
North America Oil and Gas Lubricants Industry Market Structure & Competitive Landscape
The North American oil and gas lubricants market exhibits a moderately concentrated structure, with several major players dominating the landscape. Key factors shaping this competitive landscape include:
- Market Concentration: The Herfindahl-Hirschman Index (HHI) for the industry is estimated at xx, suggesting a moderately concentrated market. The top 5 players control approximately xx% of the market share.
- Innovation Drivers: Technological advancements, such as the development of bio-based lubricants and enhanced performance additives, are driving innovation and product differentiation. The increasing demand for eco-friendly and sustainable lubricants is pushing companies to invest in R&D.
- Regulatory Impacts: Stringent environmental regulations, such as emission standards, are influencing product formulations and manufacturing processes. Compliance costs are a significant factor for companies operating in this sector.
- Product Substitutes: The market faces competition from alternative lubrication technologies, such as synthetic oils and greases, as well as from specialized products catering to specific oil and gas applications.
- End-User Segmentation: The market is segmented by end-user, including upstream (exploration and production), midstream (transportation and storage), and downstream (refining and distribution) segments. The upstream sector is expected to show the highest growth rate during the forecast period.
- M&A Trends: The industry has witnessed a significant number of mergers and acquisitions (M&A) activities in recent years, driven by the need for expansion, consolidation, and technological advancement. The total value of M&A transactions in the period 2019-2024 reached approximately xx Million.
North America Oil and Gas Lubricants Industry Market Trends & Opportunities
The North American oil and gas lubricants market is poised for significant growth, driven by several key trends:
The market size is estimated at xx Million in 2025 and is projected to reach xx Million by 2033, representing a CAGR of xx%. This growth is fueled by the increasing demand for oil and gas, rising industrialization, and the adoption of advanced lubricant technologies. Technological advancements such as the development of bio-based lubricants and enhanced performance additives are also driving market growth. Consumer preferences are shifting towards environmentally friendly and sustainable products, creating opportunities for manufacturers to develop and market green lubricants. The competitive dynamics are marked by intense competition among major players and the emergence of new entrants focusing on niche applications. Market penetration rates for premium lubricants are increasing, suggesting a trend towards higher-quality and more specialized products. The rising demand for efficient and reliable lubrication solutions across various applications in the oil and gas sector is further driving market growth. Government regulations focusing on emission reduction are also pushing the development of environmentally friendly lubricants.
Dominant Markets & Segments in North America Oil and Gas Lubricants Industry
The United States dominates the North American oil and gas lubricants market, followed by Canada and Mexico.
- Key Growth Drivers in the US: Robust oil and gas production, extensive industrial infrastructure, and a high concentration of major lubricant manufacturers.
- Key Growth Drivers in Canada: Significant oil sands operations and a growing focus on sustainable energy initiatives.
- Key Growth Drivers in Mexico: Expanding oil and gas infrastructure development and increasing industrial activity.
The upstream segment is currently the largest market segment, driven by the high demand for lubricants in exploration and production activities. However, the downstream segment is expected to experience significant growth in the coming years, fueled by the expansion of refining and distribution networks.
North America Oil and Gas Lubricants Industry Product Analysis
Technological advancements are leading to the development of high-performance lubricants with enhanced properties like improved viscosity, thermal stability, and reduced friction. These innovations cater to the stringent requirements of modern oil and gas operations, offering superior protection and efficiency. The market is witnessing a growing adoption of synthetic lubricants, which offer superior performance compared to conventional mineral-based products. These specialized products target specific applications and address the needs of different end-users, ensuring optimal performance and minimizing operational disruptions.
Key Drivers, Barriers & Challenges in North America Oil and Gas Lubricants Industry
Key Drivers:
- Increasing demand for oil and gas globally.
- Technological advancements in lubricant formulations.
- Stringent emission regulations promoting environmentally friendly lubricants.
- Growth of the industrial sector.
Key Challenges:
- Fluctuations in crude oil prices affecting raw material costs.
- Environmental regulations and compliance costs.
- Intense competition among established and new players.
- Supply chain disruptions impacting the availability of raw materials and finished products. For example, the xx% increase in transportation costs in 2022 resulted in a xx% increase in lubricant prices.
Growth Drivers in the North America Oil and Gas Lubricants Industry Market
The market's growth is spurred by rising oil and gas production, expanding industrial activities, stringent environmental regulations necessitating high-performance and eco-friendly lubricants, and technological advancements leading to innovative, efficient lubrication solutions. Government initiatives to promote sustainable energy practices further bolster demand for specialized lubricants.
Challenges Impacting North America Oil and Gas Lubricants Industry Growth
Major challenges include fluctuating crude oil prices impacting raw material costs, intense competition leading to pricing pressures, stringent environmental regulations increasing compliance expenses, and potential supply chain disruptions influencing product availability and cost.
Key Players Shaping the North America Oil and Gas Lubricants Industry Market
Significant North America Oil and Gas Lubricants Industry Industry Milestones
- December 2022: Shell acquired Allied Reliability, expanding its North American lubricants business.
- August 2022: Valvoline Inc. sold its global products business (including lubricants) to Saudi Aramco for USD 2.65 Billion.
Future Outlook for North America Oil and Gas Lubricants Industry Market
The North American oil and gas lubricants market is projected to experience robust growth, driven by increasing demand, technological advancements, and a growing focus on sustainability. Strategic opportunities exist in developing innovative, environmentally friendly lubricants tailored to specific applications, leveraging digital technologies to enhance operational efficiency, and expanding into new geographical markets. The market's future potential is significant, presenting promising prospects for established players and emerging businesses alike.
North America Oil and Gas Lubricants Industry Segmentation
-
1. Location
- 1.1. Onshore
- 1.2. Offshore
-
2. Product Type
- 2.1. Grease
- 2.2. Coolant/Anti-freezer
- 2.3. Engine Oils
- 2.4. Hydraulic Fluids
- 2.5. Other Product Types
-
3. Sector
- 3.1. Upstream
- 3.2. Midstream
- 3.3. Downstream
-
4. Geography
- 4.1. United States
- 4.2. Canada
- 4.3. Mexico
North America Oil and Gas Lubricants Industry Segmentation By Geography
- 1. United States
- 2. Canada
- 3. Mexico
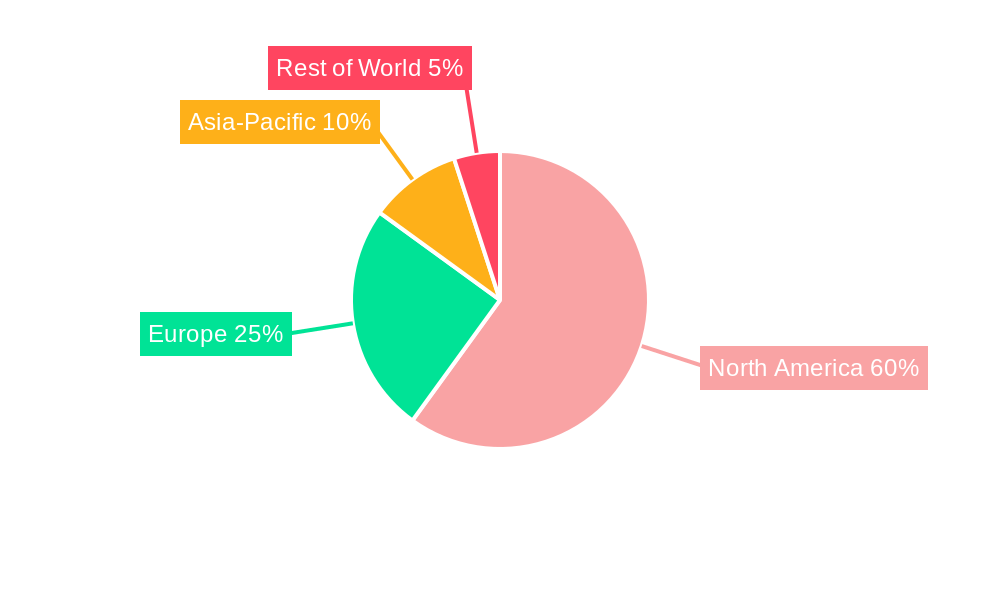
North America Oil and Gas Lubricants Industry Regional Market Share
Geographic Coverage of North America Oil and Gas Lubricants Industry
North America Oil and Gas Lubricants Industry REPORT HIGHLIGHTS
| Aspects | Details |
|---|---|
| Study Period | 2020-2034 |
| Base Year | 2025 |
| Estimated Year | 2026 |
| Forecast Period | 2026-2034 |
| Historical Period | 2020-2025 |
| Growth Rate | CAGR of 3.7% from 2020-2034 |
| Segmentation |
|
Table of Contents
- 1. Introduction
- 1.1. Research Scope
- 1.2. Market Segmentation
- 1.3. Research Objective
- 1.4. Definitions and Assumptions
- 2. Executive Summary
- 2.1. Market Snapshot
- 3. Market Dynamics
- 3.1. Market Drivers
- 3.2. Market Restrains
- 3.3. Market Trends
- 3.4. Market Opportunities
- 4. Market Factor Analysis
- 4.1. Porters Five Forces
- 4.1.1. Bargaining Power of Suppliers
- 4.1.2. Bargaining Power of Buyers
- 4.1.3. Threat of New Entrants
- 4.1.4. Threat of Substitutes
- 4.1.5. Competitive Rivalry
- 4.2. PESTEL analysis
- 4.3. BCG Analysis
- 4.3.1. Stars (High Growth, High Market Share)
- 4.3.2. Cash Cows (Low Growth, High Market Share)
- 4.3.3. Question Mark (High Growth, Low Market Share)
- 4.3.4. Dogs (Low Growth, Low Market Share)
- 4.4. Ansoff Matrix Analysis
- 4.5. Supply Chain Analysis
- 4.6. Regulatory Landscape
- 4.7. Current Market Potential and Opportunity Assessment (TAM–SAM–SOM Framework)
- 4.8. TIR Analyst Note
- 4.1. Porters Five Forces
- 5. Market Analysis, Insights and Forecast 2021-2033
- 5.1. Market Analysis, Insights and Forecast - by Location
- 5.1.1. Onshore
- 5.1.2. Offshore
- 5.2. Market Analysis, Insights and Forecast - by Product Type
- 5.2.1. Grease
- 5.2.2. Coolant/Anti-freezer
- 5.2.3. Engine Oils
- 5.2.4. Hydraulic Fluids
- 5.2.5. Other Product Types
- 5.3. Market Analysis, Insights and Forecast - by Sector
- 5.3.1. Upstream
- 5.3.2. Midstream
- 5.3.3. Downstream
- 5.4. Market Analysis, Insights and Forecast - by Geography
- 5.4.1. United States
- 5.4.2. Canada
- 5.4.3. Mexico
- 5.5. Market Analysis, Insights and Forecast - by Region
- 5.5.1. United States
- 5.5.2. Canada
- 5.5.3. Mexico
- 5.1. Market Analysis, Insights and Forecast - by Location
- 6. Global North America Oil and Gas Lubricants Industry Analysis, Insights and Forecast, 2021-2033
- 6.1. Market Analysis, Insights and Forecast - by Location
- 6.1.1. Onshore
- 6.1.2. Offshore
- 6.2. Market Analysis, Insights and Forecast - by Product Type
- 6.2.1. Grease
- 6.2.2. Coolant/Anti-freezer
- 6.2.3. Engine Oils
- 6.2.4. Hydraulic Fluids
- 6.2.5. Other Product Types
- 6.3. Market Analysis, Insights and Forecast - by Sector
- 6.3.1. Upstream
- 6.3.2. Midstream
- 6.3.3. Downstream
- 6.4. Market Analysis, Insights and Forecast - by Geography
- 6.4.1. United States
- 6.4.2. Canada
- 6.4.3. Mexico
- 6.1. Market Analysis, Insights and Forecast - by Location
- 7. United States North America Oil and Gas Lubricants Industry Analysis, Insights and Forecast, 2020-2032
- 7.1. Market Analysis, Insights and Forecast - by Location
- 7.1.1. Onshore
- 7.1.2. Offshore
- 7.2. Market Analysis, Insights and Forecast - by Product Type
- 7.2.1. Grease
- 7.2.2. Coolant/Anti-freezer
- 7.2.3. Engine Oils
- 7.2.4. Hydraulic Fluids
- 7.2.5. Other Product Types
- 7.3. Market Analysis, Insights and Forecast - by Sector
- 7.3.1. Upstream
- 7.3.2. Midstream
- 7.3.3. Downstream
- 7.4. Market Analysis, Insights and Forecast - by Geography
- 7.4.1. United States
- 7.4.2. Canada
- 7.4.3. Mexico
- 7.1. Market Analysis, Insights and Forecast - by Location
- 8. Canada North America Oil and Gas Lubricants Industry Analysis, Insights and Forecast, 2020-2032
- 8.1. Market Analysis, Insights and Forecast - by Location
- 8.1.1. Onshore
- 8.1.2. Offshore
- 8.2. Market Analysis, Insights and Forecast - by Product Type
- 8.2.1. Grease
- 8.2.2. Coolant/Anti-freezer
- 8.2.3. Engine Oils
- 8.2.4. Hydraulic Fluids
- 8.2.5. Other Product Types
- 8.3. Market Analysis, Insights and Forecast - by Sector
- 8.3.1. Upstream
- 8.3.2. Midstream
- 8.3.3. Downstream
- 8.4. Market Analysis, Insights and Forecast - by Geography
- 8.4.1. United States
- 8.4.2. Canada
- 8.4.3. Mexico
- 8.1. Market Analysis, Insights and Forecast - by Location
- 9. Mexico North America Oil and Gas Lubricants Industry Analysis, Insights and Forecast, 2020-2032
- 9.1. Market Analysis, Insights and Forecast - by Location
- 9.1.1. Onshore
- 9.1.2. Offshore
- 9.2. Market Analysis, Insights and Forecast - by Product Type
- 9.2.1. Grease
- 9.2.2. Coolant/Anti-freezer
- 9.2.3. Engine Oils
- 9.2.4. Hydraulic Fluids
- 9.2.5. Other Product Types
- 9.3. Market Analysis, Insights and Forecast - by Sector
- 9.3.1. Upstream
- 9.3.2. Midstream
- 9.3.3. Downstream
- 9.4. Market Analysis, Insights and Forecast - by Geography
- 9.4.1. United States
- 9.4.2. Canada
- 9.4.3. Mexico
- 9.1. Market Analysis, Insights and Forecast - by Location
- 10. Competitive Analysis
- 10.1. Company Profiles
- 10.1.1 BP PLC
- 10.1.1.1. Company Overview
- 10.1.1.2. Products
- 10.1.1.3. Company Financials
- 10.1.1.4. SWOT Analysis
- 10.1.2 Chevron Corporation
- 10.1.2.1. Company Overview
- 10.1.2.2. Products
- 10.1.2.3. Company Financials
- 10.1.2.4. SWOT Analysis
- 10.1.3 Eni S p A
- 10.1.3.1. Company Overview
- 10.1.3.2. Products
- 10.1.3.3. Company Financials
- 10.1.3.4. SWOT Analysis
- 10.1.4 Exxon Mobil Corporation
- 10.1.4.1. Company Overview
- 10.1.4.2. Products
- 10.1.4.3. Company Financials
- 10.1.4.4. SWOT Analysis
- 10.1.5 Lubrication Engineers Inc
- 10.1.5.1. Company Overview
- 10.1.5.2. Products
- 10.1.5.3. Company Financials
- 10.1.5.4. SWOT Analysis
- 10.1.6 LUKOIL
- 10.1.6.1. Company Overview
- 10.1.6.2. Products
- 10.1.6.3. Company Financials
- 10.1.6.4. SWOT Analysis
- 10.1.7 Petro-Canada Lubricants Inc
- 10.1.7.1. Company Overview
- 10.1.7.2. Products
- 10.1.7.3. Company Financials
- 10.1.7.4. SWOT Analysis
- 10.1.8 Shell PLC
- 10.1.8.1. Company Overview
- 10.1.8.2. Products
- 10.1.8.3. Company Financials
- 10.1.8.4. SWOT Analysis
- 10.1.9 Schlumberger Limited
- 10.1.9.1. Company Overview
- 10.1.9.2. Products
- 10.1.9.3. Company Financials
- 10.1.9.4. SWOT Analysis
- 10.1.10 SKF
- 10.1.10.1. Company Overview
- 10.1.10.2. Products
- 10.1.10.3. Company Financials
- 10.1.10.4. SWOT Analysis
- 10.1.11 TotalEnergies SE
- 10.1.11.1. Company Overview
- 10.1.11.2. Products
- 10.1.11.3. Company Financials
- 10.1.11.4. SWOT Analysis
- 10.1.12 Valvoline Inc *List Not Exhaustive
- 10.1.12.1. Company Overview
- 10.1.12.2. Products
- 10.1.12.3. Company Financials
- 10.1.12.4. SWOT Analysis
- 10.1.1 BP PLC
- 10.2. Market Entropy
- 10.2.1 Company's Key Areas Served
- 10.2.2 Recent Developments
- 10.3. Company Market Share Analysis 2025
- 10.3.1 Top 5 Companies Market Share Analysis
- 10.3.2 Top 3 Companies Market Share Analysis
- 10.4. List of Potential Customers
- 11. Research Methodology
List of Figures
- Figure 1: Global North America Oil and Gas Lubricants Industry Revenue Breakdown (million, %) by Region 2025 & 2033
- Figure 2: United States North America Oil and Gas Lubricants Industry Revenue (million), by Location 2025 & 2033
- Figure 3: United States North America Oil and Gas Lubricants Industry Revenue Share (%), by Location 2025 & 2033
- Figure 4: United States North America Oil and Gas Lubricants Industry Revenue (million), by Product Type 2025 & 2033
- Figure 5: United States North America Oil and Gas Lubricants Industry Revenue Share (%), by Product Type 2025 & 2033
- Figure 6: United States North America Oil and Gas Lubricants Industry Revenue (million), by Sector 2025 & 2033
- Figure 7: United States North America Oil and Gas Lubricants Industry Revenue Share (%), by Sector 2025 & 2033
- Figure 8: United States North America Oil and Gas Lubricants Industry Revenue (million), by Geography 2025 & 2033
- Figure 9: United States North America Oil and Gas Lubricants Industry Revenue Share (%), by Geography 2025 & 2033
- Figure 10: United States North America Oil and Gas Lubricants Industry Revenue (million), by Country 2025 & 2033
- Figure 11: United States North America Oil and Gas Lubricants Industry Revenue Share (%), by Country 2025 & 2033
- Figure 12: Canada North America Oil and Gas Lubricants Industry Revenue (million), by Location 2025 & 2033
- Figure 13: Canada North America Oil and Gas Lubricants Industry Revenue Share (%), by Location 2025 & 2033
- Figure 14: Canada North America Oil and Gas Lubricants Industry Revenue (million), by Product Type 2025 & 2033
- Figure 15: Canada North America Oil and Gas Lubricants Industry Revenue Share (%), by Product Type 2025 & 2033
- Figure 16: Canada North America Oil and Gas Lubricants Industry Revenue (million), by Sector 2025 & 2033
- Figure 17: Canada North America Oil and Gas Lubricants Industry Revenue Share (%), by Sector 2025 & 2033
- Figure 18: Canada North America Oil and Gas Lubricants Industry Revenue (million), by Geography 2025 & 2033
- Figure 19: Canada North America Oil and Gas Lubricants Industry Revenue Share (%), by Geography 2025 & 2033
- Figure 20: Canada North America Oil and Gas Lubricants Industry Revenue (million), by Country 2025 & 2033
- Figure 21: Canada North America Oil and Gas Lubricants Industry Revenue Share (%), by Country 2025 & 2033
- Figure 22: Mexico North America Oil and Gas Lubricants Industry Revenue (million), by Location 2025 & 2033
- Figure 23: Mexico North America Oil and Gas Lubricants Industry Revenue Share (%), by Location 2025 & 2033
- Figure 24: Mexico North America Oil and Gas Lubricants Industry Revenue (million), by Product Type 2025 & 2033
- Figure 25: Mexico North America Oil and Gas Lubricants Industry Revenue Share (%), by Product Type 2025 & 2033
- Figure 26: Mexico North America Oil and Gas Lubricants Industry Revenue (million), by Sector 2025 & 2033
- Figure 27: Mexico North America Oil and Gas Lubricants Industry Revenue Share (%), by Sector 2025 & 2033
- Figure 28: Mexico North America Oil and Gas Lubricants Industry Revenue (million), by Geography 2025 & 2033
- Figure 29: Mexico North America Oil and Gas Lubricants Industry Revenue Share (%), by Geography 2025 & 2033
- Figure 30: Mexico North America Oil and Gas Lubricants Industry Revenue (million), by Country 2025 & 2033
- Figure 31: Mexico North America Oil and Gas Lubricants Industry Revenue Share (%), by Country 2025 & 2033
List of Tables
- Table 1: Global North America Oil and Gas Lubricants Industry Revenue million Forecast, by Location 2020 & 2033
- Table 2: Global North America Oil and Gas Lubricants Industry Revenue million Forecast, by Product Type 2020 & 2033
- Table 3: Global North America Oil and Gas Lubricants Industry Revenue million Forecast, by Sector 2020 & 2033
- Table 4: Global North America Oil and Gas Lubricants Industry Revenue million Forecast, by Geography 2020 & 2033
- Table 5: Global North America Oil and Gas Lubricants Industry Revenue million Forecast, by Region 2020 & 2033
- Table 6: Global North America Oil and Gas Lubricants Industry Revenue million Forecast, by Location 2020 & 2033
- Table 7: Global North America Oil and Gas Lubricants Industry Revenue million Forecast, by Product Type 2020 & 2033
- Table 8: Global North America Oil and Gas Lubricants Industry Revenue million Forecast, by Sector 2020 & 2033
- Table 9: Global North America Oil and Gas Lubricants Industry Revenue million Forecast, by Geography 2020 & 2033
- Table 10: Global North America Oil and Gas Lubricants Industry Revenue million Forecast, by Country 2020 & 2033
- Table 11: Global North America Oil and Gas Lubricants Industry Revenue million Forecast, by Location 2020 & 2033
- Table 12: Global North America Oil and Gas Lubricants Industry Revenue million Forecast, by Product Type 2020 & 2033
- Table 13: Global North America Oil and Gas Lubricants Industry Revenue million Forecast, by Sector 2020 & 2033
- Table 14: Global North America Oil and Gas Lubricants Industry Revenue million Forecast, by Geography 2020 & 2033
- Table 15: Global North America Oil and Gas Lubricants Industry Revenue million Forecast, by Country 2020 & 2033
- Table 16: Global North America Oil and Gas Lubricants Industry Revenue million Forecast, by Location 2020 & 2033
- Table 17: Global North America Oil and Gas Lubricants Industry Revenue million Forecast, by Product Type 2020 & 2033
- Table 18: Global North America Oil and Gas Lubricants Industry Revenue million Forecast, by Sector 2020 & 2033
- Table 19: Global North America Oil and Gas Lubricants Industry Revenue million Forecast, by Geography 2020 & 2033
- Table 20: Global North America Oil and Gas Lubricants Industry Revenue million Forecast, by Country 2020 & 2033
Frequently Asked Questions
1. What is the projected Compound Annual Growth Rate (CAGR) of the North America Oil and Gas Lubricants Industry?
The projected CAGR is approximately 3.7%.
2. Which companies are prominent players in the North America Oil and Gas Lubricants Industry?
Key companies in the market include BP PLC, Chevron Corporation, Eni S p A, Exxon Mobil Corporation, Lubrication Engineers Inc, LUKOIL, Petro-Canada Lubricants Inc, Shell PLC, Schlumberger Limited, SKF, TotalEnergies SE, Valvoline Inc *List Not Exhaustive.
3. What are the main segments of the North America Oil and Gas Lubricants Industry?
The market segments include Location, Product Type, Sector, Geography.
4. Can you provide details about the market size?
The market size is estimated to be USD 186.1 million as of 2022.
5. What are some drivers contributing to market growth?
Growing Interest towards Unconventional Reserves; Technological Advancement Leading to Higher Well Production Rates.
6. What are the notable trends driving market growth?
Offshore Exploration is Expected to Experience the Highest Growth.
7. Are there any restraints impacting market growth?
Growing Interest towards Unconventional Reserves; Technological Advancement Leading to Higher Well Production Rates.
8. Can you provide examples of recent developments in the market?
In December 2022, Shell acquired Allied Reliability, expanding its North American lubricants business. This is in line with its global lubricants strategy of expanding its premium product offering and presence in the industrial sector and providing complementary services to provide a strong value proposition to its customers.
9. What pricing options are available for accessing the report?
Pricing options include single-user, multi-user, and enterprise licenses priced at USD 4750, USD 5250, and USD 8750 respectively.
10. Is the market size provided in terms of value or volume?
The market size is provided in terms of value, measured in million.
11. Are there any specific market keywords associated with the report?
Yes, the market keyword associated with the report is "North America Oil and Gas Lubricants Industry," which aids in identifying and referencing the specific market segment covered.
12. How do I determine which pricing option suits my needs best?
The pricing options vary based on user requirements and access needs. Individual users may opt for single-user licenses, while businesses requiring broader access may choose multi-user or enterprise licenses for cost-effective access to the report.
13. Are there any additional resources or data provided in the North America Oil and Gas Lubricants Industry report?
While the report offers comprehensive insights, it's advisable to review the specific contents or supplementary materials provided to ascertain if additional resources or data are available.
14. How can I stay updated on further developments or reports in the North America Oil and Gas Lubricants Industry?
To stay informed about further developments, trends, and reports in the North America Oil and Gas Lubricants Industry, consider subscribing to industry newsletters, following relevant companies and organizations, or regularly checking reputable industry news sources and publications.
Methodology
Step 1 - Identification of Relevant Samples Size from Population Database


Step 2 - Approaches for Defining Global Market Size (Value, Volume* & Price*)

Note*: In applicable scenarios
Step 3 - Data Sources
Primary Research
- Web Analytics
- Survey Reports
- Research Institute
- Latest Research Reports
- Opinion Leaders
Secondary Research
- Annual Reports
- White Paper
- Latest Press Release
- Industry Association
- Paid Database
- Investor Presentations

Step 4 - Data Triangulation
Involves using different sources of information in order to increase the validity of a study
These sources are likely to be stakeholders in a program - participants, other researchers, program staff, other community members, and so on.
Then we put all data in single framework & apply various statistical tools to find out the dynamic on the market.
During the analysis stage, feedback from the stakeholder groups would be compared to determine areas of agreement as well as areas of divergence