

Key Insights
The Asia-Pacific (APAC) small cell tower market is experiencing robust growth, driven by the surging demand for enhanced mobile broadband capacity and the proliferation of 5G networks. The region's large and rapidly expanding population, coupled with increasing smartphone penetration and data consumption, are key factors fueling this expansion. The market is segmented primarily by component (hardware and software), with hardware comprising a larger share due to the significant infrastructure investment required for deploying small cell networks. Major players like Ericsson, Nokia, Huawei, and Samsung are actively competing in this space, offering a range of solutions tailored to the diverse needs of telecom operators and enterprises. While challenges such as regulatory hurdles and the high initial investment costs exist, the long-term benefits of improved network coverage and performance outweigh these constraints. We project sustained growth throughout the forecast period (2025-2033), with a particular focus on high-density urban areas and rural regions lacking sufficient network infrastructure. The integration of small cells with other network technologies, such as fiber optics and cloud computing, is further expected to accelerate market expansion.
The strategic adoption of small cell technologies by telecom operators to improve network coverage and capacity, especially in densely populated urban areas, is a major growth driver. Furthermore, the increasing adoption of IoT devices and the demand for low latency connectivity are creating new opportunities within the market. Government initiatives promoting digitalization and infrastructure development across several APAC nations are also contributing positively. Despite the competitive landscape, the market exhibits strong potential for consolidation, with larger players likely acquiring smaller companies to gain market share and expand their technological capabilities. The focus will increasingly shift towards software-defined networking (SDN) and network function virtualization (NFV) to enhance network flexibility and efficiency. The APAC region’s diverse regulatory environments will continue to shape the market's competitive dynamics, demanding a nuanced approach from vendors in terms of compliance and localization efforts.
This comprehensive report delivers an in-depth analysis of the Asia-Pacific (APAC) small cell tower industry, providing crucial insights for investors, businesses, and policymakers. Covering the period 2019-2033, with a focus on 2025, this report forecasts significant market expansion driven by technological advancements and increasing demand for enhanced network coverage. The report features detailed analysis of market structure, competitive dynamics, key players, and future growth opportunities.
APAC Small Cell Tower Industry Market Structure & Competitive Landscape
The APAC small cell tower market exhibits a moderately concentrated structure, with several major players holding significant market share. The Herfindahl-Hirschman Index (HHI) is estimated at xx in 2025, indicating a moderately competitive environment. Innovation drives intense competition, particularly in 5G technology integration. Favorable government regulations promoting network infrastructure development are positively impacting market growth. The presence of substitute technologies like Wi-Fi is a factor, but the demand for high-bandwidth, low-latency connections continues to drive the growth of small cell towers. The market is segmented by end-user, including telecommunication companies, private enterprises, and government organizations. M&A activity has been moderate in recent years, with an estimated xx Million USD worth of deals recorded between 2019 and 2024. Future M&A activity is predicted to increase with the expansion of 5G networks and privatization efforts in some markets.
- Market Concentration: Moderately concentrated, HHI estimated at xx in 2025.
- Innovation Drivers: 5G technology deployment, advancements in software-defined networking (SDN).
- Regulatory Impacts: Positive influence through supportive government policies and spectrum allocation.
- Product Substitutes: Wi-Fi, but demand for high-bandwidth connectivity remains strong.
- End-User Segmentation: Telecommunication companies, private enterprises, government organizations.
- M&A Trends: Moderate activity (xx Million USD, 2019-2024), expected to rise.
APAC Small Cell Tower Industry Market Trends & Opportunities
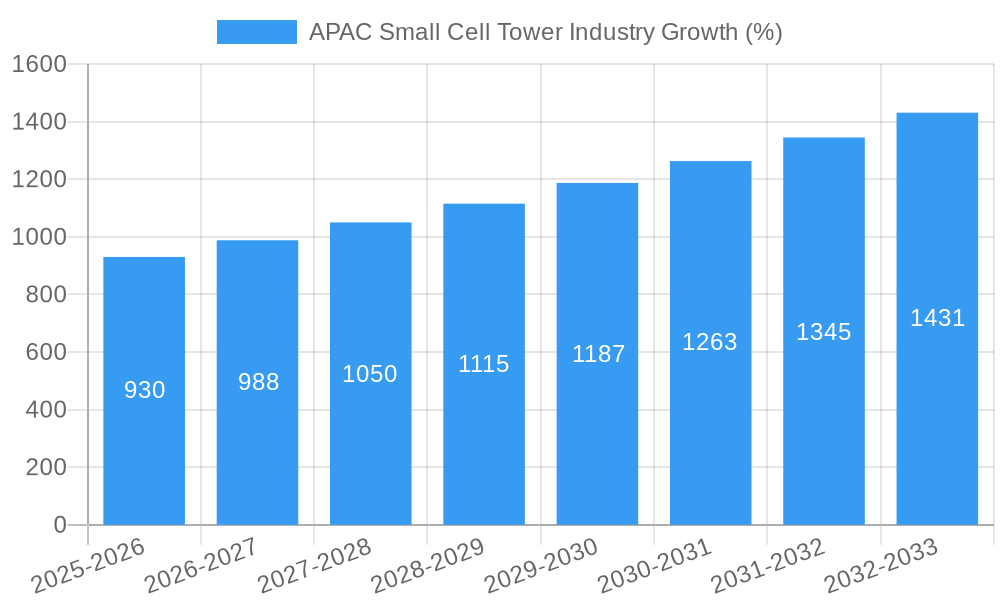
The APAC small cell tower market is experiencing substantial growth, projected to reach xx Million USD by 2033, exhibiting a Compound Annual Growth Rate (CAGR) of xx% during the forecast period (2025-2033). This growth is fueled by the rapid expansion of 5G networks, increasing smartphone penetration, and the surging demand for high-speed internet access across diverse sectors. The shift towards software-defined networking (SDN) and virtualized RAN (vRAN) technologies is reshaping the competitive landscape. Consumer preference for seamless connectivity is a key driver, especially in densely populated urban areas and remote locations. Competitive dynamics are characterized by continuous innovation and strategic partnerships among key players to capture market share. Market penetration is gradually increasing across various regions in APAC, with a considerable impact on the development of smart cities and the growth of the Internet of Things (IoT).
Dominant Markets & Segments in APAC Small Cell Tower Industry
Within the APAC region, China and India are currently dominant markets, collectively accounting for xx% of the total market revenue in 2025. The hardware segment significantly surpasses the software segment in market share, primarily due to higher initial investments required in infrastructure.
Key Growth Drivers:
- Robust Infrastructure Development: Extensive investments in telecom infrastructure across APAC.
- Government Policies: Supportive regulatory frameworks encouraging 5G deployment and digital transformation.
- Technological Advancements: Adoption of advanced technologies like SDN, vRAN and Open RAN.
Market Dominance Analysis:
China and India’s dominance stems from their large populations, burgeoning digital economies, and substantial investments in telecommunications infrastructure. The substantial increase in 5G network rollout in these countries coupled with ongoing government initiatives is driving both hardware and software demand. While other countries contribute significantly to the overall market size, the growth potential of these two economies remains particularly notable.
APAC Small Cell Tower Industry Product Analysis
The small cell tower market is characterized by ongoing product innovation focusing on miniaturization, improved energy efficiency, and seamless integration with 5G networks. Advancements in software-defined networking (SDN) and virtualized RAN (vRAN) architectures are allowing for more flexible, adaptable, and cost-effective network deployments. These advancements enhance network capacity and improve overall network performance, while simultaneously offering competitive advantages through superior scalability and efficient resource management. Products are designed to meet diverse application requirements, including coverage extension, capacity augmentation, and improved indoor performance.
Key Drivers, Barriers & Challenges in APAC Small Cell Tower Industry
Key Drivers:
- 5G Network Rollout: The widespread adoption of 5G across APAC is a major driver.
- Increased Smartphone Penetration: The rising number of smartphone users fuels the demand for higher bandwidth.
- Government Initiatives: Supportive policies and regulatory frameworks foster market growth.
Key Challenges & Restraints:
- Supply Chain Disruptions: Global supply chain challenges impact component availability and costs. (estimated impact of xx% on market growth in 2024)
- Regulatory Hurdles: Complex regulatory environments in some APAC countries can hinder deployment.
- High Initial Investment Costs: The significant upfront investment needed for small cell deployments can deter smaller players.
Growth Drivers in the APAC Small Cell Tower Industry Market
The key drivers for growth in the APAC small cell tower industry include the expanding 5G network infrastructure, the increasing demand for high-speed internet, and the supportive regulatory environment promoting digital transformation across the region. Technological advancements like SDN and vRAN are further boosting efficiency and reducing deployment costs, stimulating growth in both the hardware and software segments. The rapid adoption of IoT devices and the development of smart city initiatives also contribute significantly to the growing demand for improved network coverage and capacity.
Challenges Impacting APAC Small Cell Tower Industry Growth
Challenges include navigating complex regulatory landscapes across diverse APAC markets, managing supply chain risks that impact component availability and costs, and facing intense competition among established players and emerging technology providers. Furthermore, the high initial investment costs for deploying small cell networks can be a barrier to market entry for smaller companies. These factors, coupled with the need to secure appropriate spectrum licenses, can potentially impede overall market growth.
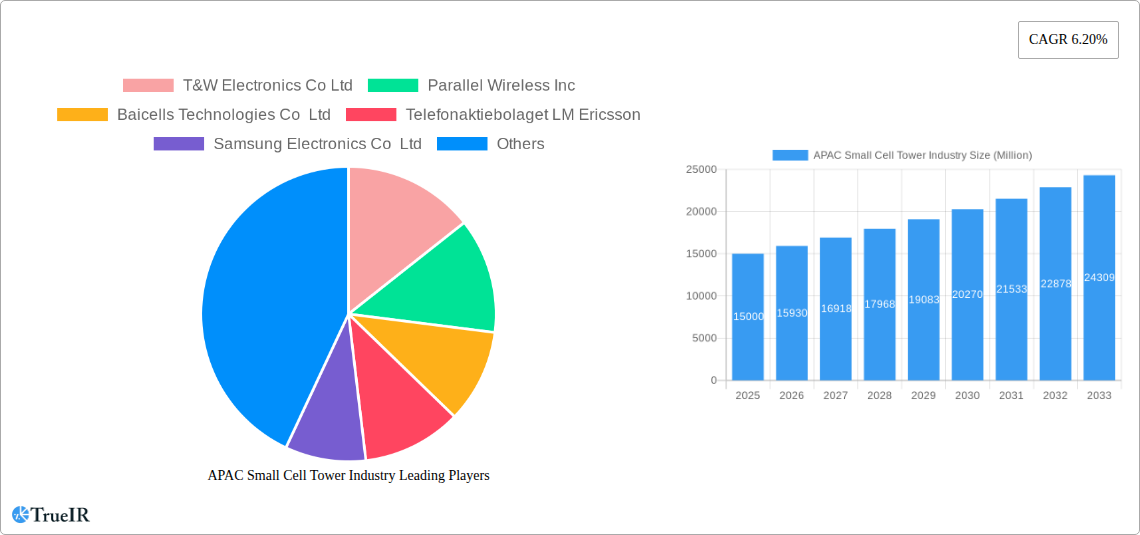
Key Players Shaping the APAC Small Cell Tower Industry Market
- T&W Electronics Co Ltd
- Parallel Wireless Inc
- Baicells Technologies Co Ltd
- Telefonaktiebolaget LM Ericsson
- Samsung Electronics Co Ltd
- Nokia Corporation
- NEC Corporation
- Huawei Technologies Co Ltd
- ZTE Corporation
- Airspan Networks Inc
Significant APAC Small Cell Tower Industry Industry Milestones
- November 2022: Airspan Networks Inc announced the commercial availability of new 5G indoor and outdoor products based on a flexible All-In-One (AIO) software platform, upgradeable to a completely disaggregated vRAN and Open RAN architecture. This signifies a shift towards more flexible and adaptable network solutions.
- January 2023: Telefonaktiebolaget LM Ericsson announced the expansion of its Private Network portfolio with NetCloud Private Networks, a software-defined solution targeting businesses in various sectors. This highlights the growing demand for private 5G networks.
Future Outlook for APAC Small Cell Tower Industry Market
The APAC small cell tower market is poised for continued robust growth, driven by persistent technological advancements, increasing demand for higher bandwidth connectivity, and supportive government policies. Strategic opportunities exist for companies to focus on innovative solutions addressing specific market needs, such as private 5G networks and IoT deployments. The market's potential is significant, particularly with the expansion of 5G networks across diverse sectors, ultimately leading to enhanced connectivity and digital transformation across the region.
APAC Small Cell Tower Industry Segmentation
- 1. Production Analysis
- 2. Consumption Analysis
- 3. Import Market Analysis (Value & Volume)
- 4. Export Market Analysis (Value & Volume)
- 5. Price Trend Analysis
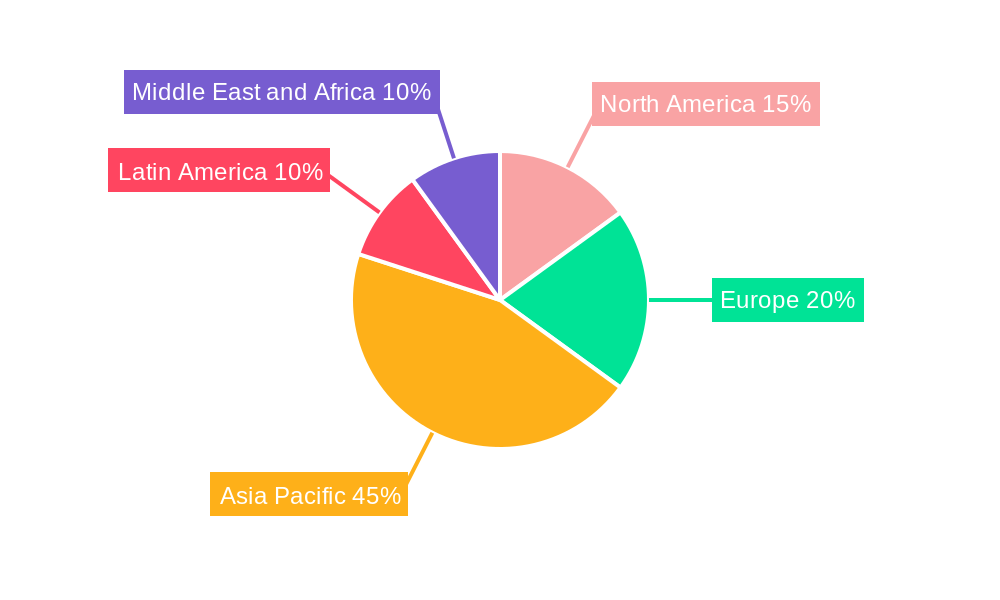
APAC Small Cell Tower Industry Segmentation By Geography
-
1. North America
- 1.1. United States
- 1.2. Canada
- 1.3. Mexico
-
2. South America
- 2.1. Brazil
- 2.2. Argentina
- 2.3. Rest of South America
-
3. Europe
- 3.1. United Kingdom
- 3.2. Germany
- 3.3. France
- 3.4. Italy
- 3.5. Spain
- 3.6. Russia
- 3.7. Benelux
- 3.8. Nordics
- 3.9. Rest of Europe
-
4. Middle East & Africa
- 4.1. Turkey
- 4.2. Israel
- 4.3. GCC
- 4.4. North Africa
- 4.5. South Africa
- 4.6. Rest of Middle East & Africa
-
5. Asia Pacific
- 5.1. China
- 5.2. India
- 5.3. Japan
- 5.4. South Korea
- 5.5. ASEAN
- 5.6. Oceania
- 5.7. Rest of Asia Pacific
APAC Small Cell Tower Industry REPORT HIGHLIGHTS
| Aspects | Details |
|---|---|
| Study Period | 2019-2033 |
| Base Year | 2024 |
| Estimated Year | 2025 |
| Forecast Period | 2025-2033 |
| Historical Period | 2019-2024 |
| Growth Rate | CAGR of 6.20% from 2019-2033 |
| Segmentation |
|
Table of Contents
- 1. Introduction
- 1.1. Research Scope
- 1.2. Market Segmentation
- 1.3. Research Methodology
- 1.4. Definitions and Assumptions
- 2. Executive Summary
- 2.1. Introduction
- 3. Market Dynamics
- 3.1. Introduction
- 3.2. Market Drivers
- 3.2.1. Rapid Increase in Mobile Data Traffic in the Region; Growing Emphasis on Operational Efficiency and Reduction of Capital Expenditure through Replacement of Older Networks with Small Cell Towers; Steady Growth in Installations by Market Incumbents in Mature Markets such as China and South Korea
- 3.3. Market Restrains
- 3.3.1. Various Regulations and Policies Coupled with Storage Issues
- 3.4. Market Trends
- 3.4.1. Indoor applications are Expected to Have a Major Market Share.
- 4. Market Factor Analysis
- 4.1. Porters Five Forces
- 4.2. Supply/Value Chain
- 4.3. PESTEL analysis
- 4.4. Market Entropy
- 4.5. Patent/Trademark Analysis
- 5. Global APAC Small Cell Tower Industry Analysis, Insights and Forecast, 2019-2031
- 5.1. Market Analysis, Insights and Forecast - by Production Analysis
- 5.2. Market Analysis, Insights and Forecast - by Consumption Analysis
- 5.3. Market Analysis, Insights and Forecast - by Import Market Analysis (Value & Volume)
- 5.4. Market Analysis, Insights and Forecast - by Export Market Analysis (Value & Volume)
- 5.5. Market Analysis, Insights and Forecast - by Price Trend Analysis
- 5.6. Market Analysis, Insights and Forecast - by Region
- 5.6.1. North America
- 5.6.2. South America
- 5.6.3. Europe
- 5.6.4. Middle East & Africa
- 5.6.5. Asia Pacific
- 5.1. Market Analysis, Insights and Forecast - by Production Analysis
- 6. North America APAC Small Cell Tower Industry Analysis, Insights and Forecast, 2019-2031
- 6.1. Market Analysis, Insights and Forecast - by Production Analysis
- 6.2. Market Analysis, Insights and Forecast - by Consumption Analysis
- 6.3. Market Analysis, Insights and Forecast - by Import Market Analysis (Value & Volume)
- 6.4. Market Analysis, Insights and Forecast - by Export Market Analysis (Value & Volume)
- 6.5. Market Analysis, Insights and Forecast - by Price Trend Analysis
- 6.1. Market Analysis, Insights and Forecast - by Production Analysis
- 7. South America APAC Small Cell Tower Industry Analysis, Insights and Forecast, 2019-2031
- 7.1. Market Analysis, Insights and Forecast - by Production Analysis
- 7.2. Market Analysis, Insights and Forecast - by Consumption Analysis
- 7.3. Market Analysis, Insights and Forecast - by Import Market Analysis (Value & Volume)
- 7.4. Market Analysis, Insights and Forecast - by Export Market Analysis (Value & Volume)
- 7.5. Market Analysis, Insights and Forecast - by Price Trend Analysis
- 7.1. Market Analysis, Insights and Forecast - by Production Analysis
- 8. Europe APAC Small Cell Tower Industry Analysis, Insights and Forecast, 2019-2031
- 8.1. Market Analysis, Insights and Forecast - by Production Analysis
- 8.2. Market Analysis, Insights and Forecast - by Consumption Analysis
- 8.3. Market Analysis, Insights and Forecast - by Import Market Analysis (Value & Volume)
- 8.4. Market Analysis, Insights and Forecast - by Export Market Analysis (Value & Volume)
- 8.5. Market Analysis, Insights and Forecast - by Price Trend Analysis
- 8.1. Market Analysis, Insights and Forecast - by Production Analysis
- 9. Middle East & Africa APAC Small Cell Tower Industry Analysis, Insights and Forecast, 2019-2031
- 9.1. Market Analysis, Insights and Forecast - by Production Analysis
- 9.2. Market Analysis, Insights and Forecast - by Consumption Analysis
- 9.3. Market Analysis, Insights and Forecast - by Import Market Analysis (Value & Volume)
- 9.4. Market Analysis, Insights and Forecast - by Export Market Analysis (Value & Volume)
- 9.5. Market Analysis, Insights and Forecast - by Price Trend Analysis
- 9.1. Market Analysis, Insights and Forecast - by Production Analysis
- 10. Asia Pacific APAC Small Cell Tower Industry Analysis, Insights and Forecast, 2019-2031
- 10.1. Market Analysis, Insights and Forecast - by Production Analysis
- 10.2. Market Analysis, Insights and Forecast - by Consumption Analysis
- 10.3. Market Analysis, Insights and Forecast - by Import Market Analysis (Value & Volume)
- 10.4. Market Analysis, Insights and Forecast - by Export Market Analysis (Value & Volume)
- 10.5. Market Analysis, Insights and Forecast - by Price Trend Analysis
- 10.1. Market Analysis, Insights and Forecast - by Production Analysis
- 11. North America APAC Small Cell Tower Industry Analysis, Insights and Forecast, 2019-2031
- 11.1. Market Analysis, Insights and Forecast - By Country/Sub-region
- 11.1.1.
- 12. Europe APAC Small Cell Tower Industry Analysis, Insights and Forecast, 2019-2031
- 12.1. Market Analysis, Insights and Forecast - By Country/Sub-region
- 12.1.1.
- 13. Asia Pacific APAC Small Cell Tower Industry Analysis, Insights and Forecast, 2019-2031
- 13.1. Market Analysis, Insights and Forecast - By Country/Sub-region
- 13.1.1.
- 14. Latin America APAC Small Cell Tower Industry Analysis, Insights and Forecast, 2019-2031
- 14.1. Market Analysis, Insights and Forecast - By Country/Sub-region
- 14.1.1.
- 15. Middle East and Africa APAC Small Cell Tower Industry Analysis, Insights and Forecast, 2019-2031
- 15.1. Market Analysis, Insights and Forecast - By Country/Sub-region
- 15.1.1.
- 16. Competitive Analysis
- 16.1. Global Market Share Analysis 2024
- 16.2. Company Profiles
- 16.2.1 T&W Electronics Co Ltd
- 16.2.1.1. Overview
- 16.2.1.2. Products
- 16.2.1.3. SWOT Analysis
- 16.2.1.4. Recent Developments
- 16.2.1.5. Financials (Based on Availability)
- 16.2.2 Parallel Wireless Inc
- 16.2.2.1. Overview
- 16.2.2.2. Products
- 16.2.2.3. SWOT Analysis
- 16.2.2.4. Recent Developments
- 16.2.2.5. Financials (Based on Availability)
- 16.2.3 Baicells Technologies Co Ltd
- 16.2.3.1. Overview
- 16.2.3.2. Products
- 16.2.3.3. SWOT Analysis
- 16.2.3.4. Recent Developments
- 16.2.3.5. Financials (Based on Availability)
- 16.2.4 Telefonaktiebolaget LM Ericsson
- 16.2.4.1. Overview
- 16.2.4.2. Products
- 16.2.4.3. SWOT Analysis
- 16.2.4.4. Recent Developments
- 16.2.4.5. Financials (Based on Availability)
- 16.2.5 Samsung Electronics Co Ltd
- 16.2.5.1. Overview
- 16.2.5.2. Products
- 16.2.5.3. SWOT Analysis
- 16.2.5.4. Recent Developments
- 16.2.5.5. Financials (Based on Availability)
- 16.2.6 Nokia Corporation*List Not Exhaustive
- 16.2.6.1. Overview
- 16.2.6.2. Products
- 16.2.6.3. SWOT Analysis
- 16.2.6.4. Recent Developments
- 16.2.6.5. Financials (Based on Availability)
- 16.2.7 NEC Corporation
- 16.2.7.1. Overview
- 16.2.7.2. Products
- 16.2.7.3. SWOT Analysis
- 16.2.7.4. Recent Developments
- 16.2.7.5. Financials (Based on Availability)
- 16.2.8 Huawei Technologies Co Ltd
- 16.2.8.1. Overview
- 16.2.8.2. Products
- 16.2.8.3. SWOT Analysis
- 16.2.8.4. Recent Developments
- 16.2.8.5. Financials (Based on Availability)
- 16.2.9 ZTE Corporation
- 16.2.9.1. Overview
- 16.2.9.2. Products
- 16.2.9.3. SWOT Analysis
- 16.2.9.4. Recent Developments
- 16.2.9.5. Financials (Based on Availability)
- 16.2.10 Airspan Networks Inc
- 16.2.10.1. Overview
- 16.2.10.2. Products
- 16.2.10.3. SWOT Analysis
- 16.2.10.4. Recent Developments
- 16.2.10.5. Financials (Based on Availability)
- 16.2.1 T&W Electronics Co Ltd
List of Figures
- Figure 1: Global APAC Small Cell Tower Industry Revenue Breakdown (Million, %) by Region 2024 & 2032
- Figure 2: Global APAC Small Cell Tower Industry Volume Breakdown (Million, %) by Region 2024 & 2032
- Figure 3: North America APAC Small Cell Tower Industry Revenue (Million), by Country 2024 & 2032
- Figure 4: North America APAC Small Cell Tower Industry Volume (Million), by Country 2024 & 2032
- Figure 5: North America APAC Small Cell Tower Industry Revenue Share (%), by Country 2024 & 2032
- Figure 6: North America APAC Small Cell Tower Industry Volume Share (%), by Country 2024 & 2032
- Figure 7: Europe APAC Small Cell Tower Industry Revenue (Million), by Country 2024 & 2032
- Figure 8: Europe APAC Small Cell Tower Industry Volume (Million), by Country 2024 & 2032
- Figure 9: Europe APAC Small Cell Tower Industry Revenue Share (%), by Country 2024 & 2032
- Figure 10: Europe APAC Small Cell Tower Industry Volume Share (%), by Country 2024 & 2032
- Figure 11: Asia Pacific APAC Small Cell Tower Industry Revenue (Million), by Country 2024 & 2032
- Figure 12: Asia Pacific APAC Small Cell Tower Industry Volume (Million), by Country 2024 & 2032
- Figure 13: Asia Pacific APAC Small Cell Tower Industry Revenue Share (%), by Country 2024 & 2032
- Figure 14: Asia Pacific APAC Small Cell Tower Industry Volume Share (%), by Country 2024 & 2032
- Figure 15: Latin America APAC Small Cell Tower Industry Revenue (Million), by Country 2024 & 2032
- Figure 16: Latin America APAC Small Cell Tower Industry Volume (Million), by Country 2024 & 2032
- Figure 17: Latin America APAC Small Cell Tower Industry Revenue Share (%), by Country 2024 & 2032
- Figure 18: Latin America APAC Small Cell Tower Industry Volume Share (%), by Country 2024 & 2032
- Figure 19: Middle East and Africa APAC Small Cell Tower Industry Revenue (Million), by Country 2024 & 2032
- Figure 20: Middle East and Africa APAC Small Cell Tower Industry Volume (Million), by Country 2024 & 2032
- Figure 21: Middle East and Africa APAC Small Cell Tower Industry Revenue Share (%), by Country 2024 & 2032
- Figure 22: Middle East and Africa APAC Small Cell Tower Industry Volume Share (%), by Country 2024 & 2032
- Figure 23: North America APAC Small Cell Tower Industry Revenue (Million), by Production Analysis 2024 & 2032
- Figure 24: North America APAC Small Cell Tower Industry Volume (Million), by Production Analysis 2024 & 2032
- Figure 25: North America APAC Small Cell Tower Industry Revenue Share (%), by Production Analysis 2024 & 2032
- Figure 26: North America APAC Small Cell Tower Industry Volume Share (%), by Production Analysis 2024 & 2032
- Figure 27: North America APAC Small Cell Tower Industry Revenue (Million), by Consumption Analysis 2024 & 2032
- Figure 28: North America APAC Small Cell Tower Industry Volume (Million), by Consumption Analysis 2024 & 2032
- Figure 29: North America APAC Small Cell Tower Industry Revenue Share (%), by Consumption Analysis 2024 & 2032
- Figure 30: North America APAC Small Cell Tower Industry Volume Share (%), by Consumption Analysis 2024 & 2032
- Figure 31: North America APAC Small Cell Tower Industry Revenue (Million), by Import Market Analysis (Value & Volume) 2024 & 2032
- Figure 32: North America APAC Small Cell Tower Industry Volume (Million), by Import Market Analysis (Value & Volume) 2024 & 2032
- Figure 33: North America APAC Small Cell Tower Industry Revenue Share (%), by Import Market Analysis (Value & Volume) 2024 & 2032
- Figure 34: North America APAC Small Cell Tower Industry Volume Share (%), by Import Market Analysis (Value & Volume) 2024 & 2032
- Figure 35: North America APAC Small Cell Tower Industry Revenue (Million), by Export Market Analysis (Value & Volume) 2024 & 2032
- Figure 36: North America APAC Small Cell Tower Industry Volume (Million), by Export Market Analysis (Value & Volume) 2024 & 2032
- Figure 37: North America APAC Small Cell Tower Industry Revenue Share (%), by Export Market Analysis (Value & Volume) 2024 & 2032
- Figure 38: North America APAC Small Cell Tower Industry Volume Share (%), by Export Market Analysis (Value & Volume) 2024 & 2032
- Figure 39: North America APAC Small Cell Tower Industry Revenue (Million), by Price Trend Analysis 2024 & 2032
- Figure 40: North America APAC Small Cell Tower Industry Volume (Million), by Price Trend Analysis 2024 & 2032
- Figure 41: North America APAC Small Cell Tower Industry Revenue Share (%), by Price Trend Analysis 2024 & 2032
- Figure 42: North America APAC Small Cell Tower Industry Volume Share (%), by Price Trend Analysis 2024 & 2032
- Figure 43: North America APAC Small Cell Tower Industry Revenue (Million), by Country 2024 & 2032
- Figure 44: North America APAC Small Cell Tower Industry Volume (Million), by Country 2024 & 2032
- Figure 45: North America APAC Small Cell Tower Industry Revenue Share (%), by Country 2024 & 2032
- Figure 46: North America APAC Small Cell Tower Industry Volume Share (%), by Country 2024 & 2032
- Figure 47: South America APAC Small Cell Tower Industry Revenue (Million), by Production Analysis 2024 & 2032
- Figure 48: South America APAC Small Cell Tower Industry Volume (Million), by Production Analysis 2024 & 2032
- Figure 49: South America APAC Small Cell Tower Industry Revenue Share (%), by Production Analysis 2024 & 2032
- Figure 50: South America APAC Small Cell Tower Industry Volume Share (%), by Production Analysis 2024 & 2032
- Figure 51: South America APAC Small Cell Tower Industry Revenue (Million), by Consumption Analysis 2024 & 2032
- Figure 52: South America APAC Small Cell Tower Industry Volume (Million), by Consumption Analysis 2024 & 2032
- Figure 53: South America APAC Small Cell Tower Industry Revenue Share (%), by Consumption Analysis 2024 & 2032
- Figure 54: South America APAC Small Cell Tower Industry Volume Share (%), by Consumption Analysis 2024 & 2032
- Figure 55: South America APAC Small Cell Tower Industry Revenue (Million), by Import Market Analysis (Value & Volume) 2024 & 2032
- Figure 56: South America APAC Small Cell Tower Industry Volume (Million), by Import Market Analysis (Value & Volume) 2024 & 2032
- Figure 57: South America APAC Small Cell Tower Industry Revenue Share (%), by Import Market Analysis (Value & Volume) 2024 & 2032
- Figure 58: South America APAC Small Cell Tower Industry Volume Share (%), by Import Market Analysis (Value & Volume) 2024 & 2032
- Figure 59: South America APAC Small Cell Tower Industry Revenue (Million), by Export Market Analysis (Value & Volume) 2024 & 2032
- Figure 60: South America APAC Small Cell Tower Industry Volume (Million), by Export Market Analysis (Value & Volume) 2024 & 2032
- Figure 61: South America APAC Small Cell Tower Industry Revenue Share (%), by Export Market Analysis (Value & Volume) 2024 & 2032
- Figure 62: South America APAC Small Cell Tower Industry Volume Share (%), by Export Market Analysis (Value & Volume) 2024 & 2032
- Figure 63: South America APAC Small Cell Tower Industry Revenue (Million), by Price Trend Analysis 2024 & 2032
- Figure 64: South America APAC Small Cell Tower Industry Volume (Million), by Price Trend Analysis 2024 & 2032
- Figure 65: South America APAC Small Cell Tower Industry Revenue Share (%), by Price Trend Analysis 2024 & 2032
- Figure 66: South America APAC Small Cell Tower Industry Volume Share (%), by Price Trend Analysis 2024 & 2032
- Figure 67: South America APAC Small Cell Tower Industry Revenue (Million), by Country 2024 & 2032
- Figure 68: South America APAC Small Cell Tower Industry Volume (Million), by Country 2024 & 2032
- Figure 69: South America APAC Small Cell Tower Industry Revenue Share (%), by Country 2024 & 2032
- Figure 70: South America APAC Small Cell Tower Industry Volume Share (%), by Country 2024 & 2032
- Figure 71: Europe APAC Small Cell Tower Industry Revenue (Million), by Production Analysis 2024 & 2032
- Figure 72: Europe APAC Small Cell Tower Industry Volume (Million), by Production Analysis 2024 & 2032
- Figure 73: Europe APAC Small Cell Tower Industry Revenue Share (%), by Production Analysis 2024 & 2032
- Figure 74: Europe APAC Small Cell Tower Industry Volume Share (%), by Production Analysis 2024 & 2032
- Figure 75: Europe APAC Small Cell Tower Industry Revenue (Million), by Consumption Analysis 2024 & 2032
- Figure 76: Europe APAC Small Cell Tower Industry Volume (Million), by Consumption Analysis 2024 & 2032
- Figure 77: Europe APAC Small Cell Tower Industry Revenue Share (%), by Consumption Analysis 2024 & 2032
- Figure 78: Europe APAC Small Cell Tower Industry Volume Share (%), by Consumption Analysis 2024 & 2032
- Figure 79: Europe APAC Small Cell Tower Industry Revenue (Million), by Import Market Analysis (Value & Volume) 2024 & 2032
- Figure 80: Europe APAC Small Cell Tower Industry Volume (Million), by Import Market Analysis (Value & Volume) 2024 & 2032
- Figure 81: Europe APAC Small Cell Tower Industry Revenue Share (%), by Import Market Analysis (Value & Volume) 2024 & 2032
- Figure 82: Europe APAC Small Cell Tower Industry Volume Share (%), by Import Market Analysis (Value & Volume) 2024 & 2032
- Figure 83: Europe APAC Small Cell Tower Industry Revenue (Million), by Export Market Analysis (Value & Volume) 2024 & 2032
- Figure 84: Europe APAC Small Cell Tower Industry Volume (Million), by Export Market Analysis (Value & Volume) 2024 & 2032
- Figure 85: Europe APAC Small Cell Tower Industry Revenue Share (%), by Export Market Analysis (Value & Volume) 2024 & 2032
- Figure 86: Europe APAC Small Cell Tower Industry Volume Share (%), by Export Market Analysis (Value & Volume) 2024 & 2032
- Figure 87: Europe APAC Small Cell Tower Industry Revenue (Million), by Price Trend Analysis 2024 & 2032
- Figure 88: Europe APAC Small Cell Tower Industry Volume (Million), by Price Trend Analysis 2024 & 2032
- Figure 89: Europe APAC Small Cell Tower Industry Revenue Share (%), by Price Trend Analysis 2024 & 2032
- Figure 90: Europe APAC Small Cell Tower Industry Volume Share (%), by Price Trend Analysis 2024 & 2032
- Figure 91: Europe APAC Small Cell Tower Industry Revenue (Million), by Country 2024 & 2032
- Figure 92: Europe APAC Small Cell Tower Industry Volume (Million), by Country 2024 & 2032
- Figure 93: Europe APAC Small Cell Tower Industry Revenue Share (%), by Country 2024 & 2032
- Figure 94: Europe APAC Small Cell Tower Industry Volume Share (%), by Country 2024 & 2032
- Figure 95: Middle East & Africa APAC Small Cell Tower Industry Revenue (Million), by Production Analysis 2024 & 2032
- Figure 96: Middle East & Africa APAC Small Cell Tower Industry Volume (Million), by Production Analysis 2024 & 2032
- Figure 97: Middle East & Africa APAC Small Cell Tower Industry Revenue Share (%), by Production Analysis 2024 & 2032
- Figure 98: Middle East & Africa APAC Small Cell Tower Industry Volume Share (%), by Production Analysis 2024 & 2032
- Figure 99: Middle East & Africa APAC Small Cell Tower Industry Revenue (Million), by Consumption Analysis 2024 & 2032
- Figure 100: Middle East & Africa APAC Small Cell Tower Industry Volume (Million), by Consumption Analysis 2024 & 2032
- Figure 101: Middle East & Africa APAC Small Cell Tower Industry Revenue Share (%), by Consumption Analysis 2024 & 2032
- Figure 102: Middle East & Africa APAC Small Cell Tower Industry Volume Share (%), by Consumption Analysis 2024 & 2032
- Figure 103: Middle East & Africa APAC Small Cell Tower Industry Revenue (Million), by Import Market Analysis (Value & Volume) 2024 & 2032
- Figure 104: Middle East & Africa APAC Small Cell Tower Industry Volume (Million), by Import Market Analysis (Value & Volume) 2024 & 2032
- Figure 105: Middle East & Africa APAC Small Cell Tower Industry Revenue Share (%), by Import Market Analysis (Value & Volume) 2024 & 2032
- Figure 106: Middle East & Africa APAC Small Cell Tower Industry Volume Share (%), by Import Market Analysis (Value & Volume) 2024 & 2032
- Figure 107: Middle East & Africa APAC Small Cell Tower Industry Revenue (Million), by Export Market Analysis (Value & Volume) 2024 & 2032
- Figure 108: Middle East & Africa APAC Small Cell Tower Industry Volume (Million), by Export Market Analysis (Value & Volume) 2024 & 2032
- Figure 109: Middle East & Africa APAC Small Cell Tower Industry Revenue Share (%), by Export Market Analysis (Value & Volume) 2024 & 2032
- Figure 110: Middle East & Africa APAC Small Cell Tower Industry Volume Share (%), by Export Market Analysis (Value & Volume) 2024 & 2032
- Figure 111: Middle East & Africa APAC Small Cell Tower Industry Revenue (Million), by Price Trend Analysis 2024 & 2032
- Figure 112: Middle East & Africa APAC Small Cell Tower Industry Volume (Million), by Price Trend Analysis 2024 & 2032
- Figure 113: Middle East & Africa APAC Small Cell Tower Industry Revenue Share (%), by Price Trend Analysis 2024 & 2032
- Figure 114: Middle East & Africa APAC Small Cell Tower Industry Volume Share (%), by Price Trend Analysis 2024 & 2032
- Figure 115: Middle East & Africa APAC Small Cell Tower Industry Revenue (Million), by Country 2024 & 2032
- Figure 116: Middle East & Africa APAC Small Cell Tower Industry Volume (Million), by Country 2024 & 2032
- Figure 117: Middle East & Africa APAC Small Cell Tower Industry Revenue Share (%), by Country 2024 & 2032
- Figure 118: Middle East & Africa APAC Small Cell Tower Industry Volume Share (%), by Country 2024 & 2032
- Figure 119: Asia Pacific APAC Small Cell Tower Industry Revenue (Million), by Production Analysis 2024 & 2032
- Figure 120: Asia Pacific APAC Small Cell Tower Industry Volume (Million), by Production Analysis 2024 & 2032
- Figure 121: Asia Pacific APAC Small Cell Tower Industry Revenue Share (%), by Production Analysis 2024 & 2032
- Figure 122: Asia Pacific APAC Small Cell Tower Industry Volume Share (%), by Production Analysis 2024 & 2032
- Figure 123: Asia Pacific APAC Small Cell Tower Industry Revenue (Million), by Consumption Analysis 2024 & 2032
- Figure 124: Asia Pacific APAC Small Cell Tower Industry Volume (Million), by Consumption Analysis 2024 & 2032
- Figure 125: Asia Pacific APAC Small Cell Tower Industry Revenue Share (%), by Consumption Analysis 2024 & 2032
- Figure 126: Asia Pacific APAC Small Cell Tower Industry Volume Share (%), by Consumption Analysis 2024 & 2032
- Figure 127: Asia Pacific APAC Small Cell Tower Industry Revenue (Million), by Import Market Analysis (Value & Volume) 2024 & 2032
- Figure 128: Asia Pacific APAC Small Cell Tower Industry Volume (Million), by Import Market Analysis (Value & Volume) 2024 & 2032
- Figure 129: Asia Pacific APAC Small Cell Tower Industry Revenue Share (%), by Import Market Analysis (Value & Volume) 2024 & 2032
- Figure 130: Asia Pacific APAC Small Cell Tower Industry Volume Share (%), by Import Market Analysis (Value & Volume) 2024 & 2032
- Figure 131: Asia Pacific APAC Small Cell Tower Industry Revenue (Million), by Export Market Analysis (Value & Volume) 2024 & 2032
- Figure 132: Asia Pacific APAC Small Cell Tower Industry Volume (Million), by Export Market Analysis (Value & Volume) 2024 & 2032
- Figure 133: Asia Pacific APAC Small Cell Tower Industry Revenue Share (%), by Export Market Analysis (Value & Volume) 2024 & 2032
- Figure 134: Asia Pacific APAC Small Cell Tower Industry Volume Share (%), by Export Market Analysis (Value & Volume) 2024 & 2032
- Figure 135: Asia Pacific APAC Small Cell Tower Industry Revenue (Million), by Price Trend Analysis 2024 & 2032
- Figure 136: Asia Pacific APAC Small Cell Tower Industry Volume (Million), by Price Trend Analysis 2024 & 2032
- Figure 137: Asia Pacific APAC Small Cell Tower Industry Revenue Share (%), by Price Trend Analysis 2024 & 2032
- Figure 138: Asia Pacific APAC Small Cell Tower Industry Volume Share (%), by Price Trend Analysis 2024 & 2032
- Figure 139: Asia Pacific APAC Small Cell Tower Industry Revenue (Million), by Country 2024 & 2032
- Figure 140: Asia Pacific APAC Small Cell Tower Industry Volume (Million), by Country 2024 & 2032
- Figure 141: Asia Pacific APAC Small Cell Tower Industry Revenue Share (%), by Country 2024 & 2032
- Figure 142: Asia Pacific APAC Small Cell Tower Industry Volume Share (%), by Country 2024 & 2032
List of Tables
- Table 1: Global APAC Small Cell Tower Industry Revenue Million Forecast, by Region 2019 & 2032
- Table 2: Global APAC Small Cell Tower Industry Volume Million Forecast, by Region 2019 & 2032
- Table 3: Global APAC Small Cell Tower Industry Revenue Million Forecast, by Production Analysis 2019 & 2032
- Table 4: Global APAC Small Cell Tower Industry Volume Million Forecast, by Production Analysis 2019 & 2032
- Table 5: Global APAC Small Cell Tower Industry Revenue Million Forecast, by Consumption Analysis 2019 & 2032
- Table 6: Global APAC Small Cell Tower Industry Volume Million Forecast, by Consumption Analysis 2019 & 2032
- Table 7: Global APAC Small Cell Tower Industry Revenue Million Forecast, by Import Market Analysis (Value & Volume) 2019 & 2032
- Table 8: Global APAC Small Cell Tower Industry Volume Million Forecast, by Import Market Analysis (Value & Volume) 2019 & 2032
- Table 9: Global APAC Small Cell Tower Industry Revenue Million Forecast, by Export Market Analysis (Value & Volume) 2019 & 2032
- Table 10: Global APAC Small Cell Tower Industry Volume Million Forecast, by Export Market Analysis (Value & Volume) 2019 & 2032
- Table 11: Global APAC Small Cell Tower Industry Revenue Million Forecast, by Price Trend Analysis 2019 & 2032
- Table 12: Global APAC Small Cell Tower Industry Volume Million Forecast, by Price Trend Analysis 2019 & 2032
- Table 13: Global APAC Small Cell Tower Industry Revenue Million Forecast, by Region 2019 & 2032
- Table 14: Global APAC Small Cell Tower Industry Volume Million Forecast, by Region 2019 & 2032
- Table 15: Global APAC Small Cell Tower Industry Revenue Million Forecast, by Country 2019 & 2032
- Table 16: Global APAC Small Cell Tower Industry Volume Million Forecast, by Country 2019 & 2032
- Table 17: APAC Small Cell Tower Industry Revenue (Million) Forecast, by Application 2019 & 2032
- Table 18: APAC Small Cell Tower Industry Volume (Million) Forecast, by Application 2019 & 2032
- Table 19: Global APAC Small Cell Tower Industry Revenue Million Forecast, by Country 2019 & 2032
- Table 20: Global APAC Small Cell Tower Industry Volume Million Forecast, by Country 2019 & 2032
- Table 21: APAC Small Cell Tower Industry Revenue (Million) Forecast, by Application 2019 & 2032
- Table 22: APAC Small Cell Tower Industry Volume (Million) Forecast, by Application 2019 & 2032
- Table 23: Global APAC Small Cell Tower Industry Revenue Million Forecast, by Country 2019 & 2032
- Table 24: Global APAC Small Cell Tower Industry Volume Million Forecast, by Country 2019 & 2032
- Table 25: APAC Small Cell Tower Industry Revenue (Million) Forecast, by Application 2019 & 2032
- Table 26: APAC Small Cell Tower Industry Volume (Million) Forecast, by Application 2019 & 2032
- Table 27: Global APAC Small Cell Tower Industry Revenue Million Forecast, by Country 2019 & 2032
- Table 28: Global APAC Small Cell Tower Industry Volume Million Forecast, by Country 2019 & 2032
- Table 29: APAC Small Cell Tower Industry Revenue (Million) Forecast, by Application 2019 & 2032
- Table 30: APAC Small Cell Tower Industry Volume (Million) Forecast, by Application 2019 & 2032
- Table 31: Global APAC Small Cell Tower Industry Revenue Million Forecast, by Country 2019 & 2032
- Table 32: Global APAC Small Cell Tower Industry Volume Million Forecast, by Country 2019 & 2032
- Table 33: APAC Small Cell Tower Industry Revenue (Million) Forecast, by Application 2019 & 2032
- Table 34: APAC Small Cell Tower Industry Volume (Million) Forecast, by Application 2019 & 2032
- Table 35: Global APAC Small Cell Tower Industry Revenue Million Forecast, by Production Analysis 2019 & 2032
- Table 36: Global APAC Small Cell Tower Industry Volume Million Forecast, by Production Analysis 2019 & 2032
- Table 37: Global APAC Small Cell Tower Industry Revenue Million Forecast, by Consumption Analysis 2019 & 2032
- Table 38: Global APAC Small Cell Tower Industry Volume Million Forecast, by Consumption Analysis 2019 & 2032
- Table 39: Global APAC Small Cell Tower Industry Revenue Million Forecast, by Import Market Analysis (Value & Volume) 2019 & 2032
- Table 40: Global APAC Small Cell Tower Industry Volume Million Forecast, by Import Market Analysis (Value & Volume) 2019 & 2032
- Table 41: Global APAC Small Cell Tower Industry Revenue Million Forecast, by Export Market Analysis (Value & Volume) 2019 & 2032
- Table 42: Global APAC Small Cell Tower Industry Volume Million Forecast, by Export Market Analysis (Value & Volume) 2019 & 2032
- Table 43: Global APAC Small Cell Tower Industry Revenue Million Forecast, by Price Trend Analysis 2019 & 2032
- Table 44: Global APAC Small Cell Tower Industry Volume Million Forecast, by Price Trend Analysis 2019 & 2032
- Table 45: Global APAC Small Cell Tower Industry Revenue Million Forecast, by Country 2019 & 2032
- Table 46: Global APAC Small Cell Tower Industry Volume Million Forecast, by Country 2019 & 2032
- Table 47: United States APAC Small Cell Tower Industry Revenue (Million) Forecast, by Application 2019 & 2032
- Table 48: United States APAC Small Cell Tower Industry Volume (Million) Forecast, by Application 2019 & 2032
- Table 49: Canada APAC Small Cell Tower Industry Revenue (Million) Forecast, by Application 2019 & 2032
- Table 50: Canada APAC Small Cell Tower Industry Volume (Million) Forecast, by Application 2019 & 2032
- Table 51: Mexico APAC Small Cell Tower Industry Revenue (Million) Forecast, by Application 2019 & 2032
- Table 52: Mexico APAC Small Cell Tower Industry Volume (Million) Forecast, by Application 2019 & 2032
- Table 53: Global APAC Small Cell Tower Industry Revenue Million Forecast, by Production Analysis 2019 & 2032
- Table 54: Global APAC Small Cell Tower Industry Volume Million Forecast, by Production Analysis 2019 & 2032
- Table 55: Global APAC Small Cell Tower Industry Revenue Million Forecast, by Consumption Analysis 2019 & 2032
- Table 56: Global APAC Small Cell Tower Industry Volume Million Forecast, by Consumption Analysis 2019 & 2032
- Table 57: Global APAC Small Cell Tower Industry Revenue Million Forecast, by Import Market Analysis (Value & Volume) 2019 & 2032
- Table 58: Global APAC Small Cell Tower Industry Volume Million Forecast, by Import Market Analysis (Value & Volume) 2019 & 2032
- Table 59: Global APAC Small Cell Tower Industry Revenue Million Forecast, by Export Market Analysis (Value & Volume) 2019 & 2032
- Table 60: Global APAC Small Cell Tower Industry Volume Million Forecast, by Export Market Analysis (Value & Volume) 2019 & 2032
- Table 61: Global APAC Small Cell Tower Industry Revenue Million Forecast, by Price Trend Analysis 2019 & 2032
- Table 62: Global APAC Small Cell Tower Industry Volume Million Forecast, by Price Trend Analysis 2019 & 2032
- Table 63: Global APAC Small Cell Tower Industry Revenue Million Forecast, by Country 2019 & 2032
- Table 64: Global APAC Small Cell Tower Industry Volume Million Forecast, by Country 2019 & 2032
- Table 65: Brazil APAC Small Cell Tower Industry Revenue (Million) Forecast, by Application 2019 & 2032
- Table 66: Brazil APAC Small Cell Tower Industry Volume (Million) Forecast, by Application 2019 & 2032
- Table 67: Argentina APAC Small Cell Tower Industry Revenue (Million) Forecast, by Application 2019 & 2032
- Table 68: Argentina APAC Small Cell Tower Industry Volume (Million) Forecast, by Application 2019 & 2032
- Table 69: Rest of South America APAC Small Cell Tower Industry Revenue (Million) Forecast, by Application 2019 & 2032
- Table 70: Rest of South America APAC Small Cell Tower Industry Volume (Million) Forecast, by Application 2019 & 2032
- Table 71: Global APAC Small Cell Tower Industry Revenue Million Forecast, by Production Analysis 2019 & 2032
- Table 72: Global APAC Small Cell Tower Industry Volume Million Forecast, by Production Analysis 2019 & 2032
- Table 73: Global APAC Small Cell Tower Industry Revenue Million Forecast, by Consumption Analysis 2019 & 2032
- Table 74: Global APAC Small Cell Tower Industry Volume Million Forecast, by Consumption Analysis 2019 & 2032
- Table 75: Global APAC Small Cell Tower Industry Revenue Million Forecast, by Import Market Analysis (Value & Volume) 2019 & 2032
- Table 76: Global APAC Small Cell Tower Industry Volume Million Forecast, by Import Market Analysis (Value & Volume) 2019 & 2032
- Table 77: Global APAC Small Cell Tower Industry Revenue Million Forecast, by Export Market Analysis (Value & Volume) 2019 & 2032
- Table 78: Global APAC Small Cell Tower Industry Volume Million Forecast, by Export Market Analysis (Value & Volume) 2019 & 2032
- Table 79: Global APAC Small Cell Tower Industry Revenue Million Forecast, by Price Trend Analysis 2019 & 2032
- Table 80: Global APAC Small Cell Tower Industry Volume Million Forecast, by Price Trend Analysis 2019 & 2032
- Table 81: Global APAC Small Cell Tower Industry Revenue Million Forecast, by Country 2019 & 2032
- Table 82: Global APAC Small Cell Tower Industry Volume Million Forecast, by Country 2019 & 2032
- Table 83: United Kingdom APAC Small Cell Tower Industry Revenue (Million) Forecast, by Application 2019 & 2032
- Table 84: United Kingdom APAC Small Cell Tower Industry Volume (Million) Forecast, by Application 2019 & 2032
- Table 85: Germany APAC Small Cell Tower Industry Revenue (Million) Forecast, by Application 2019 & 2032
- Table 86: Germany APAC Small Cell Tower Industry Volume (Million) Forecast, by Application 2019 & 2032
- Table 87: France APAC Small Cell Tower Industry Revenue (Million) Forecast, by Application 2019 & 2032
- Table 88: France APAC Small Cell Tower Industry Volume (Million) Forecast, by Application 2019 & 2032
- Table 89: Italy APAC Small Cell Tower Industry Revenue (Million) Forecast, by Application 2019 & 2032
- Table 90: Italy APAC Small Cell Tower Industry Volume (Million) Forecast, by Application 2019 & 2032
- Table 91: Spain APAC Small Cell Tower Industry Revenue (Million) Forecast, by Application 2019 & 2032
- Table 92: Spain APAC Small Cell Tower Industry Volume (Million) Forecast, by Application 2019 & 2032
- Table 93: Russia APAC Small Cell Tower Industry Revenue (Million) Forecast, by Application 2019 & 2032
- Table 94: Russia APAC Small Cell Tower Industry Volume (Million) Forecast, by Application 2019 & 2032
- Table 95: Benelux APAC Small Cell Tower Industry Revenue (Million) Forecast, by Application 2019 & 2032
- Table 96: Benelux APAC Small Cell Tower Industry Volume (Million) Forecast, by Application 2019 & 2032
- Table 97: Nordics APAC Small Cell Tower Industry Revenue (Million) Forecast, by Application 2019 & 2032
- Table 98: Nordics APAC Small Cell Tower Industry Volume (Million) Forecast, by Application 2019 & 2032
- Table 99: Rest of Europe APAC Small Cell Tower Industry Revenue (Million) Forecast, by Application 2019 & 2032
- Table 100: Rest of Europe APAC Small Cell Tower Industry Volume (Million) Forecast, by Application 2019 & 2032
- Table 101: Global APAC Small Cell Tower Industry Revenue Million Forecast, by Production Analysis 2019 & 2032
- Table 102: Global APAC Small Cell Tower Industry Volume Million Forecast, by Production Analysis 2019 & 2032
- Table 103: Global APAC Small Cell Tower Industry Revenue Million Forecast, by Consumption Analysis 2019 & 2032
- Table 104: Global APAC Small Cell Tower Industry Volume Million Forecast, by Consumption Analysis 2019 & 2032
- Table 105: Global APAC Small Cell Tower Industry Revenue Million Forecast, by Import Market Analysis (Value & Volume) 2019 & 2032
- Table 106: Global APAC Small Cell Tower Industry Volume Million Forecast, by Import Market Analysis (Value & Volume) 2019 & 2032
- Table 107: Global APAC Small Cell Tower Industry Revenue Million Forecast, by Export Market Analysis (Value & Volume) 2019 & 2032
- Table 108: Global APAC Small Cell Tower Industry Volume Million Forecast, by Export Market Analysis (Value & Volume) 2019 & 2032
- Table 109: Global APAC Small Cell Tower Industry Revenue Million Forecast, by Price Trend Analysis 2019 & 2032
- Table 110: Global APAC Small Cell Tower Industry Volume Million Forecast, by Price Trend Analysis 2019 & 2032
- Table 111: Global APAC Small Cell Tower Industry Revenue Million Forecast, by Country 2019 & 2032
- Table 112: Global APAC Small Cell Tower Industry Volume Million Forecast, by Country 2019 & 2032
- Table 113: Turkey APAC Small Cell Tower Industry Revenue (Million) Forecast, by Application 2019 & 2032
- Table 114: Turkey APAC Small Cell Tower Industry Volume (Million) Forecast, by Application 2019 & 2032
- Table 115: Israel APAC Small Cell Tower Industry Revenue (Million) Forecast, by Application 2019 & 2032
- Table 116: Israel APAC Small Cell Tower Industry Volume (Million) Forecast, by Application 2019 & 2032
- Table 117: GCC APAC Small Cell Tower Industry Revenue (Million) Forecast, by Application 2019 & 2032
- Table 118: GCC APAC Small Cell Tower Industry Volume (Million) Forecast, by Application 2019 & 2032
- Table 119: North Africa APAC Small Cell Tower Industry Revenue (Million) Forecast, by Application 2019 & 2032
- Table 120: North Africa APAC Small Cell Tower Industry Volume (Million) Forecast, by Application 2019 & 2032
- Table 121: South Africa APAC Small Cell Tower Industry Revenue (Million) Forecast, by Application 2019 & 2032
- Table 122: South Africa APAC Small Cell Tower Industry Volume (Million) Forecast, by Application 2019 & 2032
- Table 123: Rest of Middle East & Africa APAC Small Cell Tower Industry Revenue (Million) Forecast, by Application 2019 & 2032
- Table 124: Rest of Middle East & Africa APAC Small Cell Tower Industry Volume (Million) Forecast, by Application 2019 & 2032
- Table 125: Global APAC Small Cell Tower Industry Revenue Million Forecast, by Production Analysis 2019 & 2032
- Table 126: Global APAC Small Cell Tower Industry Volume Million Forecast, by Production Analysis 2019 & 2032
- Table 127: Global APAC Small Cell Tower Industry Revenue Million Forecast, by Consumption Analysis 2019 & 2032
- Table 128: Global APAC Small Cell Tower Industry Volume Million Forecast, by Consumption Analysis 2019 & 2032
- Table 129: Global APAC Small Cell Tower Industry Revenue Million Forecast, by Import Market Analysis (Value & Volume) 2019 & 2032
- Table 130: Global APAC Small Cell Tower Industry Volume Million Forecast, by Import Market Analysis (Value & Volume) 2019 & 2032
- Table 131: Global APAC Small Cell Tower Industry Revenue Million Forecast, by Export Market Analysis (Value & Volume) 2019 & 2032
- Table 132: Global APAC Small Cell Tower Industry Volume Million Forecast, by Export Market Analysis (Value & Volume) 2019 & 2032
- Table 133: Global APAC Small Cell Tower Industry Revenue Million Forecast, by Price Trend Analysis 2019 & 2032
- Table 134: Global APAC Small Cell Tower Industry Volume Million Forecast, by Price Trend Analysis 2019 & 2032
- Table 135: Global APAC Small Cell Tower Industry Revenue Million Forecast, by Country 2019 & 2032
- Table 136: Global APAC Small Cell Tower Industry Volume Million Forecast, by Country 2019 & 2032
- Table 137: China APAC Small Cell Tower Industry Revenue (Million) Forecast, by Application 2019 & 2032
- Table 138: China APAC Small Cell Tower Industry Volume (Million) Forecast, by Application 2019 & 2032
- Table 139: India APAC Small Cell Tower Industry Revenue (Million) Forecast, by Application 2019 & 2032
- Table 140: India APAC Small Cell Tower Industry Volume (Million) Forecast, by Application 2019 & 2032
- Table 141: Japan APAC Small Cell Tower Industry Revenue (Million) Forecast, by Application 2019 & 2032
- Table 142: Japan APAC Small Cell Tower Industry Volume (Million) Forecast, by Application 2019 & 2032
- Table 143: South Korea APAC Small Cell Tower Industry Revenue (Million) Forecast, by Application 2019 & 2032
- Table 144: South Korea APAC Small Cell Tower Industry Volume (Million) Forecast, by Application 2019 & 2032
- Table 145: ASEAN APAC Small Cell Tower Industry Revenue (Million) Forecast, by Application 2019 & 2032
- Table 146: ASEAN APAC Small Cell Tower Industry Volume (Million) Forecast, by Application 2019 & 2032
- Table 147: Oceania APAC Small Cell Tower Industry Revenue (Million) Forecast, by Application 2019 & 2032
- Table 148: Oceania APAC Small Cell Tower Industry Volume (Million) Forecast, by Application 2019 & 2032
- Table 149: Rest of Asia Pacific APAC Small Cell Tower Industry Revenue (Million) Forecast, by Application 2019 & 2032
- Table 150: Rest of Asia Pacific APAC Small Cell Tower Industry Volume (Million) Forecast, by Application 2019 & 2032
Frequently Asked Questions
1. What is the projected Compound Annual Growth Rate (CAGR) of the APAC Small Cell Tower Industry?
The projected CAGR is approximately 6.20%.
2. Which companies are prominent players in the APAC Small Cell Tower Industry?
Key companies in the market include T&W Electronics Co Ltd, Parallel Wireless Inc, Baicells Technologies Co Ltd, Telefonaktiebolaget LM Ericsson, Samsung Electronics Co Ltd, Nokia Corporation*List Not Exhaustive, NEC Corporation, Huawei Technologies Co Ltd, ZTE Corporation, Airspan Networks Inc.
3. What are the main segments of the APAC Small Cell Tower Industry?
The market segments include Production Analysis, Consumption Analysis, Import Market Analysis (Value & Volume), Export Market Analysis (Value & Volume), Price Trend Analysis.
4. Can you provide details about the market size?
The market size is estimated to be USD XX Million as of 2022.
5. What are some drivers contributing to market growth?
Rapid Increase in Mobile Data Traffic in the Region; Growing Emphasis on Operational Efficiency and Reduction of Capital Expenditure through Replacement of Older Networks with Small Cell Towers; Steady Growth in Installations by Market Incumbents in Mature Markets such as China and South Korea.
6. What are the notable trends driving market growth?
Indoor applications are Expected to Have a Major Market Share..
7. Are there any restraints impacting market growth?
Various Regulations and Policies Coupled with Storage Issues.
8. Can you provide examples of recent developments in the market?
January 2023 - Telefonaktiebolaget LM Ericsson has announced an expansion Private Network portfolio Called NetCloud Private A full subscription-based product, Networks is a software-defined solution that is first targeted at traditionally lean IT-oriented businesses, such as those in the logistics, light manufacturing, government, major retail, healthcare, and hospitality industries.
9. What pricing options are available for accessing the report?
Pricing options include single-user, multi-user, and enterprise licenses priced at USD 4750, USD 4950, and USD 6800 respectively.
10. Is the market size provided in terms of value or volume?
The market size is provided in terms of value, measured in Million and volume, measured in Million.
11. Are there any specific market keywords associated with the report?
Yes, the market keyword associated with the report is "APAC Small Cell Tower Industry," which aids in identifying and referencing the specific market segment covered.
12. How do I determine which pricing option suits my needs best?
The pricing options vary based on user requirements and access needs. Individual users may opt for single-user licenses, while businesses requiring broader access may choose multi-user or enterprise licenses for cost-effective access to the report.
13. Are there any additional resources or data provided in the APAC Small Cell Tower Industry report?
While the report offers comprehensive insights, it's advisable to review the specific contents or supplementary materials provided to ascertain if additional resources or data are available.
14. How can I stay updated on further developments or reports in the APAC Small Cell Tower Industry?
To stay informed about further developments, trends, and reports in the APAC Small Cell Tower Industry, consider subscribing to industry newsletters, following relevant companies and organizations, or regularly checking reputable industry news sources and publications.
Methodology
Step 1 - Identification of Relevant Samples Size from Population Database


Step 2 - Approaches for Defining Global Market Size (Value, Volume* & Price*)

Note*: In applicable scenarios
Step 3 - Data Sources
Primary Research
- Web Analytics
- Survey Reports
- Research Institute
- Latest Research Reports
- Opinion Leaders
Secondary Research
- Annual Reports
- White Paper
- Latest Press Release
- Industry Association
- Paid Database
- Investor Presentations

Step 4 - Data Triangulation
Involves using different sources of information in order to increase the validity of a study
These sources are likely to be stakeholders in a program - participants, other researchers, program staff, other community members, and so on.
Then we put all data in single framework & apply various statistical tools to find out the dynamic on the market.
During the analysis stage, feedback from the stakeholder groups would be compared to determine areas of agreement as well as areas of divergence
