

Key Insights
The Analytics as a Service (AaaS) market is experiencing robust growth, fueled by the increasing adoption of cloud computing, the proliferation of big data, and the rising demand for data-driven decision-making across various industries. The market's Compound Annual Growth Rate (CAGR) of 25% from 2019 to 2024 indicates a significant expansion, projected to continue into the forecast period (2025-2033). Key drivers include the need for real-time insights, cost optimization through subscription-based models, enhanced scalability and flexibility offered by cloud-based solutions, and the growing adoption of advanced analytics techniques like machine learning and AI. The market is segmented by enterprise size (SMEs and large enterprises), with large enterprises currently dominating due to their higher budgets and greater data volumes. However, the SME segment is anticipated to exhibit faster growth driven by increasing affordability and accessibility of AaaS solutions. Industry-wise, IT & Telecommunications, BFSI, and Healthcare sectors are prominent adopters, leveraging AaaS for improved customer experience, fraud detection, risk management, and personalized healthcare services.
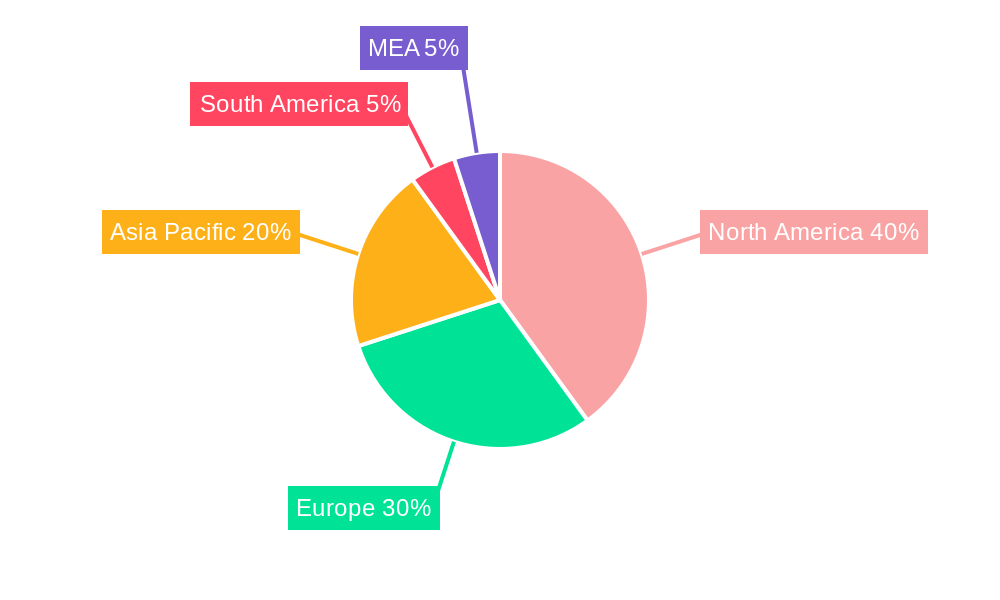
Significant regional variations exist, with North America currently leading the market due to early adoption and the presence of major technology companies. However, the Asia-Pacific region is poised for significant growth, driven by rapid digitalization, increasing internet penetration, and a burgeoning startup ecosystem. While the market faces restraints such as data security concerns, the lack of skilled analytics professionals, and integration complexities, these challenges are being addressed through advancements in security technologies, training programs, and improved platform integration capabilities. The continuous innovation in AaaS offerings, encompassing predictive analytics, prescriptive analytics, and embedded analytics, will further propel market growth. The competitive landscape is characterized by a mix of established players like IBM, Microsoft, and Oracle, and emerging specialized AaaS providers, creating a dynamic and innovative environment. This competitive pressure will further contribute to driving down costs and improving the quality and accessibility of AaaS solutions.
Analytics as a Service (AaaS) Industry Report: A Comprehensive Market Analysis (2019-2033)
This comprehensive report provides a detailed analysis of the Analytics as a Service (AaaS) industry, offering invaluable insights into market structure, competitive dynamics, growth drivers, and future trends. With a study period spanning 2019-2033, a base year of 2025, and a forecast period of 2025-2033, this report is essential for businesses seeking to understand and capitalize on the opportunities within this rapidly evolving sector. The report projects a market valued at $XX Million in 2025, experiencing a robust Compound Annual Growth Rate (CAGR) of XX% throughout the forecast period.
Analytics as a Service Industry Market Structure & Competitive Landscape
The AaaS market is characterized by a moderately concentrated landscape, with a few major players holding significant market share. However, the presence of numerous smaller, specialized providers creates a dynamic competitive environment. Innovation is a key driver, with continuous advancements in AI, machine learning, and big data technologies shaping product offerings and service capabilities. Regulatory impacts vary by region and industry, influencing data privacy and security practices. Product substitutes, such as on-premise analytics solutions, face challenges in competing with the scalability, cost-effectiveness, and accessibility of AaaS. The market exhibits strong segmentation by enterprise size (Small and Medium Enterprises (SMEs) and Large Enterprises) and end-user industry (IT and Telecommunication, Energy and Power, BFSI, Healthcare, Retail, Manufacturing, and Other End-user Industries). Mergers and acquisitions (M&A) activity is relatively high, indicating consolidation and strategic expansion within the industry. The five-year average M&A volume is estimated at $XX Million. Concentration ratios, while not uniformly high across all segments, suggest a developing trend towards consolidation among the leading AaaS providers.
- High Innovation: Continuous advancements in AI and machine learning are driving new features and capabilities.
- Regulatory Scrutiny: Data privacy regulations (e.g., GDPR, CCPA) significantly impact AaaS providers.
- Strong Segmentation: Market is clearly divided by enterprise size and end-user industry.
- Active M&A: Strategic acquisitions fuel growth and expand market reach for leading players.
Analytics as a Service Industry Market Trends & Opportunities
The AaaS market is experiencing significant growth, driven by the increasing adoption of cloud computing, the proliferation of big data, and the rising need for data-driven decision-making across diverse industries. The market size is projected to reach $XX Million by 2033, fueled by a CAGR of XX%. Technological advancements, such as the emergence of advanced analytics techniques and the development of user-friendly interfaces, are simplifying access to data analysis and insights. Consumer preference for flexible, on-demand services is further accelerating market penetration. However, competitive dynamics are intensifying, as established technology companies and specialized AaaS providers vie for market share. The increasing adoption of AI and machine learning is revolutionizing AaaS, opening doors for predictive analytics, real-time insights, and automation of complex analytical tasks. Market penetration rates are highest in the IT and Telecommunications sectors and are rapidly increasing in other industries due to advancements in data accessibility and reduction in implementation complexity.
Dominant Markets & Segments in Analytics as a Service Industry
The North American market currently holds a dominant position in the AaaS industry, followed by Europe and Asia-Pacific. Within the enterprise size segment, Large Enterprises represent a larger market share due to their greater data volumes and analytical needs. However, the SME segment shows significant growth potential. In terms of end-user industry, the IT and Telecommunications sector demonstrates the highest adoption rate.
- Key Growth Drivers in North America: Strong technological infrastructure, mature data analytics ecosystem, and high adoption of cloud technologies.
- Key Growth Drivers in Large Enterprises: Need for sophisticated analytics to enhance operational efficiency, improve decision-making, and gain a competitive edge.
- Key Growth Drivers in IT & Telecommunications: High data volumes, need for real-time insights, and strong investment in digital transformation.
Analytics as a Service Industry Product Analysis
AaaS offerings span a wide range of solutions, from basic data visualization tools to advanced predictive analytics platforms. Recent innovations include AI-powered automation, enhanced data security features, and integration with other cloud-based services. The competitive advantage lies in the ability to provide scalable, cost-effective, and user-friendly solutions that meet the specific needs of diverse industries and enterprise sizes. The market shows a preference towards platforms that offer high flexibility and ease of integration with existing IT infrastructures.
Key Drivers, Barriers & Challenges in Analytics as a Service Industry
Key Drivers: The increasing availability of big data, the rise of cloud computing, the growing demand for data-driven decision-making across industries, and advancements in AI and machine learning are the primary drivers of AaaS market growth. Government initiatives promoting digital transformation and data analytics further fuel this expansion.
Challenges: Data security and privacy concerns, the complexity of integrating AaaS solutions with existing IT infrastructure, and the high cost of implementation can hinder market growth. Competitive pressures from established technology giants and emerging players pose significant challenges. Supply chain disruptions can also impact the availability and cost of AaaS services. The estimated impact of supply chain issues on market growth is projected at a reduction of XX% in 2025.
Growth Drivers in the Analytics as a Service Industry Market
The growth of AaaS is fuelled by the rising need for data-driven decision-making, advancements in cloud computing and AI, increasing data volumes, and government initiatives promoting digital transformation. These factors create a favorable environment for the adoption of AaaS solutions across various industries.
Challenges Impacting Analytics as a Service Industry Growth
Regulatory complexities, data security concerns, and the high cost of implementation pose significant challenges. Competition from established players and the need for skilled professionals to implement and manage AaaS solutions further constrain growth.
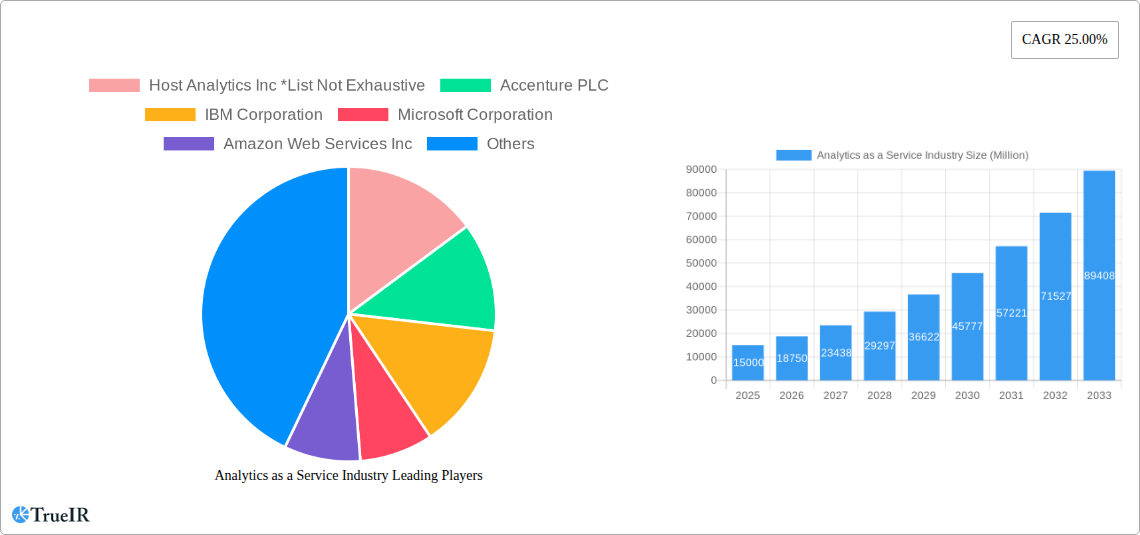
Key Players Shaping the Analytics as a Service Industry Market
- Host Analytics Inc
- Accenture PLC
- IBM Corporation
- Microsoft Corporation
- Amazon Web Services Inc
- SAS Institute
- Atos SE
- Opera Solutions LLC
- Hewlett-Packard Enterprise Company
- Oracle Corporation
- Google Inc
- SAP SE
Significant Analytics as a Service Industry Industry Milestones
- April 2022: Kyndryl expands its strategic partnership with SAP, offering enhanced services for digital transformation, including AI-driven data management and analytics solutions. This significantly boosts the adoption of AaaS solutions within enterprise clients leveraging SAP.
- August 2022: Morae Global Corporation and Intelligent Voice Limited partner to deliver AI-powered eDiscovery analytics, addressing the growing need for advanced analytics in legal and compliance sectors. This partnership expands the application of AaaS within a specialized niche.
Future Outlook for Analytics as a Service Industry Market
The AaaS market is poised for continued robust growth, driven by ongoing technological advancements, increasing demand for data-driven insights, and expanding adoption across various industries. Strategic partnerships, acquisitions, and the development of innovative solutions will shape the market landscape in the coming years. The market is expected to witness further consolidation, with larger players acquiring smaller specialized firms. New opportunities will arise in emerging technologies like edge analytics and the Internet of Things (IoT), further driving innovation and growth within the AaaS sector.
Analytics as a Service Industry Segmentation
-
1. Enterprise Size
- 1.1. Small and Medium Enterprises
- 1.2. Large Enterprises
-
2. End-User Industry
- 2.1. IT and Telecommunication
- 2.2. Energy and Power
- 2.3. BFSI
- 2.4. Healthcare
- 2.5. Retail
- 2.6. Manufacturing
- 2.7. Other End-user Industries
Analytics as a Service Industry Segmentation By Geography
- 1. North America
- 2. Europe
- 3. Asia Pacific
- 4. Latin America
- 5. Middle East and Africa
Analytics as a Service Industry REPORT HIGHLIGHTS
| Aspects | Details |
|---|---|
| Study Period | 2019-2033 |
| Base Year | 2024 |
| Estimated Year | 2025 |
| Forecast Period | 2025-2033 |
| Historical Period | 2019-2024 |
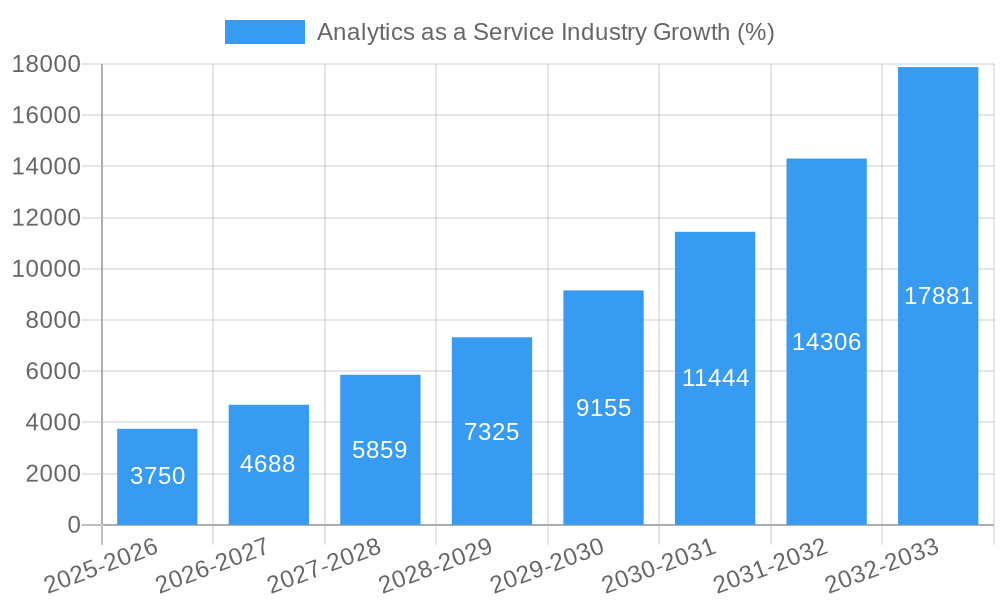
| Growth Rate | CAGR of 25.00% from 2019-2033 |
| Segmentation |
|
Table of Contents
- 1. Introduction
- 1.1. Research Scope
- 1.2. Market Segmentation
- 1.3. Research Methodology
- 1.4. Definitions and Assumptions
- 2. Executive Summary
- 2.1. Introduction
- 3. Market Dynamics
- 3.1. Introduction
- 3.2. Market Drivers
- 3.2.1. Increasing Cloud Adoption and Rise in the Data Volume Generated; Increasing Demand for Improving Organizations Internal Efficiency
- 3.3. Market Restrains
- 3.3.1. Data Security Concerns
- 3.4. Market Trends
- 3.4.1. Telecom and IT Segment to Grow Significantly
- 4. Market Factor Analysis
- 4.1. Porters Five Forces
- 4.2. Supply/Value Chain
- 4.3. PESTEL analysis
- 4.4. Market Entropy
- 4.5. Patent/Trademark Analysis
- 5. Global Analytics as a Service Industry Analysis, Insights and Forecast, 2019-2031
- 5.1. Market Analysis, Insights and Forecast - by Enterprise Size
- 5.1.1. Small and Medium Enterprises
- 5.1.2. Large Enterprises
- 5.2. Market Analysis, Insights and Forecast - by End-User Industry
- 5.2.1. IT and Telecommunication
- 5.2.2. Energy and Power
- 5.2.3. BFSI
- 5.2.4. Healthcare
- 5.2.5. Retail
- 5.2.6. Manufacturing
- 5.2.7. Other End-user Industries
- 5.3. Market Analysis, Insights and Forecast - by Region
- 5.3.1. North America
- 5.3.2. Europe
- 5.3.3. Asia Pacific
- 5.3.4. Latin America
- 5.3.5. Middle East and Africa
- 5.1. Market Analysis, Insights and Forecast - by Enterprise Size
- 6. North America Analytics as a Service Industry Analysis, Insights and Forecast, 2019-2031
- 6.1. Market Analysis, Insights and Forecast - by Enterprise Size
- 6.1.1. Small and Medium Enterprises
- 6.1.2. Large Enterprises
- 6.2. Market Analysis, Insights and Forecast - by End-User Industry
- 6.2.1. IT and Telecommunication
- 6.2.2. Energy and Power
- 6.2.3. BFSI
- 6.2.4. Healthcare
- 6.2.5. Retail
- 6.2.6. Manufacturing
- 6.2.7. Other End-user Industries
- 6.1. Market Analysis, Insights and Forecast - by Enterprise Size
- 7. Europe Analytics as a Service Industry Analysis, Insights and Forecast, 2019-2031
- 7.1. Market Analysis, Insights and Forecast - by Enterprise Size
- 7.1.1. Small and Medium Enterprises
- 7.1.2. Large Enterprises
- 7.2. Market Analysis, Insights and Forecast - by End-User Industry
- 7.2.1. IT and Telecommunication
- 7.2.2. Energy and Power
- 7.2.3. BFSI
- 7.2.4. Healthcare
- 7.2.5. Retail
- 7.2.6. Manufacturing
- 7.2.7. Other End-user Industries
- 7.1. Market Analysis, Insights and Forecast - by Enterprise Size
- 8. Asia Pacific Analytics as a Service Industry Analysis, Insights and Forecast, 2019-2031
- 8.1. Market Analysis, Insights and Forecast - by Enterprise Size
- 8.1.1. Small and Medium Enterprises
- 8.1.2. Large Enterprises
- 8.2. Market Analysis, Insights and Forecast - by End-User Industry
- 8.2.1. IT and Telecommunication
- 8.2.2. Energy and Power
- 8.2.3. BFSI
- 8.2.4. Healthcare
- 8.2.5. Retail
- 8.2.6. Manufacturing
- 8.2.7. Other End-user Industries
- 8.1. Market Analysis, Insights and Forecast - by Enterprise Size
- 9. Latin America Analytics as a Service Industry Analysis, Insights and Forecast, 2019-2031
- 9.1. Market Analysis, Insights and Forecast - by Enterprise Size
- 9.1.1. Small and Medium Enterprises
- 9.1.2. Large Enterprises
- 9.2. Market Analysis, Insights and Forecast - by End-User Industry
- 9.2.1. IT and Telecommunication
- 9.2.2. Energy and Power
- 9.2.3. BFSI
- 9.2.4. Healthcare
- 9.2.5. Retail
- 9.2.6. Manufacturing
- 9.2.7. Other End-user Industries
- 9.1. Market Analysis, Insights and Forecast - by Enterprise Size
- 10. Middle East and Africa Analytics as a Service Industry Analysis, Insights and Forecast, 2019-2031
- 10.1. Market Analysis, Insights and Forecast - by Enterprise Size
- 10.1.1. Small and Medium Enterprises
- 10.1.2. Large Enterprises
- 10.2. Market Analysis, Insights and Forecast - by End-User Industry
- 10.2.1. IT and Telecommunication
- 10.2.2. Energy and Power
- 10.2.3. BFSI
- 10.2.4. Healthcare
- 10.2.5. Retail
- 10.2.6. Manufacturing
- 10.2.7. Other End-user Industries
- 10.1. Market Analysis, Insights and Forecast - by Enterprise Size
- 11. North America Analytics as a Service Industry Analysis, Insights and Forecast, 2019-2031
- 11.1. Market Analysis, Insights and Forecast - By Country/Sub-region
- 11.1.1 United States
- 11.1.2 Canada
- 11.1.3 Mexico
- 12. Europe Analytics as a Service Industry Analysis, Insights and Forecast, 2019-2031
- 12.1. Market Analysis, Insights and Forecast - By Country/Sub-region
- 12.1.1 Germany
- 12.1.2 United Kingdom
- 12.1.3 France
- 12.1.4 Spain
- 12.1.5 Italy
- 12.1.6 Spain
- 12.1.7 Belgium
- 12.1.8 Netherland
- 12.1.9 Nordics
- 12.1.10 Rest of Europe
- 13. Asia Pacific Analytics as a Service Industry Analysis, Insights and Forecast, 2019-2031
- 13.1. Market Analysis, Insights and Forecast - By Country/Sub-region
- 13.1.1 China
- 13.1.2 Japan
- 13.1.3 India
- 13.1.4 South Korea
- 13.1.5 Southeast Asia
- 13.1.6 Australia
- 13.1.7 Indonesia
- 13.1.8 Phillipes
- 13.1.9 Singapore
- 13.1.10 Thailandc
- 13.1.11 Rest of Asia Pacific
- 14. South America Analytics as a Service Industry Analysis, Insights and Forecast, 2019-2031
- 14.1. Market Analysis, Insights and Forecast - By Country/Sub-region
- 14.1.1 Brazil
- 14.1.2 Argentina
- 14.1.3 Peru
- 14.1.4 Chile
- 14.1.5 Colombia
- 14.1.6 Ecuador
- 14.1.7 Venezuela
- 14.1.8 Rest of South America
- 15. North America Analytics as a Service Industry Analysis, Insights and Forecast, 2019-2031
- 15.1. Market Analysis, Insights and Forecast - By Country/Sub-region
- 15.1.1 United States
- 15.1.2 Canada
- 15.1.3 Mexico
- 16. MEA Analytics as a Service Industry Analysis, Insights and Forecast, 2019-2031
- 16.1. Market Analysis, Insights and Forecast - By Country/Sub-region
- 16.1.1 United Arab Emirates
- 16.1.2 Saudi Arabia
- 16.1.3 South Africa
- 16.1.4 Rest of Middle East and Africa
- 17. Competitive Analysis
- 17.1. Global Market Share Analysis 2024
- 17.2. Company Profiles
- 17.2.1 Host Analytics Inc *List Not Exhaustive
- 17.2.1.1. Overview
- 17.2.1.2. Products
- 17.2.1.3. SWOT Analysis
- 17.2.1.4. Recent Developments
- 17.2.1.5. Financials (Based on Availability)
- 17.2.2 Accenture PLC
- 17.2.2.1. Overview
- 17.2.2.2. Products
- 17.2.2.3. SWOT Analysis
- 17.2.2.4. Recent Developments
- 17.2.2.5. Financials (Based on Availability)
- 17.2.3 IBM Corporation
- 17.2.3.1. Overview
- 17.2.3.2. Products
- 17.2.3.3. SWOT Analysis
- 17.2.3.4. Recent Developments
- 17.2.3.5. Financials (Based on Availability)
- 17.2.4 Microsoft Corporation
- 17.2.4.1. Overview
- 17.2.4.2. Products
- 17.2.4.3. SWOT Analysis
- 17.2.4.4. Recent Developments
- 17.2.4.5. Financials (Based on Availability)
- 17.2.5 Amazon Web Services Inc
- 17.2.5.1. Overview
- 17.2.5.2. Products
- 17.2.5.3. SWOT Analysis
- 17.2.5.4. Recent Developments
- 17.2.5.5. Financials (Based on Availability)
- 17.2.6 SAS Institute
- 17.2.6.1. Overview
- 17.2.6.2. Products
- 17.2.6.3. SWOT Analysis
- 17.2.6.4. Recent Developments
- 17.2.6.5. Financials (Based on Availability)
- 17.2.7 Atos SE
- 17.2.7.1. Overview
- 17.2.7.2. Products
- 17.2.7.3. SWOT Analysis
- 17.2.7.4. Recent Developments
- 17.2.7.5. Financials (Based on Availability)
- 17.2.8 Opera Solutions LLC
- 17.2.8.1. Overview
- 17.2.8.2. Products
- 17.2.8.3. SWOT Analysis
- 17.2.8.4. Recent Developments
- 17.2.8.5. Financials (Based on Availability)
- 17.2.9 Hewlett-Packard Enterprise Company
- 17.2.9.1. Overview
- 17.2.9.2. Products
- 17.2.9.3. SWOT Analysis
- 17.2.9.4. Recent Developments
- 17.2.9.5. Financials (Based on Availability)
- 17.2.10 Oracle Corporation
- 17.2.10.1. Overview
- 17.2.10.2. Products
- 17.2.10.3. SWOT Analysis
- 17.2.10.4. Recent Developments
- 17.2.10.5. Financials (Based on Availability)
- 17.2.11 Google Inc
- 17.2.11.1. Overview
- 17.2.11.2. Products
- 17.2.11.3. SWOT Analysis
- 17.2.11.4. Recent Developments
- 17.2.11.5. Financials (Based on Availability)
- 17.2.12 SAP SE
- 17.2.12.1. Overview
- 17.2.12.2. Products
- 17.2.12.3. SWOT Analysis
- 17.2.12.4. Recent Developments
- 17.2.12.5. Financials (Based on Availability)
- 17.2.1 Host Analytics Inc *List Not Exhaustive
List of Figures
- Figure 1: Global Analytics as a Service Industry Revenue Breakdown (Million, %) by Region 2024 & 2032
- Figure 2: North America Analytics as a Service Industry Revenue (Million), by Country 2024 & 2032
- Figure 3: North America Analytics as a Service Industry Revenue Share (%), by Country 2024 & 2032
- Figure 4: Europe Analytics as a Service Industry Revenue (Million), by Country 2024 & 2032
- Figure 5: Europe Analytics as a Service Industry Revenue Share (%), by Country 2024 & 2032
- Figure 6: Asia Pacific Analytics as a Service Industry Revenue (Million), by Country 2024 & 2032
- Figure 7: Asia Pacific Analytics as a Service Industry Revenue Share (%), by Country 2024 & 2032
- Figure 8: South America Analytics as a Service Industry Revenue (Million), by Country 2024 & 2032
- Figure 9: South America Analytics as a Service Industry Revenue Share (%), by Country 2024 & 2032
- Figure 10: North America Analytics as a Service Industry Revenue (Million), by Country 2024 & 2032
- Figure 11: North America Analytics as a Service Industry Revenue Share (%), by Country 2024 & 2032
- Figure 12: MEA Analytics as a Service Industry Revenue (Million), by Country 2024 & 2032
- Figure 13: MEA Analytics as a Service Industry Revenue Share (%), by Country 2024 & 2032
- Figure 14: North America Analytics as a Service Industry Revenue (Million), by Enterprise Size 2024 & 2032
- Figure 15: North America Analytics as a Service Industry Revenue Share (%), by Enterprise Size 2024 & 2032
- Figure 16: North America Analytics as a Service Industry Revenue (Million), by End-User Industry 2024 & 2032
- Figure 17: North America Analytics as a Service Industry Revenue Share (%), by End-User Industry 2024 & 2032
- Figure 18: North America Analytics as a Service Industry Revenue (Million), by Country 2024 & 2032
- Figure 19: North America Analytics as a Service Industry Revenue Share (%), by Country 2024 & 2032
- Figure 20: Europe Analytics as a Service Industry Revenue (Million), by Enterprise Size 2024 & 2032
- Figure 21: Europe Analytics as a Service Industry Revenue Share (%), by Enterprise Size 2024 & 2032
- Figure 22: Europe Analytics as a Service Industry Revenue (Million), by End-User Industry 2024 & 2032
- Figure 23: Europe Analytics as a Service Industry Revenue Share (%), by End-User Industry 2024 & 2032
- Figure 24: Europe Analytics as a Service Industry Revenue (Million), by Country 2024 & 2032
- Figure 25: Europe Analytics as a Service Industry Revenue Share (%), by Country 2024 & 2032
- Figure 26: Asia Pacific Analytics as a Service Industry Revenue (Million), by Enterprise Size 2024 & 2032
- Figure 27: Asia Pacific Analytics as a Service Industry Revenue Share (%), by Enterprise Size 2024 & 2032
- Figure 28: Asia Pacific Analytics as a Service Industry Revenue (Million), by End-User Industry 2024 & 2032
- Figure 29: Asia Pacific Analytics as a Service Industry Revenue Share (%), by End-User Industry 2024 & 2032
- Figure 30: Asia Pacific Analytics as a Service Industry Revenue (Million), by Country 2024 & 2032
- Figure 31: Asia Pacific Analytics as a Service Industry Revenue Share (%), by Country 2024 & 2032
- Figure 32: Latin America Analytics as a Service Industry Revenue (Million), by Enterprise Size 2024 & 2032
- Figure 33: Latin America Analytics as a Service Industry Revenue Share (%), by Enterprise Size 2024 & 2032
- Figure 34: Latin America Analytics as a Service Industry Revenue (Million), by End-User Industry 2024 & 2032
- Figure 35: Latin America Analytics as a Service Industry Revenue Share (%), by End-User Industry 2024 & 2032
- Figure 36: Latin America Analytics as a Service Industry Revenue (Million), by Country 2024 & 2032
- Figure 37: Latin America Analytics as a Service Industry Revenue Share (%), by Country 2024 & 2032
- Figure 38: Middle East and Africa Analytics as a Service Industry Revenue (Million), by Enterprise Size 2024 & 2032
- Figure 39: Middle East and Africa Analytics as a Service Industry Revenue Share (%), by Enterprise Size 2024 & 2032
- Figure 40: Middle East and Africa Analytics as a Service Industry Revenue (Million), by End-User Industry 2024 & 2032
- Figure 41: Middle East and Africa Analytics as a Service Industry Revenue Share (%), by End-User Industry 2024 & 2032
- Figure 42: Middle East and Africa Analytics as a Service Industry Revenue (Million), by Country 2024 & 2032
- Figure 43: Middle East and Africa Analytics as a Service Industry Revenue Share (%), by Country 2024 & 2032
List of Tables
- Table 1: Global Analytics as a Service Industry Revenue Million Forecast, by Region 2019 & 2032
- Table 2: Global Analytics as a Service Industry Revenue Million Forecast, by Enterprise Size 2019 & 2032
- Table 3: Global Analytics as a Service Industry Revenue Million Forecast, by End-User Industry 2019 & 2032
- Table 4: Global Analytics as a Service Industry Revenue Million Forecast, by Region 2019 & 2032
- Table 5: Global Analytics as a Service Industry Revenue Million Forecast, by Country 2019 & 2032
- Table 6: United States Analytics as a Service Industry Revenue (Million) Forecast, by Application 2019 & 2032
- Table 7: Canada Analytics as a Service Industry Revenue (Million) Forecast, by Application 2019 & 2032
- Table 8: Mexico Analytics as a Service Industry Revenue (Million) Forecast, by Application 2019 & 2032
- Table 9: Global Analytics as a Service Industry Revenue Million Forecast, by Country 2019 & 2032
- Table 10: Germany Analytics as a Service Industry Revenue (Million) Forecast, by Application 2019 & 2032
- Table 11: United Kingdom Analytics as a Service Industry Revenue (Million) Forecast, by Application 2019 & 2032
- Table 12: France Analytics as a Service Industry Revenue (Million) Forecast, by Application 2019 & 2032
- Table 13: Spain Analytics as a Service Industry Revenue (Million) Forecast, by Application 2019 & 2032
- Table 14: Italy Analytics as a Service Industry Revenue (Million) Forecast, by Application 2019 & 2032
- Table 15: Spain Analytics as a Service Industry Revenue (Million) Forecast, by Application 2019 & 2032
- Table 16: Belgium Analytics as a Service Industry Revenue (Million) Forecast, by Application 2019 & 2032
- Table 17: Netherland Analytics as a Service Industry Revenue (Million) Forecast, by Application 2019 & 2032
- Table 18: Nordics Analytics as a Service Industry Revenue (Million) Forecast, by Application 2019 & 2032
- Table 19: Rest of Europe Analytics as a Service Industry Revenue (Million) Forecast, by Application 2019 & 2032
- Table 20: Global Analytics as a Service Industry Revenue Million Forecast, by Country 2019 & 2032
- Table 21: China Analytics as a Service Industry Revenue (Million) Forecast, by Application 2019 & 2032
- Table 22: Japan Analytics as a Service Industry Revenue (Million) Forecast, by Application 2019 & 2032
- Table 23: India Analytics as a Service Industry Revenue (Million) Forecast, by Application 2019 & 2032
- Table 24: South Korea Analytics as a Service Industry Revenue (Million) Forecast, by Application 2019 & 2032
- Table 25: Southeast Asia Analytics as a Service Industry Revenue (Million) Forecast, by Application 2019 & 2032
- Table 26: Australia Analytics as a Service Industry Revenue (Million) Forecast, by Application 2019 & 2032
- Table 27: Indonesia Analytics as a Service Industry Revenue (Million) Forecast, by Application 2019 & 2032
- Table 28: Phillipes Analytics as a Service Industry Revenue (Million) Forecast, by Application 2019 & 2032
- Table 29: Singapore Analytics as a Service Industry Revenue (Million) Forecast, by Application 2019 & 2032
- Table 30: Thailandc Analytics as a Service Industry Revenue (Million) Forecast, by Application 2019 & 2032
- Table 31: Rest of Asia Pacific Analytics as a Service Industry Revenue (Million) Forecast, by Application 2019 & 2032
- Table 32: Global Analytics as a Service Industry Revenue Million Forecast, by Country 2019 & 2032
- Table 33: Brazil Analytics as a Service Industry Revenue (Million) Forecast, by Application 2019 & 2032
- Table 34: Argentina Analytics as a Service Industry Revenue (Million) Forecast, by Application 2019 & 2032
- Table 35: Peru Analytics as a Service Industry Revenue (Million) Forecast, by Application 2019 & 2032
- Table 36: Chile Analytics as a Service Industry Revenue (Million) Forecast, by Application 2019 & 2032
- Table 37: Colombia Analytics as a Service Industry Revenue (Million) Forecast, by Application 2019 & 2032
- Table 38: Ecuador Analytics as a Service Industry Revenue (Million) Forecast, by Application 2019 & 2032
- Table 39: Venezuela Analytics as a Service Industry Revenue (Million) Forecast, by Application 2019 & 2032
- Table 40: Rest of South America Analytics as a Service Industry Revenue (Million) Forecast, by Application 2019 & 2032
- Table 41: Global Analytics as a Service Industry Revenue Million Forecast, by Country 2019 & 2032
- Table 42: United States Analytics as a Service Industry Revenue (Million) Forecast, by Application 2019 & 2032
- Table 43: Canada Analytics as a Service Industry Revenue (Million) Forecast, by Application 2019 & 2032
- Table 44: Mexico Analytics as a Service Industry Revenue (Million) Forecast, by Application 2019 & 2032
- Table 45: Global Analytics as a Service Industry Revenue Million Forecast, by Country 2019 & 2032
- Table 46: United Arab Emirates Analytics as a Service Industry Revenue (Million) Forecast, by Application 2019 & 2032
- Table 47: Saudi Arabia Analytics as a Service Industry Revenue (Million) Forecast, by Application 2019 & 2032
- Table 48: South Africa Analytics as a Service Industry Revenue (Million) Forecast, by Application 2019 & 2032
- Table 49: Rest of Middle East and Africa Analytics as a Service Industry Revenue (Million) Forecast, by Application 2019 & 2032
- Table 50: Global Analytics as a Service Industry Revenue Million Forecast, by Enterprise Size 2019 & 2032
- Table 51: Global Analytics as a Service Industry Revenue Million Forecast, by End-User Industry 2019 & 2032
- Table 52: Global Analytics as a Service Industry Revenue Million Forecast, by Country 2019 & 2032
- Table 53: Global Analytics as a Service Industry Revenue Million Forecast, by Enterprise Size 2019 & 2032
- Table 54: Global Analytics as a Service Industry Revenue Million Forecast, by End-User Industry 2019 & 2032
- Table 55: Global Analytics as a Service Industry Revenue Million Forecast, by Country 2019 & 2032
- Table 56: Global Analytics as a Service Industry Revenue Million Forecast, by Enterprise Size 2019 & 2032
- Table 57: Global Analytics as a Service Industry Revenue Million Forecast, by End-User Industry 2019 & 2032
- Table 58: Global Analytics as a Service Industry Revenue Million Forecast, by Country 2019 & 2032
- Table 59: Global Analytics as a Service Industry Revenue Million Forecast, by Enterprise Size 2019 & 2032
- Table 60: Global Analytics as a Service Industry Revenue Million Forecast, by End-User Industry 2019 & 2032
- Table 61: Global Analytics as a Service Industry Revenue Million Forecast, by Country 2019 & 2032
- Table 62: Global Analytics as a Service Industry Revenue Million Forecast, by Enterprise Size 2019 & 2032
- Table 63: Global Analytics as a Service Industry Revenue Million Forecast, by End-User Industry 2019 & 2032
- Table 64: Global Analytics as a Service Industry Revenue Million Forecast, by Country 2019 & 2032
Frequently Asked Questions
1. What is the projected Compound Annual Growth Rate (CAGR) of the Analytics as a Service Industry?
The projected CAGR is approximately 25.00%.
2. Which companies are prominent players in the Analytics as a Service Industry?
Key companies in the market include Host Analytics Inc *List Not Exhaustive, Accenture PLC, IBM Corporation, Microsoft Corporation, Amazon Web Services Inc, SAS Institute, Atos SE, Opera Solutions LLC, Hewlett-Packard Enterprise Company, Oracle Corporation, Google Inc, SAP SE.
3. What are the main segments of the Analytics as a Service Industry?
The market segments include Enterprise Size, End-User Industry.
4. Can you provide details about the market size?
The market size is estimated to be USD XX Million as of 2022.
5. What are some drivers contributing to market growth?
Increasing Cloud Adoption and Rise in the Data Volume Generated; Increasing Demand for Improving Organizations Internal Efficiency.
6. What are the notable trends driving market growth?
Telecom and IT Segment to Grow Significantly.
7. Are there any restraints impacting market growth?
Data Security Concerns.
8. Can you provide examples of recent developments in the market?
April 2022 - Kyndryl announced the expansion of strategic partnership with SAP to assist customers in overcoming digital transformation challenges Kyndryl will provide services that complement the RISE with an SAP solution, such as proven migration tools and scalable offerings, AI-driven business data management and analytics solutions, application modernization, and more, as part of the expanded collaboration.
9. What pricing options are available for accessing the report?
Pricing options include single-user, multi-user, and enterprise licenses priced at USD 4750, USD 5250, and USD 8750 respectively.
10. Is the market size provided in terms of value or volume?
The market size is provided in terms of value, measured in Million.
11. Are there any specific market keywords associated with the report?
Yes, the market keyword associated with the report is "Analytics as a Service Industry," which aids in identifying and referencing the specific market segment covered.
12. How do I determine which pricing option suits my needs best?
The pricing options vary based on user requirements and access needs. Individual users may opt for single-user licenses, while businesses requiring broader access may choose multi-user or enterprise licenses for cost-effective access to the report.
13. Are there any additional resources or data provided in the Analytics as a Service Industry report?
While the report offers comprehensive insights, it's advisable to review the specific contents or supplementary materials provided to ascertain if additional resources or data are available.
14. How can I stay updated on further developments or reports in the Analytics as a Service Industry?
To stay informed about further developments, trends, and reports in the Analytics as a Service Industry, consider subscribing to industry newsletters, following relevant companies and organizations, or regularly checking reputable industry news sources and publications.
Methodology
Step 1 - Identification of Relevant Samples Size from Population Database


Step 2 - Approaches for Defining Global Market Size (Value, Volume* & Price*)

Note*: In applicable scenarios
Step 3 - Data Sources
Primary Research
- Web Analytics
- Survey Reports
- Research Institute
- Latest Research Reports
- Opinion Leaders
Secondary Research
- Annual Reports
- White Paper
- Latest Press Release
- Industry Association
- Paid Database
- Investor Presentations

Step 4 - Data Triangulation
Involves using different sources of information in order to increase the validity of a study
These sources are likely to be stakeholders in a program - participants, other researchers, program staff, other community members, and so on.
Then we put all data in single framework & apply various statistical tools to find out the dynamic on the market.
During the analysis stage, feedback from the stakeholder groups would be compared to determine areas of agreement as well as areas of divergence
