

Key Insights
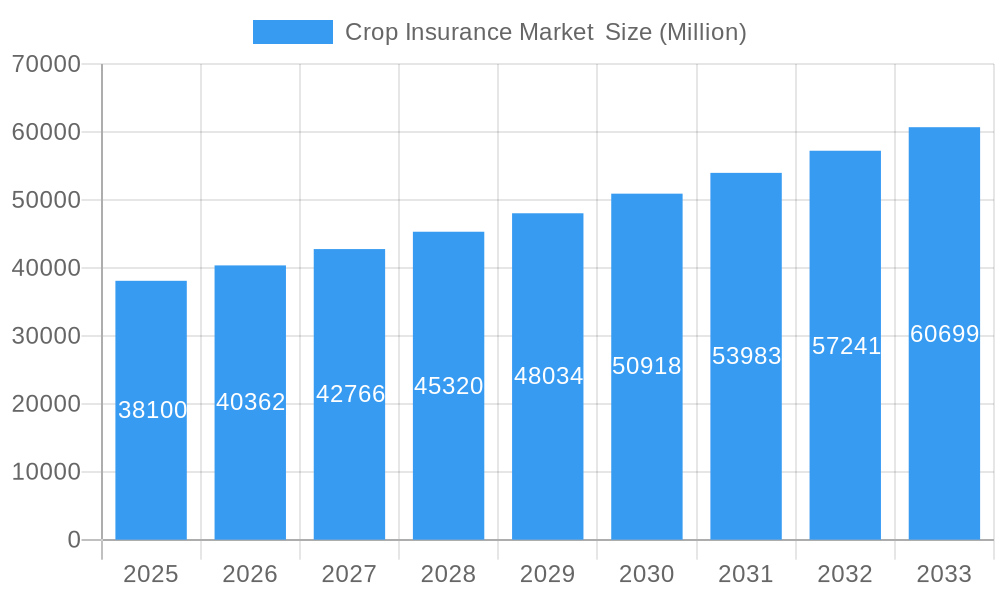
The global crop insurance market, valued at $38.10 billion in 2025, is projected to experience robust growth, exhibiting a compound annual growth rate (CAGR) of 5.77% from 2025 to 2033. This expansion is driven by several key factors. Increasing frequency and severity of extreme weather events, including droughts, floods, and heatwaves, are significantly impacting agricultural yields, compelling farmers to seek robust risk mitigation strategies. Furthermore, growing government initiatives promoting agricultural insurance and providing subsidies are boosting market adoption. Technological advancements, such as remote sensing and precision agriculture, are enhancing risk assessment and claims processing, leading to improved efficiency and reduced costs within the insurance ecosystem. The diversification of crop insurance products, encompassing various perils and coverage options tailored to specific crop types and farming practices, is another significant growth driver. The market segments show strong potential, with multiple peril crop insurance and revenue coverage options gaining traction due to their comprehensive risk protection. The Asia-Pacific region, particularly India and China, are expected to witness substantial growth fueled by expanding agricultural sectors and rising farmer awareness of insurance benefits. However, challenges remain, including limited access to insurance in underdeveloped regions, lack of awareness among farmers, and complex claim settlement processes that can deter participation. Addressing these hurdles through targeted educational campaigns, simplified insurance products, and improved technological infrastructure is crucial for unlocking the full potential of the crop insurance market.
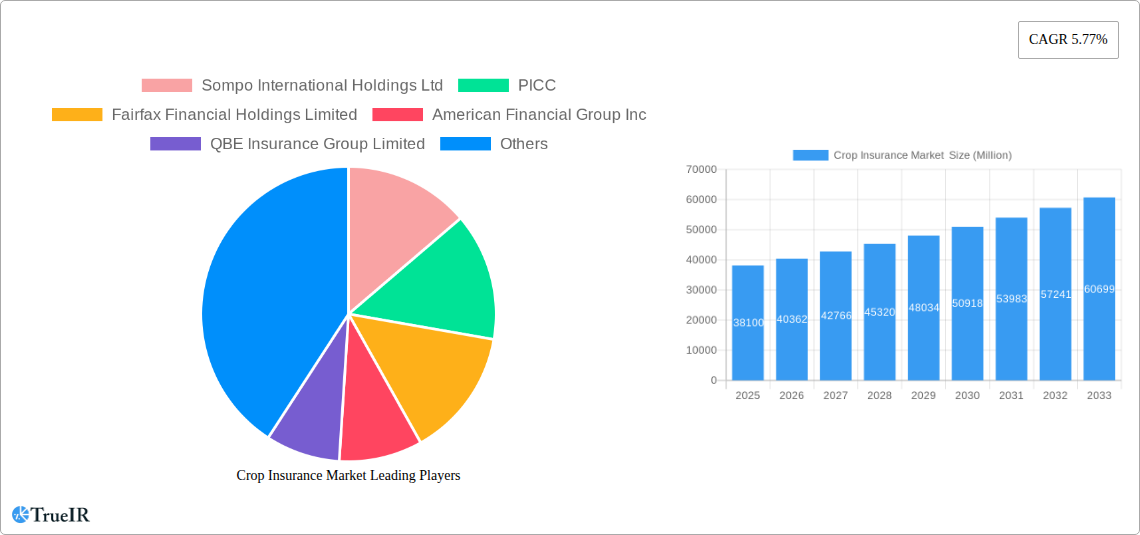
Crop Insurance Market Market Size (In Billion)
The competitive landscape is characterized by a mix of global players and regional insurers. Companies like Sompo International, PICC, Fairfax Financial, and others are actively expanding their presence in this market through strategic partnerships, product innovation, and geographical expansion. The insurance market for crops presents a compelling investment opportunity as demand for robust risk management solutions among farmers is set to increase significantly. Further growth is expected from increased adoption of digital platforms, particularly in developing countries, leading to improved access and reduced administrative costs. The focus on sustainable agricultural practices and climate-resilient crops will further influence the demand for specialized crop insurance products, contributing to overall market expansion. This highlights the importance of adapting to evolving technological and agricultural landscapes to stay competitive within this dynamic market.
Crop Insurance Market Company Market Share
Crop Insurance Market: A Comprehensive Report (2019-2033)
This dynamic report provides a detailed analysis of the Crop Insurance Market, encompassing historical data (2019-2024), current estimates (2025), and future forecasts (2025-2033). It offers invaluable insights into market trends, competitive dynamics, key players, and growth opportunities, making it an essential resource for industry stakeholders, investors, and researchers. The report's robust methodology and comprehensive data ensure actionable intelligence for strategic decision-making. The market is projected to reach xx Million by 2033, exhibiting a CAGR of xx% during the forecast period.
Crop Insurance Market Structure & Competitive Landscape
The global crop insurance market is characterized by a moderately concentrated landscape, with several multinational players dominating the market share. The top ten companies (including Sompo International Holdings Ltd, PICC, Fairfax Financial Holdings Limited, American Financial Group Inc, QBE Insurance Group Limited, ICICI Lombard General Insurance Company Limited, Zurich, Chubb, Tokio Marine HCC, and Agriculture Insurance Company of India Limited (AIC)), control an estimated xx% of the market. However, a significant number of smaller regional and specialized players contribute to the overall market volume.
Market Concentration: The Herfindahl-Hirschman Index (HHI) for the market is estimated at xx, indicating a moderately concentrated market.
Innovation Drivers: Technological advancements like remote sensing, AI-powered risk assessment, and blockchain-based claims processing are driving innovation and efficiency within the industry.
Regulatory Impacts: Government regulations and subsidies significantly influence market growth and penetration rates, especially in developing countries. Changes in agricultural policies and insurance regulations directly impact market dynamics.
Product Substitutes: While direct substitutes for crop insurance are limited, alternative risk management strategies, such as diversification and hedging techniques, can partially mitigate the need for insurance.
End-User Segmentation: The market is segmented based on farm size, crop type, and geographic location, with larger farms and high-value crops driving higher insurance demand.
M&A Trends: The recent acquisition of Crop Risk Services (CRS) by American Financial Group in July 2023 reflects the ongoing consolidation within the market, signaling further M&A activity in the coming years. The total volume of M&A deals in the last five years is estimated at xx transactions, indicating a dynamic and evolving competitive landscape.
Crop Insurance Market Trends & Opportunities
The crop insurance market is experiencing substantial growth driven by several key factors. The increasing frequency and intensity of extreme weather events, coupled with rising agricultural commodity prices, are compelling farmers to seek greater risk protection. Technological advancements such as precision agriculture, remote sensing, and data analytics are leading to more accurate risk assessments and efficient claims processing. This has fostered the development of innovative insurance products tailored to specific crop types and geographic locations. Furthermore, government support through subsidies and favorable policies is playing a pivotal role in enhancing market penetration, particularly in developing economies. The market’s CAGR during the forecast period (2025-2033) is projected to be xx%, surpassing the historical CAGR of xx% (2019-2024). The overall market size is expected to increase from xx Million in 2025 to xx Million by 2033. This growth is further fueled by changing consumer preferences – farmers are increasingly demanding customized insurance solutions that effectively address their unique needs and vulnerabilities. The competitive dynamics are characterized by both fierce competition among established players and the emergence of new entrants with innovative offerings. Market penetration rates are expected to improve, driven by increased awareness, better product offerings, and supportive government policies.
Dominant Markets & Segments in Crop Insurance Market
The North American market currently holds the largest share of the global crop insurance market, followed by Asia-Pacific and Europe. Within these regions, specific countries with extensive agricultural sectors and favorable regulatory environments exhibit particularly high growth potential.
By Coverage:
- Standing Crop Loss: This segment is the largest, driven by the vulnerability of crops to various weather-related risks.
- Multiple Peril Crop Insurance: The popularity of this comprehensive coverage type is on the rise.
- Sowing/Planting/Germination Risk: This segment is significant, particularly in areas with unpredictable weather patterns.
- Post-Harvest Losses: Growing awareness of post-harvest risks is driving demand for this specialized coverage.
- Localized Calamities: This segment showcases significant growth, particularly in areas prone to specific localized events.
By Distribution Channel:
- Insurance Companies: This is the dominant distribution channel, leveraging extensive networks and expertise.
- Banks: Banks are increasingly integrating crop insurance into their services, expanding access to farmers.
- Brokers and Agents: These intermediaries play a vital role, providing customized solutions and supporting farmers.
By Type:
- Multiple Peril Crop Insurance: This segment is experiencing the fastest growth, driven by its comprehensive nature.
- Actual Production History (APH): This remains a significant type of insurance in established markets.
- Crop Revenue Coverage (CRC): The popularity of CRC is growing due to its focus on income protection.
Key Growth Drivers:
- Government subsidies and policies: Government support remains crucial in driving market expansion, especially in developing economies.
- Technological advancements: Innovations in remote sensing, AI, and data analytics are enhancing risk assessment and claims processing.
- Increased awareness among farmers: Growing understanding of the benefits of crop insurance is leading to higher adoption rates.
Crop Insurance Market Product Analysis
Technological advancements have fueled the development of sophisticated crop insurance products that leverage remote sensing, AI, and machine learning to assess risk more precisely and efficiently. These innovations lead to better pricing models, reducing premiums for low-risk farmers while providing more comprehensive coverage for high-risk ones. The market is also seeing a rise in tailored products that cater to specific crop types, geographical locations, and farming practices. These customized solutions improve market fit and enhance farmer adoption rates. This focus on personalized insurance products and innovative risk assessment techniques drives the market's overall growth.
Key Drivers, Barriers & Challenges in Crop Insurance Market
Key Drivers: Favorable government policies and subsidies, coupled with rising agricultural commodity prices and increasing weather-related risks, are driving strong market growth. Technological advancements in risk assessment and claims processing also significantly enhance efficiency and adoption rates.
Challenges and Restraints: Several factors hinder the growth of the crop insurance market. These include high premiums and complex claim procedures that can make insurance inaccessible for some smallholder farmers, as well as inadequate infrastructure and data availability in certain regions. Furthermore, stringent regulatory frameworks and competitive pressures among insurers pose significant challenges. The estimated impact of these challenges on market growth is around xx Million annually.
Growth Drivers in the Crop Insurance Market Market
Technological advancements, government support through subsidies and favorable policies, and the increasing frequency of extreme weather events all contribute to the significant growth observed in the crop insurance market. Specifically, AI-driven risk assessment tools and remote sensing technologies enhance efficiency and accuracy in assessing risk and streamlining claims processing.
Challenges Impacting Crop Insurance Market Growth
Regulatory complexities, particularly concerning pricing and product design, hinder broader market penetration. Supply chain disruptions impacting agricultural production can result in significant uncertainties for insurers. Intense competition among various players in the market creates pricing pressures and limits profit margins.
Key Players Shaping the Crop Insurance Market Market
- Sompo International Holdings Ltd
- PICC
- Fairfax Financial Holdings Limited
- American Financial Group Inc
- QBE Insurance Group Limited
- ICICI Lombard General Insurance Company Limited
- Zurich
- Chubb
- Tokio Marine HCC
- Agriculture Insurance Company of India Limited (AIC)
Significant Crop Insurance Market Industry Milestones
- September 2023: Launch of the Shrimp Crop Insurance scheme in India by the Agricultural Insurance Company, extending insurance coverage from the initial stage to 130 days. This initiative expands the scope of crop insurance to non-traditional agricultural sectors.
- July 2023: American Financial Group (AFG)'s acquisition of Crop Risk Services (CRS) from AIG strengthens AFG's position as a major player in the US crop insurance market. This consolidation signifies ongoing industry restructuring.
Future Outlook for Crop Insurance Market Market
The crop insurance market is poised for continued growth, driven by increasing climate change-related risks, technological innovations, and supportive government policies. Strategic opportunities exist in developing customized insurance products for specific crops and regions, leveraging advanced technologies like AI and IoT for better risk management, and expanding into underserved markets, especially in developing economies. The market’s potential for expansion is significant, particularly in regions with vulnerable agricultural sectors and high exposure to climate risks.
Crop Insurance Market Segmentation
-
1. Type
- 1.1. Multiple Peril Crop Insurance
- 1.2. Actual Production History
- 1.3. Crop Revenue Coverage
-
2. Coverage
- 2.1. Localized Calamities
- 2.2. Sowing/Planting/Germination Risk
- 2.3. Standing Crop Loss
- 2.4. Post-harvest Losses
-
3. Distribution Channel
- 3.1. Banks
- 3.2. Insurance Companies
- 3.3. Brokers and Agents
- 3.4. Other Distribution Channels
Crop Insurance Market Segmentation By Geography
-
1. North America
- 1.1. United States
- 1.2. Canada
- 1.3. Mexico
-
2. South America
- 2.1. Brazil
- 2.2. Argentina
- 2.3. Rest of South America
-
3. Europe
- 3.1. United Kingdom
- 3.2. Germany
- 3.3. France
- 3.4. Italy
- 3.5. Spain
- 3.6. Russia
- 3.7. Benelux
- 3.8. Nordics
- 3.9. Rest of Europe
-
4. Middle East & Africa
- 4.1. Turkey
- 4.2. Israel
- 4.3. GCC
- 4.4. North Africa
- 4.5. South Africa
- 4.6. Rest of Middle East & Africa
-
5. Asia Pacific
- 5.1. China
- 5.2. India
- 5.3. Japan
- 5.4. South Korea
- 5.5. ASEAN
- 5.6. Oceania
- 5.7. Rest of Asia Pacific
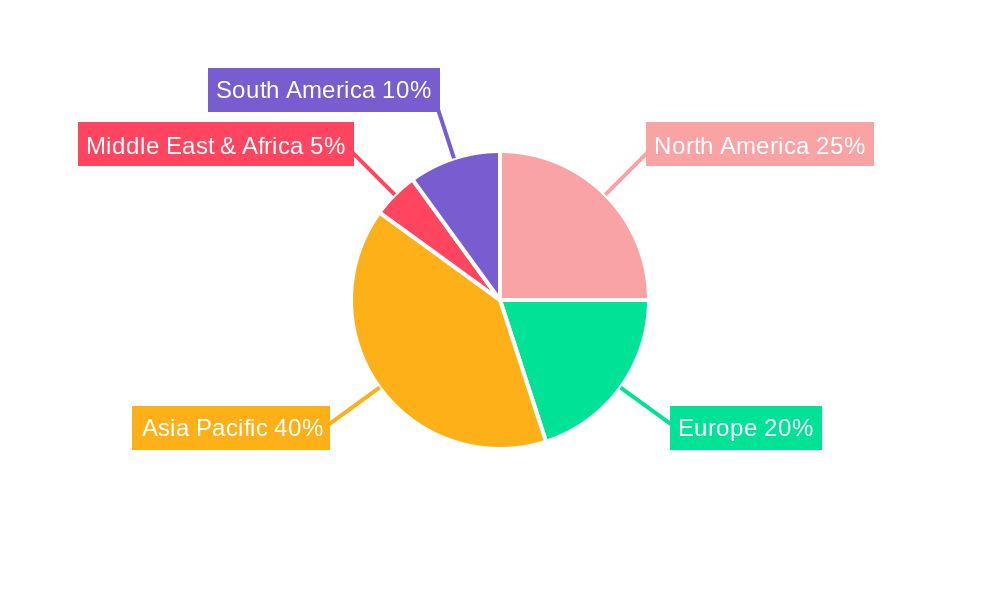
Crop Insurance Market Regional Market Share
Geographic Coverage of Crop Insurance Market
Crop Insurance Market REPORT HIGHLIGHTS
| Aspects | Details |
|---|---|
| Study Period | 2020-2034 |
| Base Year | 2025 |
| Estimated Year | 2026 |
| Forecast Period | 2026-2034 |
| Historical Period | 2020-2025 |
| Growth Rate | CAGR of 5.77% from 2020-2034 |
| Segmentation |
|
Table of Contents
- 1. Introduction
- 1.1. Research Scope
- 1.2. Market Segmentation
- 1.3. Research Objective
- 1.4. Definitions and Assumptions
- 2. Executive Summary
- 2.1. Market Snapshot
- 3. Market Dynamics
- 3.1. Market Drivers
- 3.2. Market Restrains
- 3.3. Market Trends
- 3.4. Market Opportunities
- 4. Market Factor Analysis
- 4.1. Porters Five Forces
- 4.1.1. Bargaining Power of Suppliers
- 4.1.2. Bargaining Power of Buyers
- 4.1.3. Threat of New Entrants
- 4.1.4. Threat of Substitutes
- 4.1.5. Competitive Rivalry
- 4.2. PESTEL analysis
- 4.3. BCG Analysis
- 4.3.1. Stars (High Growth, High Market Share)
- 4.3.2. Cash Cows (Low Growth, High Market Share)
- 4.3.3. Question Mark (High Growth, Low Market Share)
- 4.3.4. Dogs (Low Growth, Low Market Share)
- 4.4. Ansoff Matrix Analysis
- 4.5. Supply Chain Analysis
- 4.6. Regulatory Landscape
- 4.7. Current Market Potential and Opportunity Assessment (TAM–SAM–SOM Framework)
- 4.8. TIR Analyst Note
- 4.1. Porters Five Forces
- 5. Market Analysis, Insights and Forecast 2021-2033
- 5.1. Market Analysis, Insights and Forecast - by Type
- 5.1.1. Multiple Peril Crop Insurance
- 5.1.2. Actual Production History
- 5.1.3. Crop Revenue Coverage
- 5.2. Market Analysis, Insights and Forecast - by Coverage
- 5.2.1. Localized Calamities
- 5.2.2. Sowing/Planting/Germination Risk
- 5.2.3. Standing Crop Loss
- 5.2.4. Post-harvest Losses
- 5.3. Market Analysis, Insights and Forecast - by Distribution Channel
- 5.3.1. Banks
- 5.3.2. Insurance Companies
- 5.3.3. Brokers and Agents
- 5.3.4. Other Distribution Channels
- 5.4. Market Analysis, Insights and Forecast - by Region
- 5.4.1. North America
- 5.4.2. South America
- 5.4.3. Europe
- 5.4.4. Middle East & Africa
- 5.4.5. Asia Pacific
- 5.1. Market Analysis, Insights and Forecast - by Type
- 6. Global Crop Insurance Market Analysis, Insights and Forecast, 2021-2033
- 6.1. Market Analysis, Insights and Forecast - by Type
- 6.1.1. Multiple Peril Crop Insurance
- 6.1.2. Actual Production History
- 6.1.3. Crop Revenue Coverage
- 6.2. Market Analysis, Insights and Forecast - by Coverage
- 6.2.1. Localized Calamities
- 6.2.2. Sowing/Planting/Germination Risk
- 6.2.3. Standing Crop Loss
- 6.2.4. Post-harvest Losses
- 6.3. Market Analysis, Insights and Forecast - by Distribution Channel
- 6.3.1. Banks
- 6.3.2. Insurance Companies
- 6.3.3. Brokers and Agents
- 6.3.4. Other Distribution Channels
- 6.1. Market Analysis, Insights and Forecast - by Type
- 7. North America Crop Insurance Market Analysis, Insights and Forecast, 2020-2032
- 7.1. Market Analysis, Insights and Forecast - by Type
- 7.1.1. Multiple Peril Crop Insurance
- 7.1.2. Actual Production History
- 7.1.3. Crop Revenue Coverage
- 7.2. Market Analysis, Insights and Forecast - by Coverage
- 7.2.1. Localized Calamities
- 7.2.2. Sowing/Planting/Germination Risk
- 7.2.3. Standing Crop Loss
- 7.2.4. Post-harvest Losses
- 7.3. Market Analysis, Insights and Forecast - by Distribution Channel
- 7.3.1. Banks
- 7.3.2. Insurance Companies
- 7.3.3. Brokers and Agents
- 7.3.4. Other Distribution Channels
- 7.1. Market Analysis, Insights and Forecast - by Type
- 8. South America Crop Insurance Market Analysis, Insights and Forecast, 2020-2032
- 8.1. Market Analysis, Insights and Forecast - by Type
- 8.1.1. Multiple Peril Crop Insurance
- 8.1.2. Actual Production History
- 8.1.3. Crop Revenue Coverage
- 8.2. Market Analysis, Insights and Forecast - by Coverage
- 8.2.1. Localized Calamities
- 8.2.2. Sowing/Planting/Germination Risk
- 8.2.3. Standing Crop Loss
- 8.2.4. Post-harvest Losses
- 8.3. Market Analysis, Insights and Forecast - by Distribution Channel
- 8.3.1. Banks
- 8.3.2. Insurance Companies
- 8.3.3. Brokers and Agents
- 8.3.4. Other Distribution Channels
- 8.1. Market Analysis, Insights and Forecast - by Type
- 9. Europe Crop Insurance Market Analysis, Insights and Forecast, 2020-2032
- 9.1. Market Analysis, Insights and Forecast - by Type
- 9.1.1. Multiple Peril Crop Insurance
- 9.1.2. Actual Production History
- 9.1.3. Crop Revenue Coverage
- 9.2. Market Analysis, Insights and Forecast - by Coverage
- 9.2.1. Localized Calamities
- 9.2.2. Sowing/Planting/Germination Risk
- 9.2.3. Standing Crop Loss
- 9.2.4. Post-harvest Losses
- 9.3. Market Analysis, Insights and Forecast - by Distribution Channel
- 9.3.1. Banks
- 9.3.2. Insurance Companies
- 9.3.3. Brokers and Agents
- 9.3.4. Other Distribution Channels
- 9.1. Market Analysis, Insights and Forecast - by Type
- 10. Middle East & Africa Crop Insurance Market Analysis, Insights and Forecast, 2020-2032
- 10.1. Market Analysis, Insights and Forecast - by Type
- 10.1.1. Multiple Peril Crop Insurance
- 10.1.2. Actual Production History
- 10.1.3. Crop Revenue Coverage
- 10.2. Market Analysis, Insights and Forecast - by Coverage
- 10.2.1. Localized Calamities
- 10.2.2. Sowing/Planting/Germination Risk
- 10.2.3. Standing Crop Loss
- 10.2.4. Post-harvest Losses
- 10.3. Market Analysis, Insights and Forecast - by Distribution Channel
- 10.3.1. Banks
- 10.3.2. Insurance Companies
- 10.3.3. Brokers and Agents
- 10.3.4. Other Distribution Channels
- 10.1. Market Analysis, Insights and Forecast - by Type
- 11. Asia Pacific Crop Insurance Market Analysis, Insights and Forecast, 2020-2032
- 11.1. Market Analysis, Insights and Forecast - by Type
- 11.1.1. Multiple Peril Crop Insurance
- 11.1.2. Actual Production History
- 11.1.3. Crop Revenue Coverage
- 11.2. Market Analysis, Insights and Forecast - by Coverage
- 11.2.1. Localized Calamities
- 11.2.2. Sowing/Planting/Germination Risk
- 11.2.3. Standing Crop Loss
- 11.2.4. Post-harvest Losses
- 11.3. Market Analysis, Insights and Forecast - by Distribution Channel
- 11.3.1. Banks
- 11.3.2. Insurance Companies
- 11.3.3. Brokers and Agents
- 11.3.4. Other Distribution Channels
- 11.1. Market Analysis, Insights and Forecast - by Type
- 12. Competitive Analysis
- 12.1. Company Profiles
- 12.1.1 Sompo International Holdings Ltd
- 12.1.1.1. Company Overview
- 12.1.1.2. Products
- 12.1.1.3. Company Financials
- 12.1.1.4. SWOT Analysis
- 12.1.2 PICC
- 12.1.2.1. Company Overview
- 12.1.2.2. Products
- 12.1.2.3. Company Financials
- 12.1.2.4. SWOT Analysis
- 12.1.3 Fairfax Financial Holdings Limited
- 12.1.3.1. Company Overview
- 12.1.3.2. Products
- 12.1.3.3. Company Financials
- 12.1.3.4. SWOT Analysis
- 12.1.4 American Financial Group Inc
- 12.1.4.1. Company Overview
- 12.1.4.2. Products
- 12.1.4.3. Company Financials
- 12.1.4.4. SWOT Analysis
- 12.1.5 QBE Insurance Group Limited
- 12.1.5.1. Company Overview
- 12.1.5.2. Products
- 12.1.5.3. Company Financials
- 12.1.5.4. SWOT Analysis
- 12.1.6 ICICI Lombard General Insurance Company Limited
- 12.1.6.1. Company Overview
- 12.1.6.2. Products
- 12.1.6.3. Company Financials
- 12.1.6.4. SWOT Analysis
- 12.1.7 Zurich**List Not Exhaustive
- 12.1.7.1. Company Overview
- 12.1.7.2. Products
- 12.1.7.3. Company Financials
- 12.1.7.4. SWOT Analysis
- 12.1.8 Chubb
- 12.1.8.1. Company Overview
- 12.1.8.2. Products
- 12.1.8.3. Company Financials
- 12.1.8.4. SWOT Analysis
- 12.1.9 Tokio Marine HCC
- 12.1.9.1. Company Overview
- 12.1.9.2. Products
- 12.1.9.3. Company Financials
- 12.1.9.4. SWOT Analysis
- 12.1.10 Agriculture Insurance Company of India Limited (AIC)
- 12.1.10.1. Company Overview
- 12.1.10.2. Products
- 12.1.10.3. Company Financials
- 12.1.10.4. SWOT Analysis
- 12.1.1 Sompo International Holdings Ltd
- 12.2. Market Entropy
- 12.2.1 Company's Key Areas Served
- 12.2.2 Recent Developments
- 12.3. Company Market Share Analysis 2025
- 12.3.1 Top 5 Companies Market Share Analysis
- 12.3.2 Top 3 Companies Market Share Analysis
- 12.4. List of Potential Customers
- 13. Research Methodology
List of Figures
- Figure 1: Global Crop Insurance Market Revenue Breakdown (Million, %) by Region 2025 & 2033
- Figure 2: North America Crop Insurance Market Revenue (Million), by Type 2025 & 2033
- Figure 3: North America Crop Insurance Market Revenue Share (%), by Type 2025 & 2033
- Figure 4: North America Crop Insurance Market Revenue (Million), by Coverage 2025 & 2033
- Figure 5: North America Crop Insurance Market Revenue Share (%), by Coverage 2025 & 2033
- Figure 6: North America Crop Insurance Market Revenue (Million), by Distribution Channel 2025 & 2033
- Figure 7: North America Crop Insurance Market Revenue Share (%), by Distribution Channel 2025 & 2033
- Figure 8: North America Crop Insurance Market Revenue (Million), by Country 2025 & 2033
- Figure 9: North America Crop Insurance Market Revenue Share (%), by Country 2025 & 2033
- Figure 10: South America Crop Insurance Market Revenue (Million), by Type 2025 & 2033
- Figure 11: South America Crop Insurance Market Revenue Share (%), by Type 2025 & 2033
- Figure 12: South America Crop Insurance Market Revenue (Million), by Coverage 2025 & 2033
- Figure 13: South America Crop Insurance Market Revenue Share (%), by Coverage 2025 & 2033
- Figure 14: South America Crop Insurance Market Revenue (Million), by Distribution Channel 2025 & 2033
- Figure 15: South America Crop Insurance Market Revenue Share (%), by Distribution Channel 2025 & 2033
- Figure 16: South America Crop Insurance Market Revenue (Million), by Country 2025 & 2033
- Figure 17: South America Crop Insurance Market Revenue Share (%), by Country 2025 & 2033
- Figure 18: Europe Crop Insurance Market Revenue (Million), by Type 2025 & 2033
- Figure 19: Europe Crop Insurance Market Revenue Share (%), by Type 2025 & 2033
- Figure 20: Europe Crop Insurance Market Revenue (Million), by Coverage 2025 & 2033
- Figure 21: Europe Crop Insurance Market Revenue Share (%), by Coverage 2025 & 2033
- Figure 22: Europe Crop Insurance Market Revenue (Million), by Distribution Channel 2025 & 2033
- Figure 23: Europe Crop Insurance Market Revenue Share (%), by Distribution Channel 2025 & 2033
- Figure 24: Europe Crop Insurance Market Revenue (Million), by Country 2025 & 2033
- Figure 25: Europe Crop Insurance Market Revenue Share (%), by Country 2025 & 2033
- Figure 26: Middle East & Africa Crop Insurance Market Revenue (Million), by Type 2025 & 2033
- Figure 27: Middle East & Africa Crop Insurance Market Revenue Share (%), by Type 2025 & 2033
- Figure 28: Middle East & Africa Crop Insurance Market Revenue (Million), by Coverage 2025 & 2033
- Figure 29: Middle East & Africa Crop Insurance Market Revenue Share (%), by Coverage 2025 & 2033
- Figure 30: Middle East & Africa Crop Insurance Market Revenue (Million), by Distribution Channel 2025 & 2033
- Figure 31: Middle East & Africa Crop Insurance Market Revenue Share (%), by Distribution Channel 2025 & 2033
- Figure 32: Middle East & Africa Crop Insurance Market Revenue (Million), by Country 2025 & 2033
- Figure 33: Middle East & Africa Crop Insurance Market Revenue Share (%), by Country 2025 & 2033
- Figure 34: Asia Pacific Crop Insurance Market Revenue (Million), by Type 2025 & 2033
- Figure 35: Asia Pacific Crop Insurance Market Revenue Share (%), by Type 2025 & 2033
- Figure 36: Asia Pacific Crop Insurance Market Revenue (Million), by Coverage 2025 & 2033
- Figure 37: Asia Pacific Crop Insurance Market Revenue Share (%), by Coverage 2025 & 2033
- Figure 38: Asia Pacific Crop Insurance Market Revenue (Million), by Distribution Channel 2025 & 2033
- Figure 39: Asia Pacific Crop Insurance Market Revenue Share (%), by Distribution Channel 2025 & 2033
- Figure 40: Asia Pacific Crop Insurance Market Revenue (Million), by Country 2025 & 2033
- Figure 41: Asia Pacific Crop Insurance Market Revenue Share (%), by Country 2025 & 2033
List of Tables
- Table 1: Global Crop Insurance Market Revenue Million Forecast, by Type 2020 & 2033
- Table 2: Global Crop Insurance Market Revenue Million Forecast, by Coverage 2020 & 2033
- Table 3: Global Crop Insurance Market Revenue Million Forecast, by Distribution Channel 2020 & 2033
- Table 4: Global Crop Insurance Market Revenue Million Forecast, by Region 2020 & 2033
- Table 5: Global Crop Insurance Market Revenue Million Forecast, by Type 2020 & 2033
- Table 6: Global Crop Insurance Market Revenue Million Forecast, by Coverage 2020 & 2033
- Table 7: Global Crop Insurance Market Revenue Million Forecast, by Distribution Channel 2020 & 2033
- Table 8: Global Crop Insurance Market Revenue Million Forecast, by Country 2020 & 2033
- Table 9: United States Crop Insurance Market Revenue (Million) Forecast, by Application 2020 & 2033
- Table 10: Canada Crop Insurance Market Revenue (Million) Forecast, by Application 2020 & 2033
- Table 11: Mexico Crop Insurance Market Revenue (Million) Forecast, by Application 2020 & 2033
- Table 12: Global Crop Insurance Market Revenue Million Forecast, by Type 2020 & 2033
- Table 13: Global Crop Insurance Market Revenue Million Forecast, by Coverage 2020 & 2033
- Table 14: Global Crop Insurance Market Revenue Million Forecast, by Distribution Channel 2020 & 2033
- Table 15: Global Crop Insurance Market Revenue Million Forecast, by Country 2020 & 2033
- Table 16: Brazil Crop Insurance Market Revenue (Million) Forecast, by Application 2020 & 2033
- Table 17: Argentina Crop Insurance Market Revenue (Million) Forecast, by Application 2020 & 2033
- Table 18: Rest of South America Crop Insurance Market Revenue (Million) Forecast, by Application 2020 & 2033
- Table 19: Global Crop Insurance Market Revenue Million Forecast, by Type 2020 & 2033
- Table 20: Global Crop Insurance Market Revenue Million Forecast, by Coverage 2020 & 2033
- Table 21: Global Crop Insurance Market Revenue Million Forecast, by Distribution Channel 2020 & 2033
- Table 22: Global Crop Insurance Market Revenue Million Forecast, by Country 2020 & 2033
- Table 23: United Kingdom Crop Insurance Market Revenue (Million) Forecast, by Application 2020 & 2033
- Table 24: Germany Crop Insurance Market Revenue (Million) Forecast, by Application 2020 & 2033
- Table 25: France Crop Insurance Market Revenue (Million) Forecast, by Application 2020 & 2033
- Table 26: Italy Crop Insurance Market Revenue (Million) Forecast, by Application 2020 & 2033
- Table 27: Spain Crop Insurance Market Revenue (Million) Forecast, by Application 2020 & 2033
- Table 28: Russia Crop Insurance Market Revenue (Million) Forecast, by Application 2020 & 2033
- Table 29: Benelux Crop Insurance Market Revenue (Million) Forecast, by Application 2020 & 2033
- Table 30: Nordics Crop Insurance Market Revenue (Million) Forecast, by Application 2020 & 2033
- Table 31: Rest of Europe Crop Insurance Market Revenue (Million) Forecast, by Application 2020 & 2033
- Table 32: Global Crop Insurance Market Revenue Million Forecast, by Type 2020 & 2033
- Table 33: Global Crop Insurance Market Revenue Million Forecast, by Coverage 2020 & 2033
- Table 34: Global Crop Insurance Market Revenue Million Forecast, by Distribution Channel 2020 & 2033
- Table 35: Global Crop Insurance Market Revenue Million Forecast, by Country 2020 & 2033
- Table 36: Turkey Crop Insurance Market Revenue (Million) Forecast, by Application 2020 & 2033
- Table 37: Israel Crop Insurance Market Revenue (Million) Forecast, by Application 2020 & 2033
- Table 38: GCC Crop Insurance Market Revenue (Million) Forecast, by Application 2020 & 2033
- Table 39: North Africa Crop Insurance Market Revenue (Million) Forecast, by Application 2020 & 2033
- Table 40: South Africa Crop Insurance Market Revenue (Million) Forecast, by Application 2020 & 2033
- Table 41: Rest of Middle East & Africa Crop Insurance Market Revenue (Million) Forecast, by Application 2020 & 2033
- Table 42: Global Crop Insurance Market Revenue Million Forecast, by Type 2020 & 2033
- Table 43: Global Crop Insurance Market Revenue Million Forecast, by Coverage 2020 & 2033
- Table 44: Global Crop Insurance Market Revenue Million Forecast, by Distribution Channel 2020 & 2033
- Table 45: Global Crop Insurance Market Revenue Million Forecast, by Country 2020 & 2033
- Table 46: China Crop Insurance Market Revenue (Million) Forecast, by Application 2020 & 2033
- Table 47: India Crop Insurance Market Revenue (Million) Forecast, by Application 2020 & 2033
- Table 48: Japan Crop Insurance Market Revenue (Million) Forecast, by Application 2020 & 2033
- Table 49: South Korea Crop Insurance Market Revenue (Million) Forecast, by Application 2020 & 2033
- Table 50: ASEAN Crop Insurance Market Revenue (Million) Forecast, by Application 2020 & 2033
- Table 51: Oceania Crop Insurance Market Revenue (Million) Forecast, by Application 2020 & 2033
- Table 52: Rest of Asia Pacific Crop Insurance Market Revenue (Million) Forecast, by Application 2020 & 2033
Frequently Asked Questions
1. What is the projected Compound Annual Growth Rate (CAGR) of the Crop Insurance Market ?
The projected CAGR is approximately 5.77%.
2. Which companies are prominent players in the Crop Insurance Market ?
Key companies in the market include Sompo International Holdings Ltd, PICC, Fairfax Financial Holdings Limited, American Financial Group Inc, QBE Insurance Group Limited, ICICI Lombard General Insurance Company Limited, Zurich**List Not Exhaustive, Chubb, Tokio Marine HCC, Agriculture Insurance Company of India Limited (AIC).
3. What are the main segments of the Crop Insurance Market ?
The market segments include Type, Coverage, Distribution Channel.
4. Can you provide details about the market size?
The market size is estimated to be USD 38.10 Million as of 2022.
5. What are some drivers contributing to market growth?
Government Support. Including Subsidies and Initiatives. is a Significant Driver.
6. What are the notable trends driving market growth?
Increasing Value Crop Protection Globally.
7. Are there any restraints impacting market growth?
Instances of Fraud or Misreporting can Impact the Integrity of the Crop Insurance System.
8. Can you provide examples of recent developments in the market?
September 2023: The Shrimp Crop Insurance scheme developed by the Agricultural Insurance Company was launched in India. The insurance cover starts from the initial stage to 130 days till the shrimps are ready.
9. What pricing options are available for accessing the report?
Pricing options include single-user, multi-user, and enterprise licenses priced at USD 3800, USD 4500, and USD 5800 respectively.
10. Is the market size provided in terms of value or volume?
The market size is provided in terms of value, measured in Million.
11. Are there any specific market keywords associated with the report?
Yes, the market keyword associated with the report is "Crop Insurance Market ," which aids in identifying and referencing the specific market segment covered.
12. How do I determine which pricing option suits my needs best?
The pricing options vary based on user requirements and access needs. Individual users may opt for single-user licenses, while businesses requiring broader access may choose multi-user or enterprise licenses for cost-effective access to the report.
13. Are there any additional resources or data provided in the Crop Insurance Market report?
While the report offers comprehensive insights, it's advisable to review the specific contents or supplementary materials provided to ascertain if additional resources or data are available.
14. How can I stay updated on further developments or reports in the Crop Insurance Market ?
To stay informed about further developments, trends, and reports in the Crop Insurance Market , consider subscribing to industry newsletters, following relevant companies and organizations, or regularly checking reputable industry news sources and publications.
Methodology
Step 1 - Identification of Relevant Samples Size from Population Database


Step 2 - Approaches for Defining Global Market Size (Value, Volume* & Price*)

Note*: In applicable scenarios
Step 3 - Data Sources
Primary Research
- Web Analytics
- Survey Reports
- Research Institute
- Latest Research Reports
- Opinion Leaders
Secondary Research
- Annual Reports
- White Paper
- Latest Press Release
- Industry Association
- Paid Database
- Investor Presentations

Step 4 - Data Triangulation
Involves using different sources of information in order to increase the validity of a study
These sources are likely to be stakeholders in a program - participants, other researchers, program staff, other community members, and so on.
Then we put all data in single framework & apply various statistical tools to find out the dynamic on the market.
During the analysis stage, feedback from the stakeholder groups would be compared to determine areas of agreement as well as areas of divergence