

Key Insights
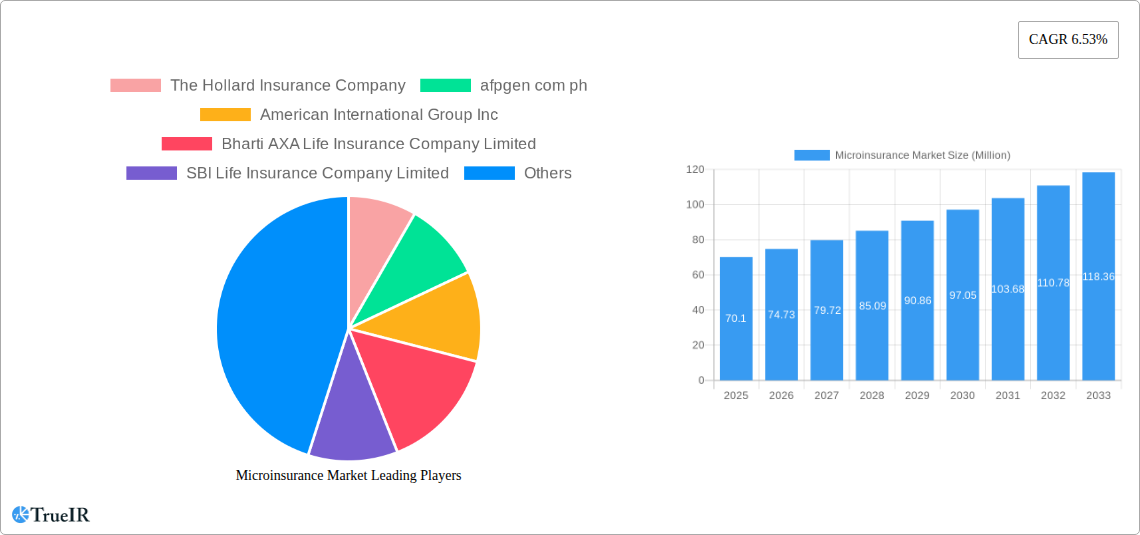
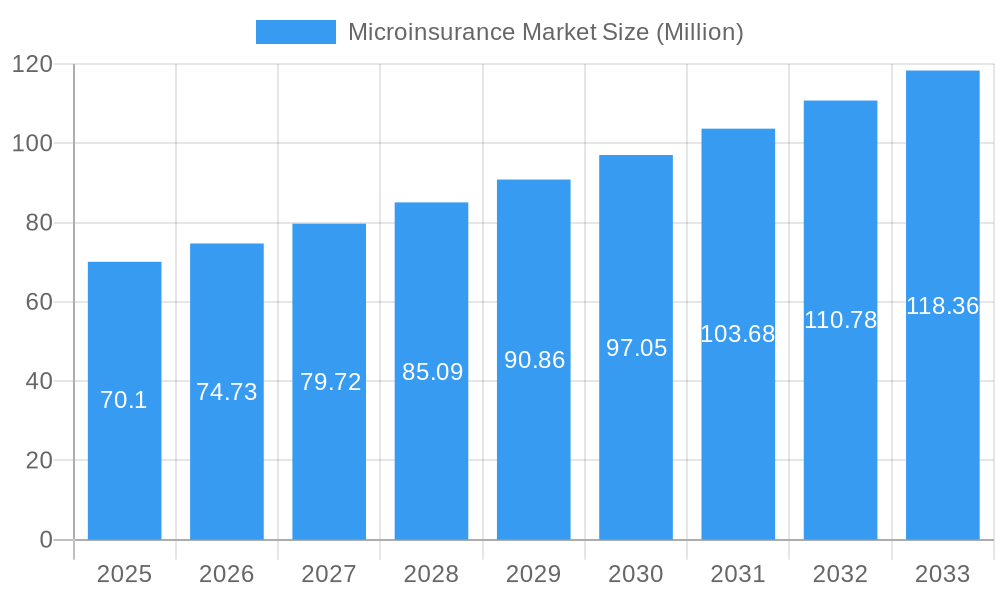
The microinsurance market, valued at $70.10 million in 2025, is projected to experience robust growth, driven by increasing financial inclusion initiatives in developing economies and a rising demand for affordable insurance products catering to low-income populations. The market's Compound Annual Growth Rate (CAGR) of 6.53% from 2025 to 2033 indicates a substantial expansion, fueled by technological advancements like mobile-based insurance platforms that simplify access and distribution. Key drivers include expanding mobile phone penetration, particularly in underserved regions, government regulations promoting microinsurance penetration, and the growing awareness of the need for risk mitigation among vulnerable populations. While challenges remain, such as regulatory complexities in certain markets and the need for improved customer education and trust-building, the overall market outlook remains positive. The presence of numerous players, including both established insurers like Allianz SE and AIG, and specialized microinsurance providers, indicates a competitive landscape fostering innovation and market penetration.
Microinsurance Market Market Size (In Million)
This growth trajectory is expected to continue through 2033, with significant contributions anticipated from regions with high concentrations of low-income populations. The market segmentation likely reflects variations in product offerings (e.g., health, life, crop), distribution channels (e.g., mobile, agents), and target demographics. Companies are strategically focusing on leveraging technology and partnerships to enhance accessibility, affordability, and customer reach. Future growth hinges on continued improvements in technological infrastructure, financial literacy programs, and supportive government policies. The expansion of product lines to address diverse needs and risk profiles within low-income communities will be crucial for sustained market growth.
Microinsurance Market Company Market Share
This dynamic report provides a comprehensive analysis of the Microinsurance Market, offering invaluable insights for investors, industry professionals, and strategic decision-makers. Covering the period from 2019 to 2033, with a focus on 2025, this study delves into market trends, competitive landscapes, and future growth potential. Leveraging extensive data and expert analysis, this report is an essential resource for navigating the complexities of the microinsurance sector. The market is projected to reach xx Million by 2033.
Microinsurance Market Structure & Competitive Landscape
The global microinsurance market exhibits a moderately concentrated structure, with a few major players commanding significant market share. However, the landscape is dynamic, characterized by continuous innovation, evolving regulatory frameworks, and increasing mergers and acquisitions (M&A) activity. The Herfindahl-Hirschman Index (HHI) for the market in 2024 is estimated at xx, indicating a moderately consolidated market.
- Market Concentration: The top 5 players account for approximately xx% of the global market share in 2024. This concentration is expected to slightly increase to xx% by 2033 due to ongoing consolidation.
- Innovation Drivers: Technological advancements, particularly in mobile technology and data analytics, are driving innovation. Insurtech startups are emerging, challenging traditional players and offering innovative microinsurance products.
- Regulatory Impacts: Regulatory frameworks significantly influence market dynamics. Stringent regulations can stifle growth, while supportive policies can foster expansion. Variances in regulations across different geographies also impact market development.
- Product Substitutes: While microinsurance addresses a unique need, alternative financial services, such as informal savings groups and community-based risk-sharing mechanisms, can act as partial substitutes.
- End-User Segmentation: The market is segmented by demographics (age, income, location), product type (health, life, agriculture, etc.), and distribution channels (agents, mobile platforms, etc.).
- M&A Trends: The past five years have witnessed a significant increase in M&A activity, with xx major transactions recorded between 2019 and 2024. This trend is expected to continue, driven by consolidation and expansion strategies. The total value of M&A deals in 2024 is estimated at xx Million.
Microinsurance Market Trends & Opportunities
The global microinsurance market is experiencing robust growth, fueled by several key factors. The market is expected to register a Compound Annual Growth Rate (CAGR) of xx% from 2025 to 2033. Market penetration rates vary significantly across regions, with developing economies showing higher growth potential. Technological advancements are transforming the industry, enabling wider access and customized offerings. Consumer preferences are shifting toward digital platforms and bundled products. Competitive dynamics are intensifying, with both established players and new entrants vying for market share.
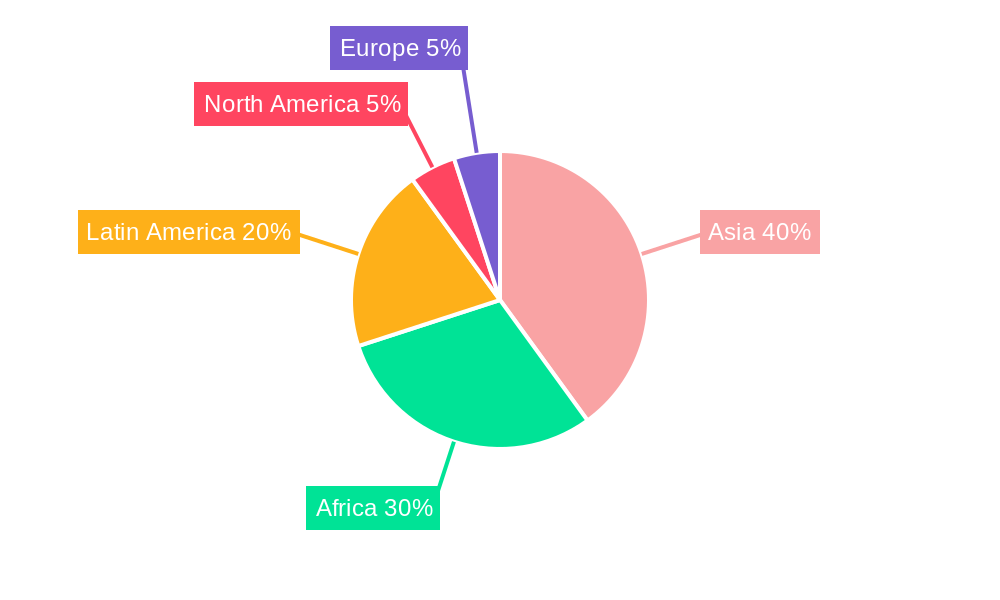
Dominant Markets & Segments in Microinsurance Market
The Asia-Pacific region is currently the dominant market for microinsurance, driven by a large underserved population, rising incomes, and increasing awareness of insurance benefits. India and China are key growth drivers in this region.
- Key Growth Drivers in Asia-Pacific:
- Rapidly expanding middle class.
- Increasing smartphone penetration.
- Supportive government policies and initiatives.
- Growing awareness of insurance benefits among underserved populations.
- Development of innovative distribution channels.
The health insurance segment holds the largest market share, followed by agricultural and life insurance. This is attributed to the increasing prevalence of health risks and the need for income protection in agriculture-dependent economies.
Microinsurance Market Product Analysis
Microinsurance product innovation is primarily focused on enhancing accessibility and affordability. This includes utilizing mobile technology for distribution, developing simpler product designs, and incorporating data analytics for risk assessment. Technological advancements such as blockchain and AI are being explored to improve efficiency and transparency. The market is seeing a rise in bundled products, offering multiple coverage options at a reduced cost. The increasing focus on customer experience and digitalization is enhancing market fit.
Key Drivers, Barriers & Challenges in Microinsurance Market
Key Drivers:
- Expanding mobile penetration and digitalization: Facilitates wider reach and lower distribution costs.
- Government support and initiatives: Policies promoting financial inclusion contribute to market growth.
- Rising awareness of insurance benefits: Improved literacy and understanding are driving demand.
Challenges:
- Regulatory complexities and inconsistencies: Varying regulations across regions hinder market expansion.
- Supply chain limitations: Reaching remote populations presents logistical challenges.
- Competitive pressures: The market is becoming increasingly competitive, requiring players to differentiate their offerings. This competitive pressure impacts profit margins, estimated to be xx% in 2024, and potentially decreasing to xx% in 2033.
Growth Drivers in the Microinsurance Market
Technological advancements, supportive government policies, and increasing financial inclusion are key growth drivers. The rise of Insurtech companies is also contributing significantly to innovation and market expansion.
Challenges Impacting Microinsurance Market Growth
Regulatory hurdles, limited infrastructure in underserved areas, and a lack of financial literacy among target populations pose significant challenges. High operating costs, particularly in distribution, can also constrain growth.
Key Players Shaping the Microinsurance Market Market
- The Hollard Insurance Company
- afpgen com ph (website not available)
- American International Group Inc
- Bharti AXA Life Insurance Company Limited (website not available)
- SBI Life Insurance Company Limited (website not available)
- ICICI Prudential Life Insurance Co Ltd (website not available)
- Banco do Nordeste Brasil SA (website not available)
- Climbs (website not available)
- Allianz SE
- Bajaj Allianz Life Insurance Co Ltd (website not available)
- List Not Exhaustive
Significant Microinsurance Market Industry Milestones
- October 2023: Bharti Group's acquisition of AXA's stake in Bharti AXA Life Insurance signifies significant consolidation within the Indian microinsurance market. This deal is anticipated to lead to increased efficiency and potentially expanded product offerings.
- April 2023: AIG's establishment of Private Client Select Insurance Services demonstrates a focus on high-net-worth individuals, suggesting a potential shift towards more specialized microinsurance products.
Future Outlook for Microinsurance Market Market
The microinsurance market is poised for sustained growth, driven by technological innovation, expanding digital infrastructure, and increasing financial inclusion initiatives. Strategic partnerships and product diversification will be crucial for success. The market's potential remains substantial, particularly in underserved regions of developing economies.
Microinsurance Market Segmentation
-
1. Model Type
- 1.1. Partner Agent Model
- 1.2. Full-service Model
-
2. Product Type
- 2.1. Life Insurance
- 2.2. Health Insurance
- 2.3. Property Insurance
- 2.4. Other Product Types
-
3. Distribution Channel
- 3.1. Direct Sales
- 3.2. Financial Institutions
- 3.3. Digital Channels
- 3.4. Other Distribution Channels
-
4. Provider
- 4.1. Commercially Viable
- 4.2. Through Aid/Government Support
Microinsurance Market Segmentation By Geography
- 1. North America
- 2. Europe
- 3. Asia Pacific
- 4. Middle East and Africa
- 5. South America
Microinsurance Market Regional Market Share
Geographic Coverage of Microinsurance Market
Microinsurance Market REPORT HIGHLIGHTS
| Aspects | Details |
|---|---|
| Study Period | 2020-2034 |
| Base Year | 2025 |
| Estimated Year | 2026 |
| Forecast Period | 2026-2034 |
| Historical Period | 2020-2025 |
| Growth Rate | CAGR of 4.57% from 2020-2034 |
| Segmentation |
|
Table of Contents
- 1. Introduction
- 1.1. Research Scope
- 1.2. Market Segmentation
- 1.3. Research Objective
- 1.4. Definitions and Assumptions
- 2. Executive Summary
- 2.1. Market Snapshot
- 3. Market Dynamics
- 3.1. Market Drivers
- 3.2. Market Restrains
- 3.3. Market Trends
- 3.4. Market Opportunities
- 4. Market Factor Analysis
- 4.1. Porters Five Forces
- 4.1.1. Bargaining Power of Suppliers
- 4.1.2. Bargaining Power of Buyers
- 4.1.3. Threat of New Entrants
- 4.1.4. Threat of Substitutes
- 4.1.5. Competitive Rivalry
- 4.2. PESTEL analysis
- 4.3. BCG Analysis
- 4.3.1. Stars (High Growth, High Market Share)
- 4.3.2. Cash Cows (Low Growth, High Market Share)
- 4.3.3. Question Mark (High Growth, Low Market Share)
- 4.3.4. Dogs (Low Growth, Low Market Share)
- 4.4. Ansoff Matrix Analysis
- 4.5. Supply Chain Analysis
- 4.6. Regulatory Landscape
- 4.7. Current Market Potential and Opportunity Assessment (TAM–SAM–SOM Framework)
- 4.8. TIR Analyst Note
- 4.1. Porters Five Forces
- 5. Market Analysis, Insights and Forecast 2021-2033
- 5.1. Market Analysis, Insights and Forecast - by Model Type
- 5.1.1. Partner Agent Model
- 5.1.2. Full-service Model
- 5.2. Market Analysis, Insights and Forecast - by Product Type
- 5.2.1. Life Insurance
- 5.2.2. Health Insurance
- 5.2.3. Property Insurance
- 5.2.4. Other Product Types
- 5.3. Market Analysis, Insights and Forecast - by Distribution Channel
- 5.3.1. Direct Sales
- 5.3.2. Financial Institutions
- 5.3.3. Digital Channels
- 5.3.4. Other Distribution Channels
- 5.4. Market Analysis, Insights and Forecast - by Provider
- 5.4.1. Commercially Viable
- 5.4.2. Through Aid/Government Support
- 5.5. Market Analysis, Insights and Forecast - by Region
- 5.5.1. North America
- 5.5.2. Europe
- 5.5.3. Asia Pacific
- 5.5.4. Middle East and Africa
- 5.5.5. South America
- 5.1. Market Analysis, Insights and Forecast - by Model Type
- 6. Global Microinsurance Market Analysis, Insights and Forecast, 2021-2033
- 6.1. Market Analysis, Insights and Forecast - by Model Type
- 6.1.1. Partner Agent Model
- 6.1.2. Full-service Model
- 6.2. Market Analysis, Insights and Forecast - by Product Type
- 6.2.1. Life Insurance
- 6.2.2. Health Insurance
- 6.2.3. Property Insurance
- 6.2.4. Other Product Types
- 6.3. Market Analysis, Insights and Forecast - by Distribution Channel
- 6.3.1. Direct Sales
- 6.3.2. Financial Institutions
- 6.3.3. Digital Channels
- 6.3.4. Other Distribution Channels
- 6.4. Market Analysis, Insights and Forecast - by Provider
- 6.4.1. Commercially Viable
- 6.4.2. Through Aid/Government Support
- 6.1. Market Analysis, Insights and Forecast - by Model Type
- 7. North America Microinsurance Market Analysis, Insights and Forecast, 2020-2032
- 7.1. Market Analysis, Insights and Forecast - by Model Type
- 7.1.1. Partner Agent Model
- 7.1.2. Full-service Model
- 7.2. Market Analysis, Insights and Forecast - by Product Type
- 7.2.1. Life Insurance
- 7.2.2. Health Insurance
- 7.2.3. Property Insurance
- 7.2.4. Other Product Types
- 7.3. Market Analysis, Insights and Forecast - by Distribution Channel
- 7.3.1. Direct Sales
- 7.3.2. Financial Institutions
- 7.3.3. Digital Channels
- 7.3.4. Other Distribution Channels
- 7.4. Market Analysis, Insights and Forecast - by Provider
- 7.4.1. Commercially Viable
- 7.4.2. Through Aid/Government Support
- 7.1. Market Analysis, Insights and Forecast - by Model Type
- 8. Europe Microinsurance Market Analysis, Insights and Forecast, 2020-2032
- 8.1. Market Analysis, Insights and Forecast - by Model Type
- 8.1.1. Partner Agent Model
- 8.1.2. Full-service Model
- 8.2. Market Analysis, Insights and Forecast - by Product Type
- 8.2.1. Life Insurance
- 8.2.2. Health Insurance
- 8.2.3. Property Insurance
- 8.2.4. Other Product Types
- 8.3. Market Analysis, Insights and Forecast - by Distribution Channel
- 8.3.1. Direct Sales
- 8.3.2. Financial Institutions
- 8.3.3. Digital Channels
- 8.3.4. Other Distribution Channels
- 8.4. Market Analysis, Insights and Forecast - by Provider
- 8.4.1. Commercially Viable
- 8.4.2. Through Aid/Government Support
- 8.1. Market Analysis, Insights and Forecast - by Model Type
- 9. Asia Pacific Microinsurance Market Analysis, Insights and Forecast, 2020-2032
- 9.1. Market Analysis, Insights and Forecast - by Model Type
- 9.1.1. Partner Agent Model
- 9.1.2. Full-service Model
- 9.2. Market Analysis, Insights and Forecast - by Product Type
- 9.2.1. Life Insurance
- 9.2.2. Health Insurance
- 9.2.3. Property Insurance
- 9.2.4. Other Product Types
- 9.3. Market Analysis, Insights and Forecast - by Distribution Channel
- 9.3.1. Direct Sales
- 9.3.2. Financial Institutions
- 9.3.3. Digital Channels
- 9.3.4. Other Distribution Channels
- 9.4. Market Analysis, Insights and Forecast - by Provider
- 9.4.1. Commercially Viable
- 9.4.2. Through Aid/Government Support
- 9.1. Market Analysis, Insights and Forecast - by Model Type
- 10. Middle East and Africa Microinsurance Market Analysis, Insights and Forecast, 2020-2032
- 10.1. Market Analysis, Insights and Forecast - by Model Type
- 10.1.1. Partner Agent Model
- 10.1.2. Full-service Model
- 10.2. Market Analysis, Insights and Forecast - by Product Type
- 10.2.1. Life Insurance
- 10.2.2. Health Insurance
- 10.2.3. Property Insurance
- 10.2.4. Other Product Types
- 10.3. Market Analysis, Insights and Forecast - by Distribution Channel
- 10.3.1. Direct Sales
- 10.3.2. Financial Institutions
- 10.3.3. Digital Channels
- 10.3.4. Other Distribution Channels
- 10.4. Market Analysis, Insights and Forecast - by Provider
- 10.4.1. Commercially Viable
- 10.4.2. Through Aid/Government Support
- 10.1. Market Analysis, Insights and Forecast - by Model Type
- 11. South America Microinsurance Market Analysis, Insights and Forecast, 2020-2032
- 11.1. Market Analysis, Insights and Forecast - by Model Type
- 11.1.1. Partner Agent Model
- 11.1.2. Full-service Model
- 11.2. Market Analysis, Insights and Forecast - by Product Type
- 11.2.1. Life Insurance
- 11.2.2. Health Insurance
- 11.2.3. Property Insurance
- 11.2.4. Other Product Types
- 11.3. Market Analysis, Insights and Forecast - by Distribution Channel
- 11.3.1. Direct Sales
- 11.3.2. Financial Institutions
- 11.3.3. Digital Channels
- 11.3.4. Other Distribution Channels
- 11.4. Market Analysis, Insights and Forecast - by Provider
- 11.4.1. Commercially Viable
- 11.4.2. Through Aid/Government Support
- 11.1. Market Analysis, Insights and Forecast - by Model Type
- 12. Competitive Analysis
- 12.1. Company Profiles
- 12.1.1 The Hollard Insurance Company
- 12.1.1.1. Company Overview
- 12.1.1.2. Products
- 12.1.1.3. Company Financials
- 12.1.1.4. SWOT Analysis
- 12.1.2 afpgen com ph
- 12.1.2.1. Company Overview
- 12.1.2.2. Products
- 12.1.2.3. Company Financials
- 12.1.2.4. SWOT Analysis
- 12.1.3 American International Group Inc
- 12.1.3.1. Company Overview
- 12.1.3.2. Products
- 12.1.3.3. Company Financials
- 12.1.3.4. SWOT Analysis
- 12.1.4 Bharti AXA Life Insurance Company Limited
- 12.1.4.1. Company Overview
- 12.1.4.2. Products
- 12.1.4.3. Company Financials
- 12.1.4.4. SWOT Analysis
- 12.1.5 SBI Life Insurance Company Limited
- 12.1.5.1. Company Overview
- 12.1.5.2. Products
- 12.1.5.3. Company Financials
- 12.1.5.4. SWOT Analysis
- 12.1.6 ICICI Prudential Life Insurance Co Ltd
- 12.1.6.1. Company Overview
- 12.1.6.2. Products
- 12.1.6.3. Company Financials
- 12.1.6.4. SWOT Analysis
- 12.1.7 Banco do Nordeste Brasil SA
- 12.1.7.1. Company Overview
- 12.1.7.2. Products
- 12.1.7.3. Company Financials
- 12.1.7.4. SWOT Analysis
- 12.1.8 Climbs
- 12.1.8.1. Company Overview
- 12.1.8.2. Products
- 12.1.8.3. Company Financials
- 12.1.8.4. SWOT Analysis
- 12.1.9 Allianz SE
- 12.1.9.1. Company Overview
- 12.1.9.2. Products
- 12.1.9.3. Company Financials
- 12.1.9.4. SWOT Analysis
- 12.1.10 Bajaj Allianz Life Insurance Co Ltd**List Not Exhaustive
- 12.1.10.1. Company Overview
- 12.1.10.2. Products
- 12.1.10.3. Company Financials
- 12.1.10.4. SWOT Analysis
- 12.1.1 The Hollard Insurance Company
- 12.2. Market Entropy
- 12.2.1 Company's Key Areas Served
- 12.2.2 Recent Developments
- 12.3. Company Market Share Analysis 2025
- 12.3.1 Top 5 Companies Market Share Analysis
- 12.3.2 Top 3 Companies Market Share Analysis
- 12.4. List of Potential Customers
- 13. Research Methodology
List of Figures
- Figure 1: Global Microinsurance Market Revenue Breakdown (billion, %) by Region 2025 & 2033
- Figure 2: Global Microinsurance Market Volume Breakdown (Billion, %) by Region 2025 & 2033
- Figure 3: North America Microinsurance Market Revenue (billion), by Model Type 2025 & 2033
- Figure 4: North America Microinsurance Market Volume (Billion), by Model Type 2025 & 2033
- Figure 5: North America Microinsurance Market Revenue Share (%), by Model Type 2025 & 2033
- Figure 6: North America Microinsurance Market Volume Share (%), by Model Type 2025 & 2033
- Figure 7: North America Microinsurance Market Revenue (billion), by Product Type 2025 & 2033
- Figure 8: North America Microinsurance Market Volume (Billion), by Product Type 2025 & 2033
- Figure 9: North America Microinsurance Market Revenue Share (%), by Product Type 2025 & 2033
- Figure 10: North America Microinsurance Market Volume Share (%), by Product Type 2025 & 2033
- Figure 11: North America Microinsurance Market Revenue (billion), by Distribution Channel 2025 & 2033
- Figure 12: North America Microinsurance Market Volume (Billion), by Distribution Channel 2025 & 2033
- Figure 13: North America Microinsurance Market Revenue Share (%), by Distribution Channel 2025 & 2033
- Figure 14: North America Microinsurance Market Volume Share (%), by Distribution Channel 2025 & 2033
- Figure 15: North America Microinsurance Market Revenue (billion), by Provider 2025 & 2033
- Figure 16: North America Microinsurance Market Volume (Billion), by Provider 2025 & 2033
- Figure 17: North America Microinsurance Market Revenue Share (%), by Provider 2025 & 2033
- Figure 18: North America Microinsurance Market Volume Share (%), by Provider 2025 & 2033
- Figure 19: North America Microinsurance Market Revenue (billion), by Country 2025 & 2033
- Figure 20: North America Microinsurance Market Volume (Billion), by Country 2025 & 2033
- Figure 21: North America Microinsurance Market Revenue Share (%), by Country 2025 & 2033
- Figure 22: North America Microinsurance Market Volume Share (%), by Country 2025 & 2033
- Figure 23: Europe Microinsurance Market Revenue (billion), by Model Type 2025 & 2033
- Figure 24: Europe Microinsurance Market Volume (Billion), by Model Type 2025 & 2033
- Figure 25: Europe Microinsurance Market Revenue Share (%), by Model Type 2025 & 2033
- Figure 26: Europe Microinsurance Market Volume Share (%), by Model Type 2025 & 2033
- Figure 27: Europe Microinsurance Market Revenue (billion), by Product Type 2025 & 2033
- Figure 28: Europe Microinsurance Market Volume (Billion), by Product Type 2025 & 2033
- Figure 29: Europe Microinsurance Market Revenue Share (%), by Product Type 2025 & 2033
- Figure 30: Europe Microinsurance Market Volume Share (%), by Product Type 2025 & 2033
- Figure 31: Europe Microinsurance Market Revenue (billion), by Distribution Channel 2025 & 2033
- Figure 32: Europe Microinsurance Market Volume (Billion), by Distribution Channel 2025 & 2033
- Figure 33: Europe Microinsurance Market Revenue Share (%), by Distribution Channel 2025 & 2033
- Figure 34: Europe Microinsurance Market Volume Share (%), by Distribution Channel 2025 & 2033
- Figure 35: Europe Microinsurance Market Revenue (billion), by Provider 2025 & 2033
- Figure 36: Europe Microinsurance Market Volume (Billion), by Provider 2025 & 2033
- Figure 37: Europe Microinsurance Market Revenue Share (%), by Provider 2025 & 2033
- Figure 38: Europe Microinsurance Market Volume Share (%), by Provider 2025 & 2033
- Figure 39: Europe Microinsurance Market Revenue (billion), by Country 2025 & 2033
- Figure 40: Europe Microinsurance Market Volume (Billion), by Country 2025 & 2033
- Figure 41: Europe Microinsurance Market Revenue Share (%), by Country 2025 & 2033
- Figure 42: Europe Microinsurance Market Volume Share (%), by Country 2025 & 2033
- Figure 43: Asia Pacific Microinsurance Market Revenue (billion), by Model Type 2025 & 2033
- Figure 44: Asia Pacific Microinsurance Market Volume (Billion), by Model Type 2025 & 2033
- Figure 45: Asia Pacific Microinsurance Market Revenue Share (%), by Model Type 2025 & 2033
- Figure 46: Asia Pacific Microinsurance Market Volume Share (%), by Model Type 2025 & 2033
- Figure 47: Asia Pacific Microinsurance Market Revenue (billion), by Product Type 2025 & 2033
- Figure 48: Asia Pacific Microinsurance Market Volume (Billion), by Product Type 2025 & 2033
- Figure 49: Asia Pacific Microinsurance Market Revenue Share (%), by Product Type 2025 & 2033
- Figure 50: Asia Pacific Microinsurance Market Volume Share (%), by Product Type 2025 & 2033
- Figure 51: Asia Pacific Microinsurance Market Revenue (billion), by Distribution Channel 2025 & 2033
- Figure 52: Asia Pacific Microinsurance Market Volume (Billion), by Distribution Channel 2025 & 2033
- Figure 53: Asia Pacific Microinsurance Market Revenue Share (%), by Distribution Channel 2025 & 2033
- Figure 54: Asia Pacific Microinsurance Market Volume Share (%), by Distribution Channel 2025 & 2033
- Figure 55: Asia Pacific Microinsurance Market Revenue (billion), by Provider 2025 & 2033
- Figure 56: Asia Pacific Microinsurance Market Volume (Billion), by Provider 2025 & 2033
- Figure 57: Asia Pacific Microinsurance Market Revenue Share (%), by Provider 2025 & 2033
- Figure 58: Asia Pacific Microinsurance Market Volume Share (%), by Provider 2025 & 2033
- Figure 59: Asia Pacific Microinsurance Market Revenue (billion), by Country 2025 & 2033
- Figure 60: Asia Pacific Microinsurance Market Volume (Billion), by Country 2025 & 2033
- Figure 61: Asia Pacific Microinsurance Market Revenue Share (%), by Country 2025 & 2033
- Figure 62: Asia Pacific Microinsurance Market Volume Share (%), by Country 2025 & 2033
- Figure 63: Middle East and Africa Microinsurance Market Revenue (billion), by Model Type 2025 & 2033
- Figure 64: Middle East and Africa Microinsurance Market Volume (Billion), by Model Type 2025 & 2033
- Figure 65: Middle East and Africa Microinsurance Market Revenue Share (%), by Model Type 2025 & 2033
- Figure 66: Middle East and Africa Microinsurance Market Volume Share (%), by Model Type 2025 & 2033
- Figure 67: Middle East and Africa Microinsurance Market Revenue (billion), by Product Type 2025 & 2033
- Figure 68: Middle East and Africa Microinsurance Market Volume (Billion), by Product Type 2025 & 2033
- Figure 69: Middle East and Africa Microinsurance Market Revenue Share (%), by Product Type 2025 & 2033
- Figure 70: Middle East and Africa Microinsurance Market Volume Share (%), by Product Type 2025 & 2033
- Figure 71: Middle East and Africa Microinsurance Market Revenue (billion), by Distribution Channel 2025 & 2033
- Figure 72: Middle East and Africa Microinsurance Market Volume (Billion), by Distribution Channel 2025 & 2033
- Figure 73: Middle East and Africa Microinsurance Market Revenue Share (%), by Distribution Channel 2025 & 2033
- Figure 74: Middle East and Africa Microinsurance Market Volume Share (%), by Distribution Channel 2025 & 2033
- Figure 75: Middle East and Africa Microinsurance Market Revenue (billion), by Provider 2025 & 2033
- Figure 76: Middle East and Africa Microinsurance Market Volume (Billion), by Provider 2025 & 2033
- Figure 77: Middle East and Africa Microinsurance Market Revenue Share (%), by Provider 2025 & 2033
- Figure 78: Middle East and Africa Microinsurance Market Volume Share (%), by Provider 2025 & 2033
- Figure 79: Middle East and Africa Microinsurance Market Revenue (billion), by Country 2025 & 2033
- Figure 80: Middle East and Africa Microinsurance Market Volume (Billion), by Country 2025 & 2033
- Figure 81: Middle East and Africa Microinsurance Market Revenue Share (%), by Country 2025 & 2033
- Figure 82: Middle East and Africa Microinsurance Market Volume Share (%), by Country 2025 & 2033
- Figure 83: South America Microinsurance Market Revenue (billion), by Model Type 2025 & 2033
- Figure 84: South America Microinsurance Market Volume (Billion), by Model Type 2025 & 2033
- Figure 85: South America Microinsurance Market Revenue Share (%), by Model Type 2025 & 2033
- Figure 86: South America Microinsurance Market Volume Share (%), by Model Type 2025 & 2033
- Figure 87: South America Microinsurance Market Revenue (billion), by Product Type 2025 & 2033
- Figure 88: South America Microinsurance Market Volume (Billion), by Product Type 2025 & 2033
- Figure 89: South America Microinsurance Market Revenue Share (%), by Product Type 2025 & 2033
- Figure 90: South America Microinsurance Market Volume Share (%), by Product Type 2025 & 2033
- Figure 91: South America Microinsurance Market Revenue (billion), by Distribution Channel 2025 & 2033
- Figure 92: South America Microinsurance Market Volume (Billion), by Distribution Channel 2025 & 2033
- Figure 93: South America Microinsurance Market Revenue Share (%), by Distribution Channel 2025 & 2033
- Figure 94: South America Microinsurance Market Volume Share (%), by Distribution Channel 2025 & 2033
- Figure 95: South America Microinsurance Market Revenue (billion), by Provider 2025 & 2033
- Figure 96: South America Microinsurance Market Volume (Billion), by Provider 2025 & 2033
- Figure 97: South America Microinsurance Market Revenue Share (%), by Provider 2025 & 2033
- Figure 98: South America Microinsurance Market Volume Share (%), by Provider 2025 & 2033
- Figure 99: South America Microinsurance Market Revenue (billion), by Country 2025 & 2033
- Figure 100: South America Microinsurance Market Volume (Billion), by Country 2025 & 2033
- Figure 101: South America Microinsurance Market Revenue Share (%), by Country 2025 & 2033
- Figure 102: South America Microinsurance Market Volume Share (%), by Country 2025 & 2033
List of Tables
- Table 1: Global Microinsurance Market Revenue billion Forecast, by Model Type 2020 & 2033
- Table 2: Global Microinsurance Market Volume Billion Forecast, by Model Type 2020 & 2033
- Table 3: Global Microinsurance Market Revenue billion Forecast, by Product Type 2020 & 2033
- Table 4: Global Microinsurance Market Volume Billion Forecast, by Product Type 2020 & 2033
- Table 5: Global Microinsurance Market Revenue billion Forecast, by Distribution Channel 2020 & 2033
- Table 6: Global Microinsurance Market Volume Billion Forecast, by Distribution Channel 2020 & 2033
- Table 7: Global Microinsurance Market Revenue billion Forecast, by Provider 2020 & 2033
- Table 8: Global Microinsurance Market Volume Billion Forecast, by Provider 2020 & 2033
- Table 9: Global Microinsurance Market Revenue billion Forecast, by Region 2020 & 2033
- Table 10: Global Microinsurance Market Volume Billion Forecast, by Region 2020 & 2033
- Table 11: Global Microinsurance Market Revenue billion Forecast, by Model Type 2020 & 2033
- Table 12: Global Microinsurance Market Volume Billion Forecast, by Model Type 2020 & 2033
- Table 13: Global Microinsurance Market Revenue billion Forecast, by Product Type 2020 & 2033
- Table 14: Global Microinsurance Market Volume Billion Forecast, by Product Type 2020 & 2033
- Table 15: Global Microinsurance Market Revenue billion Forecast, by Distribution Channel 2020 & 2033
- Table 16: Global Microinsurance Market Volume Billion Forecast, by Distribution Channel 2020 & 2033
- Table 17: Global Microinsurance Market Revenue billion Forecast, by Provider 2020 & 2033
- Table 18: Global Microinsurance Market Volume Billion Forecast, by Provider 2020 & 2033
- Table 19: Global Microinsurance Market Revenue billion Forecast, by Country 2020 & 2033
- Table 20: Global Microinsurance Market Volume Billion Forecast, by Country 2020 & 2033
- Table 21: Global Microinsurance Market Revenue billion Forecast, by Model Type 2020 & 2033
- Table 22: Global Microinsurance Market Volume Billion Forecast, by Model Type 2020 & 2033
- Table 23: Global Microinsurance Market Revenue billion Forecast, by Product Type 2020 & 2033
- Table 24: Global Microinsurance Market Volume Billion Forecast, by Product Type 2020 & 2033
- Table 25: Global Microinsurance Market Revenue billion Forecast, by Distribution Channel 2020 & 2033
- Table 26: Global Microinsurance Market Volume Billion Forecast, by Distribution Channel 2020 & 2033
- Table 27: Global Microinsurance Market Revenue billion Forecast, by Provider 2020 & 2033
- Table 28: Global Microinsurance Market Volume Billion Forecast, by Provider 2020 & 2033
- Table 29: Global Microinsurance Market Revenue billion Forecast, by Country 2020 & 2033
- Table 30: Global Microinsurance Market Volume Billion Forecast, by Country 2020 & 2033
- Table 31: Global Microinsurance Market Revenue billion Forecast, by Model Type 2020 & 2033
- Table 32: Global Microinsurance Market Volume Billion Forecast, by Model Type 2020 & 2033
- Table 33: Global Microinsurance Market Revenue billion Forecast, by Product Type 2020 & 2033
- Table 34: Global Microinsurance Market Volume Billion Forecast, by Product Type 2020 & 2033
- Table 35: Global Microinsurance Market Revenue billion Forecast, by Distribution Channel 2020 & 2033
- Table 36: Global Microinsurance Market Volume Billion Forecast, by Distribution Channel 2020 & 2033
- Table 37: Global Microinsurance Market Revenue billion Forecast, by Provider 2020 & 2033
- Table 38: Global Microinsurance Market Volume Billion Forecast, by Provider 2020 & 2033
- Table 39: Global Microinsurance Market Revenue billion Forecast, by Country 2020 & 2033
- Table 40: Global Microinsurance Market Volume Billion Forecast, by Country 2020 & 2033
- Table 41: Global Microinsurance Market Revenue billion Forecast, by Model Type 2020 & 2033
- Table 42: Global Microinsurance Market Volume Billion Forecast, by Model Type 2020 & 2033
- Table 43: Global Microinsurance Market Revenue billion Forecast, by Product Type 2020 & 2033
- Table 44: Global Microinsurance Market Volume Billion Forecast, by Product Type 2020 & 2033
- Table 45: Global Microinsurance Market Revenue billion Forecast, by Distribution Channel 2020 & 2033
- Table 46: Global Microinsurance Market Volume Billion Forecast, by Distribution Channel 2020 & 2033
- Table 47: Global Microinsurance Market Revenue billion Forecast, by Provider 2020 & 2033
- Table 48: Global Microinsurance Market Volume Billion Forecast, by Provider 2020 & 2033
- Table 49: Global Microinsurance Market Revenue billion Forecast, by Country 2020 & 2033
- Table 50: Global Microinsurance Market Volume Billion Forecast, by Country 2020 & 2033
- Table 51: Global Microinsurance Market Revenue billion Forecast, by Model Type 2020 & 2033
- Table 52: Global Microinsurance Market Volume Billion Forecast, by Model Type 2020 & 2033
- Table 53: Global Microinsurance Market Revenue billion Forecast, by Product Type 2020 & 2033
- Table 54: Global Microinsurance Market Volume Billion Forecast, by Product Type 2020 & 2033
- Table 55: Global Microinsurance Market Revenue billion Forecast, by Distribution Channel 2020 & 2033
- Table 56: Global Microinsurance Market Volume Billion Forecast, by Distribution Channel 2020 & 2033
- Table 57: Global Microinsurance Market Revenue billion Forecast, by Provider 2020 & 2033
- Table 58: Global Microinsurance Market Volume Billion Forecast, by Provider 2020 & 2033
- Table 59: Global Microinsurance Market Revenue billion Forecast, by Country 2020 & 2033
- Table 60: Global Microinsurance Market Volume Billion Forecast, by Country 2020 & 2033
Frequently Asked Questions
1. What is the projected Compound Annual Growth Rate (CAGR) of the Microinsurance Market?
The projected CAGR is approximately 4.57%.
2. Which companies are prominent players in the Microinsurance Market?
Key companies in the market include The Hollard Insurance Company, afpgen com ph, American International Group Inc, Bharti AXA Life Insurance Company Limited, SBI Life Insurance Company Limited, ICICI Prudential Life Insurance Co Ltd, Banco do Nordeste Brasil SA, Climbs, Allianz SE, Bajaj Allianz Life Insurance Co Ltd**List Not Exhaustive.
3. What are the main segments of the Microinsurance Market?
The market segments include Model Type, Product Type, Distribution Channel, Provider.
4. Can you provide details about the market size?
The market size is estimated to be USD 98.8 billion as of 2022.
5. What are some drivers contributing to market growth?
Access to Financial Services; Rise of Digital Platforms and Mobile Technology.
6. What are the notable trends driving market growth?
Low- and Middle-income Earners prefer Healthcare Insurance.
7. Are there any restraints impacting market growth?
Access to Financial Services; Rise of Digital Platforms and Mobile Technology.
8. Can you provide examples of recent developments in the market?
October 2023: Bharti Group entered an agreement with its partner AXA to purchase AXA's 49% ownership stake in Bharti AXA Life Insurance. The completion of the transaction was anticipated by December 2023.
9. What pricing options are available for accessing the report?
Pricing options include single-user, multi-user, and enterprise licenses priced at USD 4750, USD 5250, and USD 8750 respectively.
10. Is the market size provided in terms of value or volume?
The market size is provided in terms of value, measured in billion and volume, measured in Billion.
11. Are there any specific market keywords associated with the report?
Yes, the market keyword associated with the report is "Microinsurance Market," which aids in identifying and referencing the specific market segment covered.
12. How do I determine which pricing option suits my needs best?
The pricing options vary based on user requirements and access needs. Individual users may opt for single-user licenses, while businesses requiring broader access may choose multi-user or enterprise licenses for cost-effective access to the report.
13. Are there any additional resources or data provided in the Microinsurance Market report?
While the report offers comprehensive insights, it's advisable to review the specific contents or supplementary materials provided to ascertain if additional resources or data are available.
14. How can I stay updated on further developments or reports in the Microinsurance Market?
To stay informed about further developments, trends, and reports in the Microinsurance Market, consider subscribing to industry newsletters, following relevant companies and organizations, or regularly checking reputable industry news sources and publications.
Methodology
Step 1 - Identification of Relevant Samples Size from Population Database


Step 2 - Approaches for Defining Global Market Size (Value, Volume* & Price*)

Note*: In applicable scenarios
Step 3 - Data Sources
Primary Research
- Web Analytics
- Survey Reports
- Research Institute
- Latest Research Reports
- Opinion Leaders
Secondary Research
- Annual Reports
- White Paper
- Latest Press Release
- Industry Association
- Paid Database
- Investor Presentations

Step 4 - Data Triangulation
Involves using different sources of information in order to increase the validity of a study
These sources are likely to be stakeholders in a program - participants, other researchers, program staff, other community members, and so on.
Then we put all data in single framework & apply various statistical tools to find out the dynamic on the market.
During the analysis stage, feedback from the stakeholder groups would be compared to determine areas of agreement as well as areas of divergence