

Key Insights
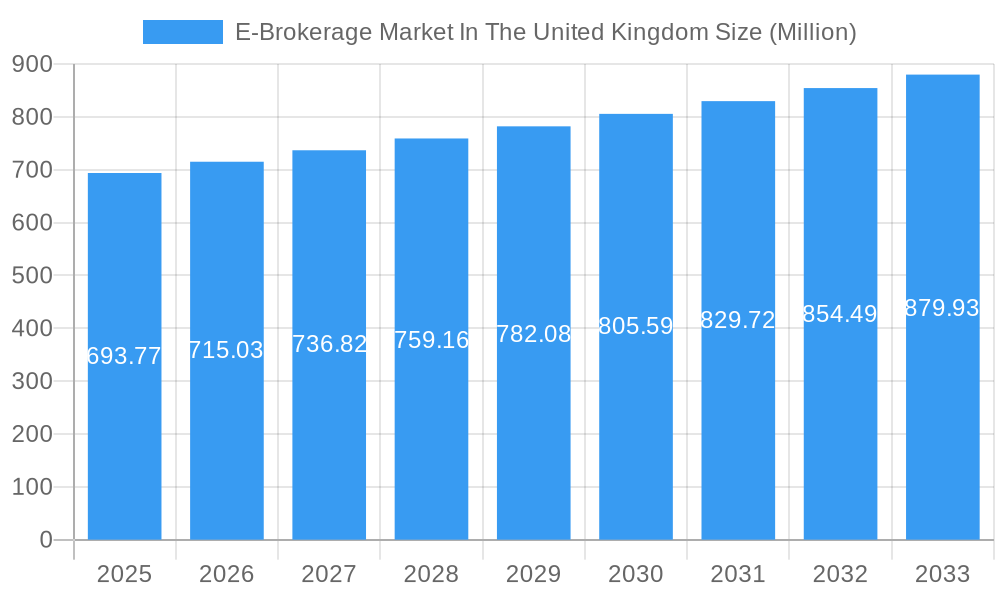
The UK e-brokerage market, valued at £693.77 million in 2025, exhibits a steady growth trajectory, projected to expand at a Compound Annual Growth Rate (CAGR) of 2.83% from 2025 to 2033. This growth is fueled by several key factors. Increased smartphone penetration and internet accessibility have democratized access to financial markets, empowering retail investors to actively participate in trading. Furthermore, the rise of mobile-first trading platforms, offering user-friendly interfaces and advanced analytical tools, has significantly lowered the barrier to entry for novice traders. The competitive landscape, characterized by established players like eToro, IG Group, and newer entrants like Robinhood, fosters innovation and drives down trading fees, further stimulating market expansion. Regulatory changes promoting investor protection and transparency also contribute to market growth, enhancing confidence and attracting a broader investor base.
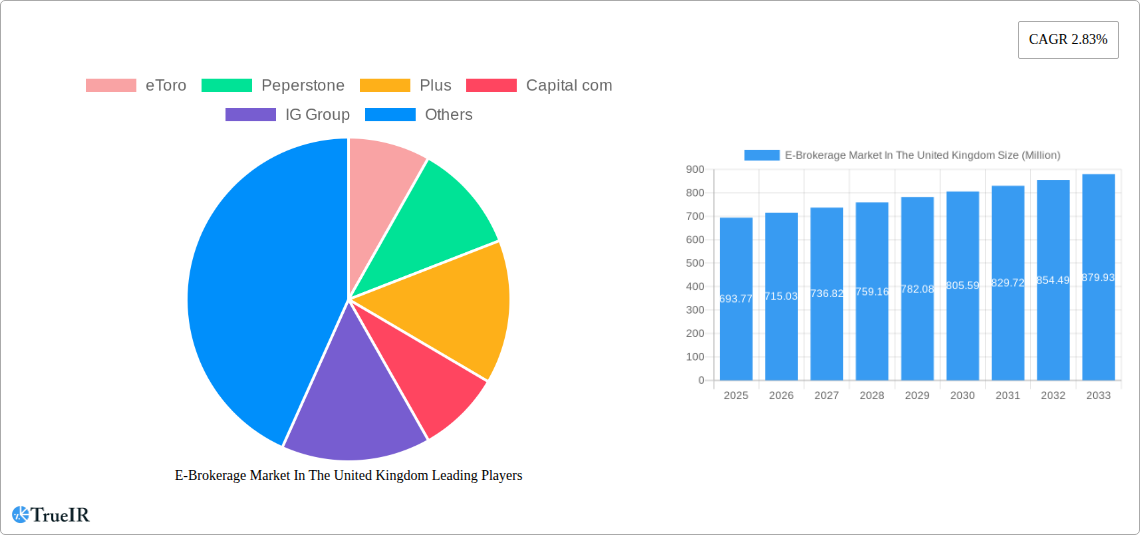
E-Brokerage Market In The United Kingdom Market Size (In Million)
However, potential restraints exist. Economic downturns can negatively impact investor sentiment and trading volumes. Increased regulatory scrutiny, aimed at mitigating risks associated with leveraged trading and protecting vulnerable investors, may impact profitability for some brokers. Cybersecurity threats and data breaches remain a persistent concern for online brokerage platforms, demanding robust security measures and potentially increasing operational costs. The market's future will depend on the continued adoption of innovative technologies, such as AI-powered trading tools and enhanced security protocols, coupled with a proactive response to evolving regulatory requirements. Competition will likely intensify, requiring brokers to differentiate themselves through superior customer service, advanced trading platforms, and competitive pricing strategies to maintain market share.
E-Brokerage Market In The United Kingdom Company Market Share
E-Brokerage Market in the United Kingdom: A Comprehensive Market Report (2019-2033)
This dynamic report provides a detailed analysis of the UK e-brokerage market, encompassing market size, trends, competitive landscape, and future outlook from 2019 to 2033. Leveraging extensive data and insights, this study is an indispensable resource for investors, industry stakeholders, and anyone seeking a comprehensive understanding of this rapidly evolving sector. The report covers key players like eToro, Peperstone, Plus500, Capital.com, IG Group, City Index, Robinhood, AvaTrade, Monesta Markets, and Stocktrade, and examines significant industry developments, including recent mergers and new market entrants.
E-Brokerage Market In The United Kingdom Market Structure & Competitive Landscape
The UK e-brokerage market exhibits a moderately concentrated structure, with a handful of established players commanding significant market share. However, the market is characterized by intense competition, driven by innovation and the entry of new players. The market concentration ratio (CR4) for 2024 is estimated at xx%, reflecting the presence of several significant players and a number of smaller niche players. Regulatory changes, particularly concerning investor protection and data privacy, exert a considerable influence on market dynamics. Product substitutes, such as investment platforms offered by traditional banks and robo-advisors, also pose a competitive challenge. The market is segmented primarily by client type (retail vs. institutional), trading platform (web vs. mobile), and asset class (stocks, forex, etc).
- Innovation Drivers: Technological advancements in trading platforms, artificial intelligence (AI)-powered trading tools, and enhanced mobile capabilities are key innovation drivers.
- Regulatory Impacts: Compliance with the Financial Conduct Authority (FCA) regulations significantly impacts operating costs and market entry barriers.
- Product Substitutes: Traditional brokerage services and robo-advisors present alternative investment options.
- End-User Segmentation: Retail investors represent the largest segment, with increasing participation of younger, tech-savvy investors. Institutional investors constitute a smaller but significant segment.
- M&A Trends: The recent merger between Cenkos and FinnCap (March 2023) exemplifies the consolidation trend within the market, aiming for increased scale and client base. The estimated M&A volume in the UK e-brokerage sector for the period 2019-2024 was approximately £xx Million.
E-Brokerage Market In The United Kingdom Market Trends & Opportunities
The UK e-brokerage market is experiencing robust growth, fueled by factors such as rising internet and smartphone penetration, increased financial literacy among younger generations, and the growing popularity of online investing. The market size, estimated at £xx Million in 2025, is projected to reach £xx Million by 2033, exhibiting a Compound Annual Growth Rate (CAGR) of xx% during the forecast period (2025-2033). Technological advancements like AI-driven trading algorithms and fractional share trading are transforming investor experience and creating new opportunities. Changing consumer preferences, such as a shift towards commission-free trading and personalized investment services, are shaping market dynamics. Competitive pressures remain high, with established players focusing on product innovation and aggressive marketing strategies to attract and retain clients. Market penetration rate for online brokerage in 2025 is estimated to be at xx%, signifying substantial growth potential.
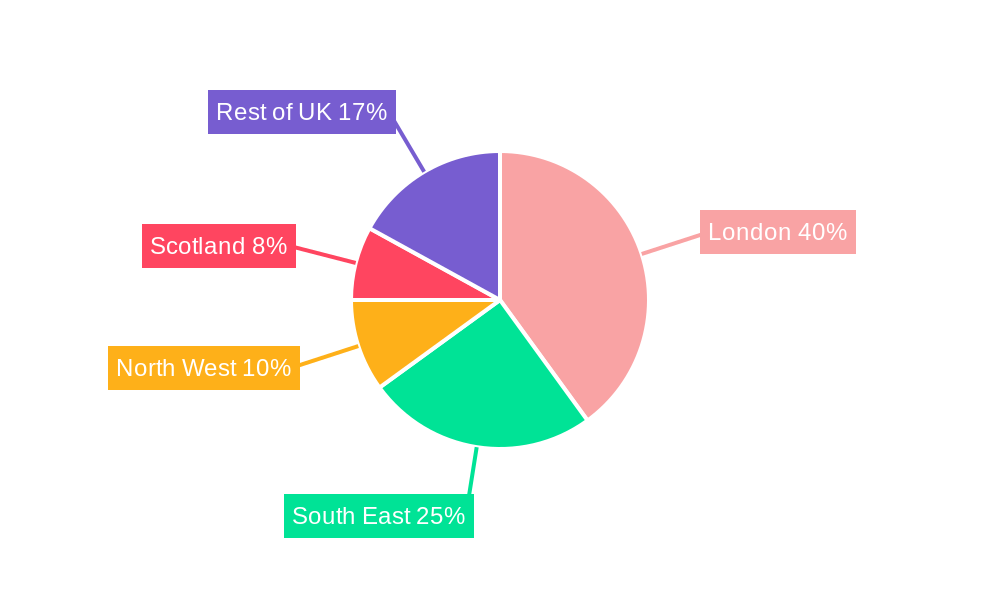
Dominant Markets & Segments in E-Brokerage Market In The United Kingdom
The UK e-brokerage market is geographically concentrated, with London and other major urban centers exhibiting higher market penetration due to higher concentration of affluent individuals and sophisticated financial infrastructure.
- Key Growth Drivers:
- High internet and smartphone penetration.
- Growing financial literacy and awareness among retail investors.
- Favorable regulatory environment promoting financial innovation.
- Availability of advanced trading technologies and platforms.
- Market Dominance Analysis: The dominance of certain players is largely determined by their brand recognition, technological capabilities, customer service offerings, and regulatory compliance. Larger players often benefit from economies of scale and significant investments in technology and marketing. Regional variations in market penetration exist, with London and other major cities exhibiting higher usage compared to smaller towns.
E-Brokerage Market In The United Kingdom Product Analysis
The UK e-brokerage market showcases diverse product offerings, ranging from basic trading platforms to sophisticated investment tools. Key product innovations include advanced charting tools, AI-powered trading recommendations, and fractional share trading options. The competitive advantage often lies in providing a seamless user experience, intuitive interfaces, and a wide range of investment instruments catering to varying risk appetites. The market is also experiencing the integration of socially-driven investments and educational resources within trading platforms.
Key Drivers, Barriers & Challenges in E-Brokerage Market In The United Kingdom
Key Drivers: Technological advancements, including AI-driven trading tools and enhanced mobile platforms, are driving market expansion. Increasing financial literacy and the growing popularity of online investing are also key drivers. Supportive regulatory environments also foster innovation and growth.
Key Challenges & Restraints: Stringent regulatory compliance requirements, including anti-money laundering (AML) and know-your-customer (KYC) regulations, pose significant operational and financial burdens. Cybersecurity threats and data breaches present a major challenge for e-brokerage firms. The high level of competition necessitates continuous product development and aggressive marketing to maintain market share. Furthermore, the volatility of financial markets directly affects trading volumes and investor confidence. The estimated cost of regulatory compliance for a medium-sized e-brokerage firm in 2024 was approximately £xx Million.
Growth Drivers in the E-Brokerage Market In The United Kingdom Market
The UK's e-brokerage market is propelled by increasing smartphone penetration, growing financial literacy, and a younger generation more comfortable with online investing. Technological advancements, such as AI-powered trading tools and improved mobile platforms, further enhance accessibility and user experience. Moreover, supportive regulatory frameworks that encourage innovation are crucial drivers. The entry of new players with innovative business models also contributes to market dynamism.
Challenges Impacting E-Brokerage Market In The United Kingdom Growth
Challenges include the stringent regulatory landscape, demanding high compliance costs and potential operational complexities. Cybersecurity threats and data privacy concerns pose significant risks to both firms and investors. Intense competition requires constant innovation to retain market share. Economic downturns directly impact trading volumes and investor sentiment, leading to revenue fluctuations.
Key Players Shaping the E-Brokerage Market In The United Kingdom Market
- eToro
- Peperstone
- Plus500
- Capital.com
- IG Group
- City Index
- Robinhood
- AvaTrade
- Monesta Markets
- Stocktrade
Significant E-Brokerage Market In The United Kingdom Industry Milestones
- March 2023: Cenkos and FinnCap merge, creating a stronger entity in the UK brokerage market.
- July 2023: Public, a US-based brokerage firm, launches commission-free trading for US stocks in the UK market, introducing a new competitive dynamic.
Future Outlook for E-Brokerage Market In The United Kingdom Market
The UK e-brokerage market is poised for sustained growth, driven by continuous technological innovation, increasing financial inclusion, and the ongoing adoption of digital investment platforms. Strategic partnerships, acquisitions, and expansion into niche markets present significant opportunities for players to capitalize on evolving consumer preferences and market demands. The continued penetration of mobile trading and the growing adoption of AI-powered investment tools are expected to shape future growth trajectories.
E-Brokerage Market In The United Kingdom Segmentation
-
1. Investor
- 1.1. Retail
- 1.2. Institutional
-
2. Operation
- 2.1. Domestic
- 2.2. Foreign
E-Brokerage Market In The United Kingdom Segmentation By Geography
-
1. North America
- 1.1. United States
- 1.2. Canada
- 1.3. Mexico
-
2. South America
- 2.1. Brazil
- 2.2. Argentina
- 2.3. Rest of South America
-
3. Europe
- 3.1. United Kingdom
- 3.2. Germany
- 3.3. France
- 3.4. Italy
- 3.5. Spain
- 3.6. Russia
- 3.7. Benelux
- 3.8. Nordics
- 3.9. Rest of Europe
-
4. Middle East & Africa
- 4.1. Turkey
- 4.2. Israel
- 4.3. GCC
- 4.4. North Africa
- 4.5. South Africa
- 4.6. Rest of Middle East & Africa
-
5. Asia Pacific
- 5.1. China
- 5.2. India
- 5.3. Japan
- 5.4. South Korea
- 5.5. ASEAN
- 5.6. Oceania
- 5.7. Rest of Asia Pacific
E-Brokerage Market In The United Kingdom Regional Market Share
Geographic Coverage of E-Brokerage Market In The United Kingdom
E-Brokerage Market In The United Kingdom REPORT HIGHLIGHTS
| Aspects | Details |
|---|---|
| Study Period | 2020-2034 |
| Base Year | 2025 |
| Estimated Year | 2026 |
| Forecast Period | 2026-2034 |
| Historical Period | 2020-2025 |
| Growth Rate | CAGR of 2.83% from 2020-2034 |
| Segmentation |
|
Table of Contents
- 1. Introduction
- 1.1. Research Scope
- 1.2. Market Segmentation
- 1.3. Research Objective
- 1.4. Definitions and Assumptions
- 2. Executive Summary
- 2.1. Market Snapshot
- 3. Market Dynamics
- 3.1. Market Drivers
- 3.2. Market Restrains
- 3.3. Market Trends
- 3.4. Market Opportunities
- 4. Market Factor Analysis
- 4.1. Porters Five Forces
- 4.1.1. Bargaining Power of Suppliers
- 4.1.2. Bargaining Power of Buyers
- 4.1.3. Threat of New Entrants
- 4.1.4. Threat of Substitutes
- 4.1.5. Competitive Rivalry
- 4.2. PESTEL analysis
- 4.3. BCG Analysis
- 4.3.1. Stars (High Growth, High Market Share)
- 4.3.2. Cash Cows (Low Growth, High Market Share)
- 4.3.3. Question Mark (High Growth, Low Market Share)
- 4.3.4. Dogs (Low Growth, Low Market Share)
- 4.4. Ansoff Matrix Analysis
- 4.5. Supply Chain Analysis
- 4.6. Regulatory Landscape
- 4.7. Current Market Potential and Opportunity Assessment (TAM–SAM–SOM Framework)
- 4.8. TIR Analyst Note
- 4.1. Porters Five Forces
- 5. Market Analysis, Insights and Forecast 2021-2033
- 5.1. Market Analysis, Insights and Forecast - by Investor
- 5.1.1. Retail
- 5.1.2. Institutional
- 5.2. Market Analysis, Insights and Forecast - by Operation
- 5.2.1. Domestic
- 5.2.2. Foreign
- 5.3. Market Analysis, Insights and Forecast - by Region
- 5.3.1. North America
- 5.3.2. South America
- 5.3.3. Europe
- 5.3.4. Middle East & Africa
- 5.3.5. Asia Pacific
- 5.1. Market Analysis, Insights and Forecast - by Investor
- 6. Global E-Brokerage Market In The United Kingdom Analysis, Insights and Forecast, 2021-2033
- 6.1. Market Analysis, Insights and Forecast - by Investor
- 6.1.1. Retail
- 6.1.2. Institutional
- 6.2. Market Analysis, Insights and Forecast - by Operation
- 6.2.1. Domestic
- 6.2.2. Foreign
- 6.1. Market Analysis, Insights and Forecast - by Investor
- 7. North America E-Brokerage Market In The United Kingdom Analysis, Insights and Forecast, 2020-2032
- 7.1. Market Analysis, Insights and Forecast - by Investor
- 7.1.1. Retail
- 7.1.2. Institutional
- 7.2. Market Analysis, Insights and Forecast - by Operation
- 7.2.1. Domestic
- 7.2.2. Foreign
- 7.1. Market Analysis, Insights and Forecast - by Investor
- 8. South America E-Brokerage Market In The United Kingdom Analysis, Insights and Forecast, 2020-2032
- 8.1. Market Analysis, Insights and Forecast - by Investor
- 8.1.1. Retail
- 8.1.2. Institutional
- 8.2. Market Analysis, Insights and Forecast - by Operation
- 8.2.1. Domestic
- 8.2.2. Foreign
- 8.1. Market Analysis, Insights and Forecast - by Investor
- 9. Europe E-Brokerage Market In The United Kingdom Analysis, Insights and Forecast, 2020-2032
- 9.1. Market Analysis, Insights and Forecast - by Investor
- 9.1.1. Retail
- 9.1.2. Institutional
- 9.2. Market Analysis, Insights and Forecast - by Operation
- 9.2.1. Domestic
- 9.2.2. Foreign
- 9.1. Market Analysis, Insights and Forecast - by Investor
- 10. Middle East & Africa E-Brokerage Market In The United Kingdom Analysis, Insights and Forecast, 2020-2032
- 10.1. Market Analysis, Insights and Forecast - by Investor
- 10.1.1. Retail
- 10.1.2. Institutional
- 10.2. Market Analysis, Insights and Forecast - by Operation
- 10.2.1. Domestic
- 10.2.2. Foreign
- 10.1. Market Analysis, Insights and Forecast - by Investor
- 11. Asia Pacific E-Brokerage Market In The United Kingdom Analysis, Insights and Forecast, 2020-2032
- 11.1. Market Analysis, Insights and Forecast - by Investor
- 11.1.1. Retail
- 11.1.2. Institutional
- 11.2. Market Analysis, Insights and Forecast - by Operation
- 11.2.1. Domestic
- 11.2.2. Foreign
- 11.1. Market Analysis, Insights and Forecast - by Investor
- 12. Competitive Analysis
- 12.1. Company Profiles
- 12.1.1 eToro
- 12.1.1.1. Company Overview
- 12.1.1.2. Products
- 12.1.1.3. Company Financials
- 12.1.1.4. SWOT Analysis
- 12.1.2 Peperstone
- 12.1.2.1. Company Overview
- 12.1.2.2. Products
- 12.1.2.3. Company Financials
- 12.1.2.4. SWOT Analysis
- 12.1.3 Plus
- 12.1.3.1. Company Overview
- 12.1.3.2. Products
- 12.1.3.3. Company Financials
- 12.1.3.4. SWOT Analysis
- 12.1.4 Capital com
- 12.1.4.1. Company Overview
- 12.1.4.2. Products
- 12.1.4.3. Company Financials
- 12.1.4.4. SWOT Analysis
- 12.1.5 IG Group
- 12.1.5.1. Company Overview
- 12.1.5.2. Products
- 12.1.5.3. Company Financials
- 12.1.5.4. SWOT Analysis
- 12.1.6 City Index
- 12.1.6.1. Company Overview
- 12.1.6.2. Products
- 12.1.6.3. Company Financials
- 12.1.6.4. SWOT Analysis
- 12.1.7 Robinhood
- 12.1.7.1. Company Overview
- 12.1.7.2. Products
- 12.1.7.3. Company Financials
- 12.1.7.4. SWOT Analysis
- 12.1.8 AvaTrade
- 12.1.8.1. Company Overview
- 12.1.8.2. Products
- 12.1.8.3. Company Financials
- 12.1.8.4. SWOT Analysis
- 12.1.9 Monesta Markets
- 12.1.9.1. Company Overview
- 12.1.9.2. Products
- 12.1.9.3. Company Financials
- 12.1.9.4. SWOT Analysis
- 12.1.10 Stocktrade
- 12.1.10.1. Company Overview
- 12.1.10.2. Products
- 12.1.10.3. Company Financials
- 12.1.10.4. SWOT Analysis
- 12.1.1 eToro
- 12.2. Market Entropy
- 12.2.1 Company's Key Areas Served
- 12.2.2 Recent Developments
- 12.3. Company Market Share Analysis 2025
- 12.3.1 Top 5 Companies Market Share Analysis
- 12.3.2 Top 3 Companies Market Share Analysis
- 12.4. List of Potential Customers
- 13. Research Methodology
List of Figures
- Figure 1: Global E-Brokerage Market In The United Kingdom Revenue Breakdown (Million, %) by Region 2025 & 2033
- Figure 2: Global E-Brokerage Market In The United Kingdom Volume Breakdown (Million, %) by Region 2025 & 2033
- Figure 3: North America E-Brokerage Market In The United Kingdom Revenue (Million), by Investor 2025 & 2033
- Figure 4: North America E-Brokerage Market In The United Kingdom Volume (Million), by Investor 2025 & 2033
- Figure 5: North America E-Brokerage Market In The United Kingdom Revenue Share (%), by Investor 2025 & 2033
- Figure 6: North America E-Brokerage Market In The United Kingdom Volume Share (%), by Investor 2025 & 2033
- Figure 7: North America E-Brokerage Market In The United Kingdom Revenue (Million), by Operation 2025 & 2033
- Figure 8: North America E-Brokerage Market In The United Kingdom Volume (Million), by Operation 2025 & 2033
- Figure 9: North America E-Brokerage Market In The United Kingdom Revenue Share (%), by Operation 2025 & 2033
- Figure 10: North America E-Brokerage Market In The United Kingdom Volume Share (%), by Operation 2025 & 2033
- Figure 11: North America E-Brokerage Market In The United Kingdom Revenue (Million), by Country 2025 & 2033
- Figure 12: North America E-Brokerage Market In The United Kingdom Volume (Million), by Country 2025 & 2033
- Figure 13: North America E-Brokerage Market In The United Kingdom Revenue Share (%), by Country 2025 & 2033
- Figure 14: North America E-Brokerage Market In The United Kingdom Volume Share (%), by Country 2025 & 2033
- Figure 15: South America E-Brokerage Market In The United Kingdom Revenue (Million), by Investor 2025 & 2033
- Figure 16: South America E-Brokerage Market In The United Kingdom Volume (Million), by Investor 2025 & 2033
- Figure 17: South America E-Brokerage Market In The United Kingdom Revenue Share (%), by Investor 2025 & 2033
- Figure 18: South America E-Brokerage Market In The United Kingdom Volume Share (%), by Investor 2025 & 2033
- Figure 19: South America E-Brokerage Market In The United Kingdom Revenue (Million), by Operation 2025 & 2033
- Figure 20: South America E-Brokerage Market In The United Kingdom Volume (Million), by Operation 2025 & 2033
- Figure 21: South America E-Brokerage Market In The United Kingdom Revenue Share (%), by Operation 2025 & 2033
- Figure 22: South America E-Brokerage Market In The United Kingdom Volume Share (%), by Operation 2025 & 2033
- Figure 23: South America E-Brokerage Market In The United Kingdom Revenue (Million), by Country 2025 & 2033
- Figure 24: South America E-Brokerage Market In The United Kingdom Volume (Million), by Country 2025 & 2033
- Figure 25: South America E-Brokerage Market In The United Kingdom Revenue Share (%), by Country 2025 & 2033
- Figure 26: South America E-Brokerage Market In The United Kingdom Volume Share (%), by Country 2025 & 2033
- Figure 27: Europe E-Brokerage Market In The United Kingdom Revenue (Million), by Investor 2025 & 2033
- Figure 28: Europe E-Brokerage Market In The United Kingdom Volume (Million), by Investor 2025 & 2033
- Figure 29: Europe E-Brokerage Market In The United Kingdom Revenue Share (%), by Investor 2025 & 2033
- Figure 30: Europe E-Brokerage Market In The United Kingdom Volume Share (%), by Investor 2025 & 2033
- Figure 31: Europe E-Brokerage Market In The United Kingdom Revenue (Million), by Operation 2025 & 2033
- Figure 32: Europe E-Brokerage Market In The United Kingdom Volume (Million), by Operation 2025 & 2033
- Figure 33: Europe E-Brokerage Market In The United Kingdom Revenue Share (%), by Operation 2025 & 2033
- Figure 34: Europe E-Brokerage Market In The United Kingdom Volume Share (%), by Operation 2025 & 2033
- Figure 35: Europe E-Brokerage Market In The United Kingdom Revenue (Million), by Country 2025 & 2033
- Figure 36: Europe E-Brokerage Market In The United Kingdom Volume (Million), by Country 2025 & 2033
- Figure 37: Europe E-Brokerage Market In The United Kingdom Revenue Share (%), by Country 2025 & 2033
- Figure 38: Europe E-Brokerage Market In The United Kingdom Volume Share (%), by Country 2025 & 2033
- Figure 39: Middle East & Africa E-Brokerage Market In The United Kingdom Revenue (Million), by Investor 2025 & 2033
- Figure 40: Middle East & Africa E-Brokerage Market In The United Kingdom Volume (Million), by Investor 2025 & 2033
- Figure 41: Middle East & Africa E-Brokerage Market In The United Kingdom Revenue Share (%), by Investor 2025 & 2033
- Figure 42: Middle East & Africa E-Brokerage Market In The United Kingdom Volume Share (%), by Investor 2025 & 2033
- Figure 43: Middle East & Africa E-Brokerage Market In The United Kingdom Revenue (Million), by Operation 2025 & 2033
- Figure 44: Middle East & Africa E-Brokerage Market In The United Kingdom Volume (Million), by Operation 2025 & 2033
- Figure 45: Middle East & Africa E-Brokerage Market In The United Kingdom Revenue Share (%), by Operation 2025 & 2033
- Figure 46: Middle East & Africa E-Brokerage Market In The United Kingdom Volume Share (%), by Operation 2025 & 2033
- Figure 47: Middle East & Africa E-Brokerage Market In The United Kingdom Revenue (Million), by Country 2025 & 2033
- Figure 48: Middle East & Africa E-Brokerage Market In The United Kingdom Volume (Million), by Country 2025 & 2033
- Figure 49: Middle East & Africa E-Brokerage Market In The United Kingdom Revenue Share (%), by Country 2025 & 2033
- Figure 50: Middle East & Africa E-Brokerage Market In The United Kingdom Volume Share (%), by Country 2025 & 2033
- Figure 51: Asia Pacific E-Brokerage Market In The United Kingdom Revenue (Million), by Investor 2025 & 2033
- Figure 52: Asia Pacific E-Brokerage Market In The United Kingdom Volume (Million), by Investor 2025 & 2033
- Figure 53: Asia Pacific E-Brokerage Market In The United Kingdom Revenue Share (%), by Investor 2025 & 2033
- Figure 54: Asia Pacific E-Brokerage Market In The United Kingdom Volume Share (%), by Investor 2025 & 2033
- Figure 55: Asia Pacific E-Brokerage Market In The United Kingdom Revenue (Million), by Operation 2025 & 2033
- Figure 56: Asia Pacific E-Brokerage Market In The United Kingdom Volume (Million), by Operation 2025 & 2033
- Figure 57: Asia Pacific E-Brokerage Market In The United Kingdom Revenue Share (%), by Operation 2025 & 2033
- Figure 58: Asia Pacific E-Brokerage Market In The United Kingdom Volume Share (%), by Operation 2025 & 2033
- Figure 59: Asia Pacific E-Brokerage Market In The United Kingdom Revenue (Million), by Country 2025 & 2033
- Figure 60: Asia Pacific E-Brokerage Market In The United Kingdom Volume (Million), by Country 2025 & 2033
- Figure 61: Asia Pacific E-Brokerage Market In The United Kingdom Revenue Share (%), by Country 2025 & 2033
- Figure 62: Asia Pacific E-Brokerage Market In The United Kingdom Volume Share (%), by Country 2025 & 2033
List of Tables
- Table 1: Global E-Brokerage Market In The United Kingdom Revenue Million Forecast, by Investor 2020 & 2033
- Table 2: Global E-Brokerage Market In The United Kingdom Volume Million Forecast, by Investor 2020 & 2033
- Table 3: Global E-Brokerage Market In The United Kingdom Revenue Million Forecast, by Operation 2020 & 2033
- Table 4: Global E-Brokerage Market In The United Kingdom Volume Million Forecast, by Operation 2020 & 2033
- Table 5: Global E-Brokerage Market In The United Kingdom Revenue Million Forecast, by Region 2020 & 2033
- Table 6: Global E-Brokerage Market In The United Kingdom Volume Million Forecast, by Region 2020 & 2033
- Table 7: Global E-Brokerage Market In The United Kingdom Revenue Million Forecast, by Investor 2020 & 2033
- Table 8: Global E-Brokerage Market In The United Kingdom Volume Million Forecast, by Investor 2020 & 2033
- Table 9: Global E-Brokerage Market In The United Kingdom Revenue Million Forecast, by Operation 2020 & 2033
- Table 10: Global E-Brokerage Market In The United Kingdom Volume Million Forecast, by Operation 2020 & 2033
- Table 11: Global E-Brokerage Market In The United Kingdom Revenue Million Forecast, by Country 2020 & 2033
- Table 12: Global E-Brokerage Market In The United Kingdom Volume Million Forecast, by Country 2020 & 2033
- Table 13: United States E-Brokerage Market In The United Kingdom Revenue (Million) Forecast, by Application 2020 & 2033
- Table 14: United States E-Brokerage Market In The United Kingdom Volume (Million) Forecast, by Application 2020 & 2033
- Table 15: Canada E-Brokerage Market In The United Kingdom Revenue (Million) Forecast, by Application 2020 & 2033
- Table 16: Canada E-Brokerage Market In The United Kingdom Volume (Million) Forecast, by Application 2020 & 2033
- Table 17: Mexico E-Brokerage Market In The United Kingdom Revenue (Million) Forecast, by Application 2020 & 2033
- Table 18: Mexico E-Brokerage Market In The United Kingdom Volume (Million) Forecast, by Application 2020 & 2033
- Table 19: Global E-Brokerage Market In The United Kingdom Revenue Million Forecast, by Investor 2020 & 2033
- Table 20: Global E-Brokerage Market In The United Kingdom Volume Million Forecast, by Investor 2020 & 2033
- Table 21: Global E-Brokerage Market In The United Kingdom Revenue Million Forecast, by Operation 2020 & 2033
- Table 22: Global E-Brokerage Market In The United Kingdom Volume Million Forecast, by Operation 2020 & 2033
- Table 23: Global E-Brokerage Market In The United Kingdom Revenue Million Forecast, by Country 2020 & 2033
- Table 24: Global E-Brokerage Market In The United Kingdom Volume Million Forecast, by Country 2020 & 2033
- Table 25: Brazil E-Brokerage Market In The United Kingdom Revenue (Million) Forecast, by Application 2020 & 2033
- Table 26: Brazil E-Brokerage Market In The United Kingdom Volume (Million) Forecast, by Application 2020 & 2033
- Table 27: Argentina E-Brokerage Market In The United Kingdom Revenue (Million) Forecast, by Application 2020 & 2033
- Table 28: Argentina E-Brokerage Market In The United Kingdom Volume (Million) Forecast, by Application 2020 & 2033
- Table 29: Rest of South America E-Brokerage Market In The United Kingdom Revenue (Million) Forecast, by Application 2020 & 2033
- Table 30: Rest of South America E-Brokerage Market In The United Kingdom Volume (Million) Forecast, by Application 2020 & 2033
- Table 31: Global E-Brokerage Market In The United Kingdom Revenue Million Forecast, by Investor 2020 & 2033
- Table 32: Global E-Brokerage Market In The United Kingdom Volume Million Forecast, by Investor 2020 & 2033
- Table 33: Global E-Brokerage Market In The United Kingdom Revenue Million Forecast, by Operation 2020 & 2033
- Table 34: Global E-Brokerage Market In The United Kingdom Volume Million Forecast, by Operation 2020 & 2033
- Table 35: Global E-Brokerage Market In The United Kingdom Revenue Million Forecast, by Country 2020 & 2033
- Table 36: Global E-Brokerage Market In The United Kingdom Volume Million Forecast, by Country 2020 & 2033
- Table 37: United Kingdom E-Brokerage Market In The United Kingdom Revenue (Million) Forecast, by Application 2020 & 2033
- Table 38: United Kingdom E-Brokerage Market In The United Kingdom Volume (Million) Forecast, by Application 2020 & 2033
- Table 39: Germany E-Brokerage Market In The United Kingdom Revenue (Million) Forecast, by Application 2020 & 2033
- Table 40: Germany E-Brokerage Market In The United Kingdom Volume (Million) Forecast, by Application 2020 & 2033
- Table 41: France E-Brokerage Market In The United Kingdom Revenue (Million) Forecast, by Application 2020 & 2033
- Table 42: France E-Brokerage Market In The United Kingdom Volume (Million) Forecast, by Application 2020 & 2033
- Table 43: Italy E-Brokerage Market In The United Kingdom Revenue (Million) Forecast, by Application 2020 & 2033
- Table 44: Italy E-Brokerage Market In The United Kingdom Volume (Million) Forecast, by Application 2020 & 2033
- Table 45: Spain E-Brokerage Market In The United Kingdom Revenue (Million) Forecast, by Application 2020 & 2033
- Table 46: Spain E-Brokerage Market In The United Kingdom Volume (Million) Forecast, by Application 2020 & 2033
- Table 47: Russia E-Brokerage Market In The United Kingdom Revenue (Million) Forecast, by Application 2020 & 2033
- Table 48: Russia E-Brokerage Market In The United Kingdom Volume (Million) Forecast, by Application 2020 & 2033
- Table 49: Benelux E-Brokerage Market In The United Kingdom Revenue (Million) Forecast, by Application 2020 & 2033
- Table 50: Benelux E-Brokerage Market In The United Kingdom Volume (Million) Forecast, by Application 2020 & 2033
- Table 51: Nordics E-Brokerage Market In The United Kingdom Revenue (Million) Forecast, by Application 2020 & 2033
- Table 52: Nordics E-Brokerage Market In The United Kingdom Volume (Million) Forecast, by Application 2020 & 2033
- Table 53: Rest of Europe E-Brokerage Market In The United Kingdom Revenue (Million) Forecast, by Application 2020 & 2033
- Table 54: Rest of Europe E-Brokerage Market In The United Kingdom Volume (Million) Forecast, by Application 2020 & 2033
- Table 55: Global E-Brokerage Market In The United Kingdom Revenue Million Forecast, by Investor 2020 & 2033
- Table 56: Global E-Brokerage Market In The United Kingdom Volume Million Forecast, by Investor 2020 & 2033
- Table 57: Global E-Brokerage Market In The United Kingdom Revenue Million Forecast, by Operation 2020 & 2033
- Table 58: Global E-Brokerage Market In The United Kingdom Volume Million Forecast, by Operation 2020 & 2033
- Table 59: Global E-Brokerage Market In The United Kingdom Revenue Million Forecast, by Country 2020 & 2033
- Table 60: Global E-Brokerage Market In The United Kingdom Volume Million Forecast, by Country 2020 & 2033
- Table 61: Turkey E-Brokerage Market In The United Kingdom Revenue (Million) Forecast, by Application 2020 & 2033
- Table 62: Turkey E-Brokerage Market In The United Kingdom Volume (Million) Forecast, by Application 2020 & 2033
- Table 63: Israel E-Brokerage Market In The United Kingdom Revenue (Million) Forecast, by Application 2020 & 2033
- Table 64: Israel E-Brokerage Market In The United Kingdom Volume (Million) Forecast, by Application 2020 & 2033
- Table 65: GCC E-Brokerage Market In The United Kingdom Revenue (Million) Forecast, by Application 2020 & 2033
- Table 66: GCC E-Brokerage Market In The United Kingdom Volume (Million) Forecast, by Application 2020 & 2033
- Table 67: North Africa E-Brokerage Market In The United Kingdom Revenue (Million) Forecast, by Application 2020 & 2033
- Table 68: North Africa E-Brokerage Market In The United Kingdom Volume (Million) Forecast, by Application 2020 & 2033
- Table 69: South Africa E-Brokerage Market In The United Kingdom Revenue (Million) Forecast, by Application 2020 & 2033
- Table 70: South Africa E-Brokerage Market In The United Kingdom Volume (Million) Forecast, by Application 2020 & 2033
- Table 71: Rest of Middle East & Africa E-Brokerage Market In The United Kingdom Revenue (Million) Forecast, by Application 2020 & 2033
- Table 72: Rest of Middle East & Africa E-Brokerage Market In The United Kingdom Volume (Million) Forecast, by Application 2020 & 2033
- Table 73: Global E-Brokerage Market In The United Kingdom Revenue Million Forecast, by Investor 2020 & 2033
- Table 74: Global E-Brokerage Market In The United Kingdom Volume Million Forecast, by Investor 2020 & 2033
- Table 75: Global E-Brokerage Market In The United Kingdom Revenue Million Forecast, by Operation 2020 & 2033
- Table 76: Global E-Brokerage Market In The United Kingdom Volume Million Forecast, by Operation 2020 & 2033
- Table 77: Global E-Brokerage Market In The United Kingdom Revenue Million Forecast, by Country 2020 & 2033
- Table 78: Global E-Brokerage Market In The United Kingdom Volume Million Forecast, by Country 2020 & 2033
- Table 79: China E-Brokerage Market In The United Kingdom Revenue (Million) Forecast, by Application 2020 & 2033
- Table 80: China E-Brokerage Market In The United Kingdom Volume (Million) Forecast, by Application 2020 & 2033
- Table 81: India E-Brokerage Market In The United Kingdom Revenue (Million) Forecast, by Application 2020 & 2033
- Table 82: India E-Brokerage Market In The United Kingdom Volume (Million) Forecast, by Application 2020 & 2033
- Table 83: Japan E-Brokerage Market In The United Kingdom Revenue (Million) Forecast, by Application 2020 & 2033
- Table 84: Japan E-Brokerage Market In The United Kingdom Volume (Million) Forecast, by Application 2020 & 2033
- Table 85: South Korea E-Brokerage Market In The United Kingdom Revenue (Million) Forecast, by Application 2020 & 2033
- Table 86: South Korea E-Brokerage Market In The United Kingdom Volume (Million) Forecast, by Application 2020 & 2033
- Table 87: ASEAN E-Brokerage Market In The United Kingdom Revenue (Million) Forecast, by Application 2020 & 2033
- Table 88: ASEAN E-Brokerage Market In The United Kingdom Volume (Million) Forecast, by Application 2020 & 2033
- Table 89: Oceania E-Brokerage Market In The United Kingdom Revenue (Million) Forecast, by Application 2020 & 2033
- Table 90: Oceania E-Brokerage Market In The United Kingdom Volume (Million) Forecast, by Application 2020 & 2033
- Table 91: Rest of Asia Pacific E-Brokerage Market In The United Kingdom Revenue (Million) Forecast, by Application 2020 & 2033
- Table 92: Rest of Asia Pacific E-Brokerage Market In The United Kingdom Volume (Million) Forecast, by Application 2020 & 2033
Frequently Asked Questions
1. What is the projected Compound Annual Growth Rate (CAGR) of the E-Brokerage Market In The United Kingdom?
The projected CAGR is approximately 2.83%.
2. Which companies are prominent players in the E-Brokerage Market In The United Kingdom?
Key companies in the market include eToro, Peperstone, Plus, Capital com, IG Group, City Index, Robinhood, AvaTrade, Monesta Markets, Stocktrade.
3. What are the main segments of the E-Brokerage Market In The United Kingdom?
The market segments include Investor, Operation.
4. Can you provide details about the market size?
The market size is estimated to be USD 693.77 Million as of 2022.
5. What are some drivers contributing to market growth?
Convenience and Cost-Effectiveness; Real Time Analysis of Market Available In E-Brokerage Platforms.
6. What are the notable trends driving market growth?
Rising Digital Innovation & Adoption of Artificial Intelligence (AI) and Machine Learning (ML).
7. Are there any restraints impacting market growth?
Convenience and Cost-Effectiveness; Real Time Analysis of Market Available In E-Brokerage Platforms.
8. Can you provide examples of recent developments in the market?
In March 2023, the United Kingdom broking firm Cenkos merged with FinnCap. Post merger both companies own a 50% share of the new firm with the company being named FinnCap. The merger will strengthen the position of both firms with an increase in clients and new customers.
9. What pricing options are available for accessing the report?
Pricing options include single-user, multi-user, and enterprise licenses priced at USD 3800, USD 4500, and USD 5800 respectively.
10. Is the market size provided in terms of value or volume?
The market size is provided in terms of value, measured in Million and volume, measured in Million.
11. Are there any specific market keywords associated with the report?
Yes, the market keyword associated with the report is "E-Brokerage Market In The United Kingdom," which aids in identifying and referencing the specific market segment covered.
12. How do I determine which pricing option suits my needs best?
The pricing options vary based on user requirements and access needs. Individual users may opt for single-user licenses, while businesses requiring broader access may choose multi-user or enterprise licenses for cost-effective access to the report.
13. Are there any additional resources or data provided in the E-Brokerage Market In The United Kingdom report?
While the report offers comprehensive insights, it's advisable to review the specific contents or supplementary materials provided to ascertain if additional resources or data are available.
14. How can I stay updated on further developments or reports in the E-Brokerage Market In The United Kingdom?
To stay informed about further developments, trends, and reports in the E-Brokerage Market In The United Kingdom, consider subscribing to industry newsletters, following relevant companies and organizations, or regularly checking reputable industry news sources and publications.
Methodology
Step 1 - Identification of Relevant Samples Size from Population Database


Step 2 - Approaches for Defining Global Market Size (Value, Volume* & Price*)

Note*: In applicable scenarios
Step 3 - Data Sources
Primary Research
- Web Analytics
- Survey Reports
- Research Institute
- Latest Research Reports
- Opinion Leaders
Secondary Research
- Annual Reports
- White Paper
- Latest Press Release
- Industry Association
- Paid Database
- Investor Presentations

Step 4 - Data Triangulation
Involves using different sources of information in order to increase the validity of a study
These sources are likely to be stakeholders in a program - participants, other researchers, program staff, other community members, and so on.
Then we put all data in single framework & apply various statistical tools to find out the dynamic on the market.
During the analysis stage, feedback from the stakeholder groups would be compared to determine areas of agreement as well as areas of divergence