

Key Insights
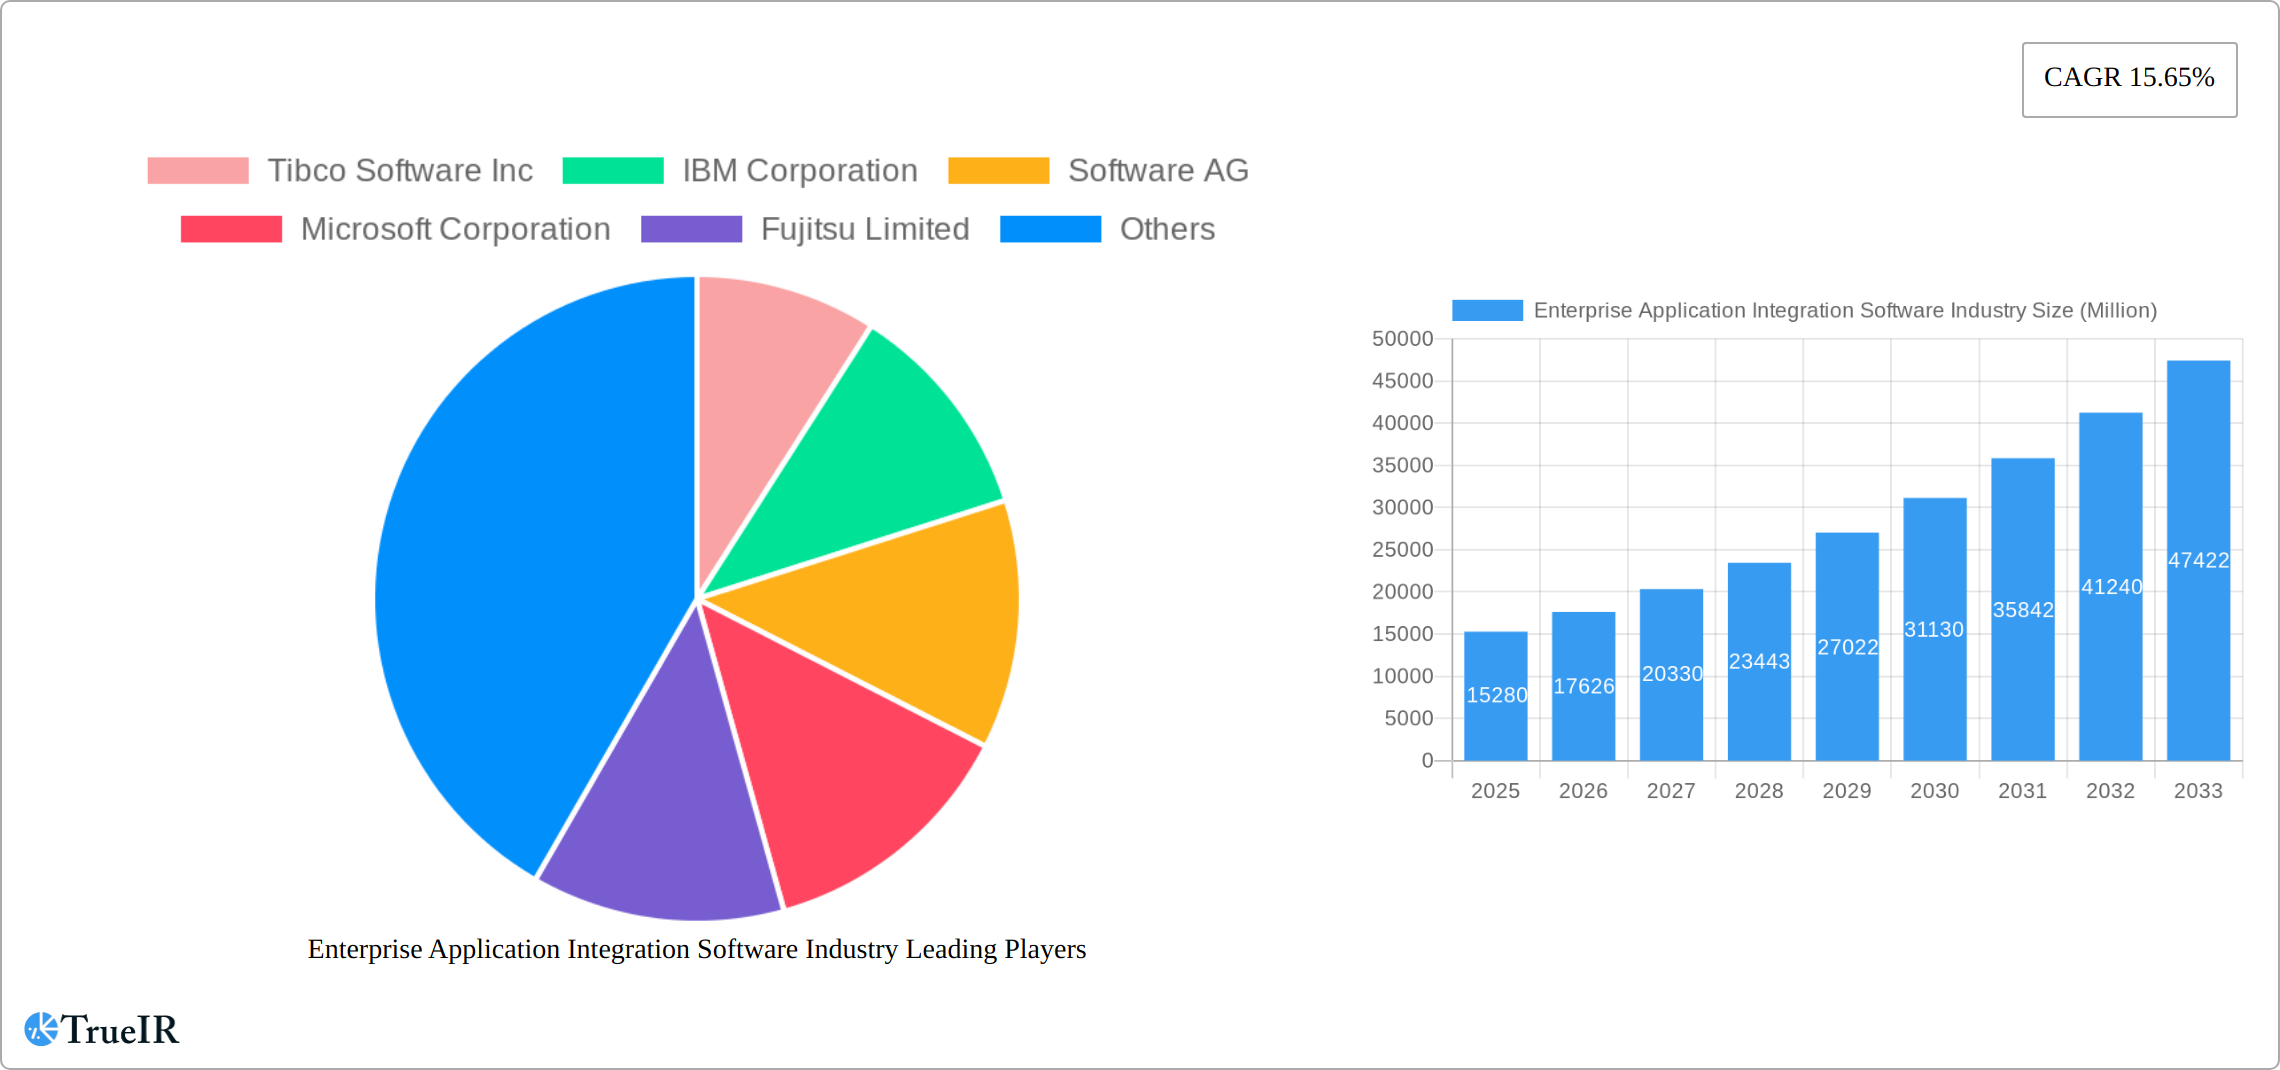
The Enterprise Application Integration (EAI) software market is experiencing robust growth, projected to reach a market size of $15.28 billion in 2025, exhibiting a Compound Annual Growth Rate (CAGR) of 15.65%. This expansion is driven by several key factors. The increasing need for businesses to seamlessly integrate diverse applications and data sources across their operations is a primary driver. This is particularly crucial for organizations undergoing digital transformation, seeking to improve operational efficiency, enhance customer experience, and gain valuable data-driven insights. Furthermore, the growing adoption of cloud-based solutions, offering scalability and flexibility, is significantly contributing to market growth. The rise of hybrid cloud models, combining on-premise and cloud deployments, further fuels this trend. Specific industry verticals like BFSI (Banking, Financial Services, and Insurance), IT and Telecom, and Healthcare are leading adopters due to their complex application landscapes and the critical need for secure and reliable data integration. The competitive landscape is characterized by established players like Tibco Software, IBM, Software AG, and Microsoft, alongside emerging innovative companies, leading to continuous advancements in EAI technology. The market's segmentation by deployment type (on-premise, cloud, hybrid), organization size (large enterprises, SMEs), and end-user industry reflects its diverse applications and tailored solutions across various organizational contexts.
Looking ahead, the EAI market is poised for sustained growth throughout the forecast period (2025-2033). Continued advancements in technologies like artificial intelligence (AI) and machine learning (ML) will further enhance the capabilities of EAI solutions, enabling more sophisticated integration processes and automating complex tasks. The increasing adoption of APIs (Application Programming Interfaces) will streamline integrations, making it easier for businesses to connect different systems. However, challenges such as data security concerns, integration complexities, and the need for skilled professionals to manage EAI systems may act as potential restraints on market growth. Despite these challenges, the overall market outlook remains positive, driven by increasing digitalization and the ongoing demand for improved interoperability and data management across diverse organizational systems. Geographically, North America and Europe currently hold significant market shares but the Asia-Pacific region is projected to witness substantial growth fueled by increasing digital adoption and economic expansion in developing economies.
Enterprise Application Integration Software Industry Market Report: 2019-2033
This comprehensive report provides a detailed analysis of the Enterprise Application Integration (EAI) software market, projecting a robust growth trajectory from 2019 to 2033. We delve into market structure, competitive dynamics, key segments, and future trends, offering invaluable insights for businesses operating within or seeking to enter this dynamic sector. The report leverages extensive data analysis and includes forecasts for market size reaching xx Million by 2033.
Enterprise Application Integration Software Industry Market Structure & Competitive Landscape
The Enterprise Application Integration (EAI) software market is characterized by a moderately concentrated landscape, with several major players holding significant market share. Concentration ratios (e.g., CR4) are estimated at xx%, indicating a degree of dominance by leading vendors. However, the market remains dynamic, with ongoing innovation driving competition. Key factors influencing the market structure include:
- Innovation Drivers: The continuous evolution of cloud computing, the rise of microservices architecture, and the increasing demand for real-time data integration fuel innovation within the EAI software market. New features like AI-powered integration and improved security protocols are constantly emerging.
- Regulatory Impacts: Data privacy regulations (e.g., GDPR, CCPA) significantly impact EAI software development and adoption. Vendors must ensure compliance, which adds to development costs but simultaneously creates opportunities for specialized solutions.
- Product Substitutes: While EAI software remains the primary solution for integrating disparate systems, alternative approaches like API management platforms and event-driven architectures offer some degree of substitution. However, the comprehensive nature of EAI software solutions maintains their overall dominance.
- End-User Segmentation: The market caters to both large enterprises and small and medium-sized enterprises (SMEs), with distinct needs and budgetary considerations shaping their choices. Large enterprises typically adopt more comprehensive, customized solutions, while SMEs often lean towards cloud-based, readily deployable options.
- M&A Trends: Mergers and acquisitions (M&A) activity in the EAI software sector has been significant in recent years (estimated xx Million in deals from 2019-2024). These activities reflect the ongoing consolidation of the market and the pursuit of broader capabilities and market reach by leading players. Strategic acquisitions, focusing on niche technologies or geographic expansion, are expected to continue.
Enterprise Application Integration Software Industry Market Trends & Opportunities
The global Enterprise Application Integration (EAI) software market is experiencing robust growth, projected to achieve a Compound Annual Growth Rate (CAGR) of [Insert Updated CAGR]% during the forecast period (2025-2035). This expansion is fueled by several converging factors:
- Market Size Expansion: The market, valued at [Insert Updated 2025 Market Size] Million in 2025, is poised to reach [Insert Updated 2035 Market Size] Million by 2035. This significant growth reflects the increasing adoption of EAI solutions across diverse industries and organizational sizes, from small businesses to large enterprises.
- Technological Advancements: The widespread adoption of cloud-native architectures, the proliferation of microservices, and the integration of Artificial Intelligence (AI) and Machine Learning (ML) capabilities within EAI platforms are key drivers. Hybrid and multi-cloud deployment models are gaining prominence, offering businesses greater flexibility and control over their IT infrastructure.
- Evolving Business Needs: Modern businesses prioritize real-time data integration for improved decision-making, enhanced security measures to protect sensitive data, and seamless user experiences to boost operational efficiency and employee productivity. These demands are shaping software development and feature prioritization within the EAI sector.
- Competitive Landscape: The EAI market is dynamic, characterized by both intense competition among established vendors and the emergence of innovative startups. This competitive pressure fosters continuous innovation, leading to improved products, competitive pricing, and expanded service offerings. Market penetration is estimated at [Insert Updated 2025 Market Penetration]% in 2025, with substantial growth potential in emerging markets.
Dominant Markets & Segments in Enterprise Application Integration Software Industry
The EAI software market exhibits substantial regional variation, with North America currently holding a dominant position (xx% of global market share in 2025). However, Asia-Pacific is poised for significant growth in the coming years. Key segment-specific dynamics include:
Deployment Type: Cloud-based deployments are witnessing the highest growth, driven by scalability, cost-effectiveness, and accessibility. Hybrid models are gaining prominence, balancing the benefits of cloud and on-premise solutions. On-premise deployment remains significant, particularly among large enterprises with stringent security requirements.
Organization Size: Large enterprises represent the most significant segment due to their complex IT infrastructure and greater integration needs. However, SMEs are increasingly adopting EAI solutions, driven by cost-efficiency and ease of use of cloud-based offerings.
End-user Industry: The BFSI (Banking, Financial Services, and Insurance), IT and Telecom, and Healthcare sectors are leading adopters, driven by stringent regulatory requirements, large volumes of data, and a constant need for operational efficiency. Retail, Government, and Manufacturing sectors are also experiencing growth in EAI adoption.
Growth Drivers:
- BFSI: Strict compliance regulations, need for enhanced security, and real-time data processing requirements are driving adoption.
- IT and Telecom: The need for efficient network management, service orchestration, and streamlined customer interactions fuels demand.
- Healthcare: Data interoperability, patient data security, and improved healthcare delivery efficiency are key drivers.
- Retail: Omni-channel integration, improved supply chain management, and customer relationship management (CRM) capabilities are driving growth.
Enterprise Application Integration Software Industry Product Analysis
EAI software solutions are increasingly incorporating advanced technologies such as artificial intelligence (AI), machine learning (ML), and robotic process automation (RPA) to improve integration speed, efficiency, and security. Cloud-native architectures, microservices, and event-driven architectures are becoming prevalent, enabling more flexible and scalable integration capabilities. The market success of a specific product hinges on factors such as ease of use, scalability, security features, integration capabilities with diverse systems, and overall cost-effectiveness.
Key Drivers, Barriers & Challenges in Enterprise Application Integration Software Industry
Key Drivers: The exponential growth in data volume and velocity, the critical need for real-time business intelligence, and the imperative for improved operational efficiency across organizations are primary drivers. The shift towards cloud-based infrastructure and the adoption of microservices architectures further necessitate robust and adaptable EAI solutions.
Key Challenges: High initial implementation costs, the complexities involved in integrating legacy systems with modern technologies, and a persistent shortage of skilled professionals in EAI represent significant hurdles. Stricter data privacy regulations (e.g., GDPR, CCPA) increase compliance burdens and add complexity to deployments. Furthermore, global supply chain disruptions continue to impact the availability of hardware and software components, leading to project delays and increased costs—estimated at [Insert Updated 2024 Lost Revenue] Million in lost revenue across the industry in 2024.
Growth Drivers in the Enterprise Application Integration Software Industry Market
Market expansion is significantly propelled by the rising demand for real-time data analytics and seamless integration across diverse business applications. The widespread adoption of cloud computing, the growing need for robust security protocols, and ongoing technological advancements such as AI and ML integrations are also key factors. Government initiatives promoting digital transformation and modernization further contribute to market growth.
Challenges Impacting Enterprise Application Integration Software Industry Growth
Significant barriers to growth include the complexities associated with integrating disparate legacy systems, the scarcity of skilled professionals capable of handling implementation and ongoing maintenance, and the high upfront investment required for deployment. The increasingly stringent regulatory landscape surrounding data privacy and security presents additional challenges, alongside the competitive pressures from both established and emerging industry players.
Key Players Shaping the Enterprise Application Integration Software Industry Market
- Tibco Software Inc
- IBM Corporation
- Software AG
- Microsoft Corporation
- Fujitsu Limited
- MuleSoft LLC (Salesforce Inc)
- Oracle Corporation
- iTransition Group
- SAP SE
Significant Enterprise Application Integration Software Industry Industry Milestones
- July 2022: TIBCO Software Inc. announced significant improvements to its TIBCO Cloud Integration product, enhancing capabilities for hybrid environments and accelerating business outcomes.
- August 2022: Salsify joined the MuleSoft Technology Partner Program, launching a MuleSoft Certified Connector to simplify secure integration with its platform, improving data reliability and streamlining maintenance.
Future Outlook for Enterprise Application Integration Software Industry Market
The EAI software market is poised for continued expansion, driven by the sustained demand for enhanced data integration capabilities, the increasing adoption of cloud-based and hybrid deployment models, and the ongoing innovation in areas such as AI and ML integration. Strategic partnerships, acquisitions, and a focus on delivering comprehensive, secure, and user-friendly solutions will be crucial for success in this competitive market. The market is projected to continue its growth trajectory, exceeding xx Million in revenue by 2033.
Enterprise Application Integration Software Industry Segmentation
-
1. Deployment Type
- 1.1. On-premise
- 1.2. Cloud
- 1.3. Hybrid
-
2. Organisation Size
- 2.1. Large Enterprises
- 2.2. Small and Medium-sized Enterprises
-
3. End-user Industry
- 3.1. BFSI
- 3.2. IT and Telecom
- 3.3. Healthcare
- 3.4. Retail
- 3.5. Government
- 3.6. Manufacturing
- 3.7. Other End-user Industries
Enterprise Application Integration Software Industry Segmentation By Geography
- 1. North America
- 2. Europe
- 3. Asia Pacific
- 4. Latin America
- 5. Middle East and Africa

Enterprise Application Integration Software Industry REPORT HIGHLIGHTS
| Aspects | Details |
|---|---|
| Study Period | 2019-2033 |
| Base Year | 2024 |
| Estimated Year | 2025 |
| Forecast Period | 2025-2033 |
| Historical Period | 2019-2024 |
| Growth Rate | CAGR of 15.65% from 2019-2033 |
| Segmentation |
|
Table of Contents
- 1. Introduction
- 1.1. Research Scope
- 1.2. Market Segmentation
- 1.3. Research Methodology
- 1.4. Definitions and Assumptions
- 2. Executive Summary
- 2.1. Introduction
- 3. Market Dynamics
- 3.1. Introduction
- 3.2. Market Drivers
- 3.2.1. Increasing Digital Transformation across Industries; Increasing Demand for Real-time Data Access and Management
- 3.3. Market Restrains
- 3.3.1. Loss of Control over Data Location Hinders the Market
- 3.4. Market Trends
- 3.4.1. Increasing Digital Transformation Across Industries to Drive the Market
- 4. Market Factor Analysis
- 4.1. Porters Five Forces
- 4.2. Supply/Value Chain
- 4.3. PESTEL analysis
- 4.4. Market Entropy
- 4.5. Patent/Trademark Analysis
- 5. Global Enterprise Application Integration Software Industry Analysis, Insights and Forecast, 2019-2031
- 5.1. Market Analysis, Insights and Forecast - by Deployment Type
- 5.1.1. On-premise
- 5.1.2. Cloud
- 5.1.3. Hybrid
- 5.2. Market Analysis, Insights and Forecast - by Organisation Size
- 5.2.1. Large Enterprises
- 5.2.2. Small and Medium-sized Enterprises
- 5.3. Market Analysis, Insights and Forecast - by End-user Industry
- 5.3.1. BFSI
- 5.3.2. IT and Telecom
- 5.3.3. Healthcare
- 5.3.4. Retail
- 5.3.5. Government
- 5.3.6. Manufacturing
- 5.3.7. Other End-user Industries
- 5.4. Market Analysis, Insights and Forecast - by Region
- 5.4.1. North America
- 5.4.2. Europe
- 5.4.3. Asia Pacific
- 5.4.4. Latin America
- 5.4.5. Middle East and Africa
- 5.1. Market Analysis, Insights and Forecast - by Deployment Type
- 6. North America Enterprise Application Integration Software Industry Analysis, Insights and Forecast, 2019-2031
- 6.1. Market Analysis, Insights and Forecast - by Deployment Type
- 6.1.1. On-premise
- 6.1.2. Cloud
- 6.1.3. Hybrid
- 6.2. Market Analysis, Insights and Forecast - by Organisation Size
- 6.2.1. Large Enterprises
- 6.2.2. Small and Medium-sized Enterprises
- 6.3. Market Analysis, Insights and Forecast - by End-user Industry
- 6.3.1. BFSI
- 6.3.2. IT and Telecom
- 6.3.3. Healthcare
- 6.3.4. Retail
- 6.3.5. Government
- 6.3.6. Manufacturing
- 6.3.7. Other End-user Industries
- 6.1. Market Analysis, Insights and Forecast - by Deployment Type
- 7. Europe Enterprise Application Integration Software Industry Analysis, Insights and Forecast, 2019-2031
- 7.1. Market Analysis, Insights and Forecast - by Deployment Type
- 7.1.1. On-premise
- 7.1.2. Cloud
- 7.1.3. Hybrid
- 7.2. Market Analysis, Insights and Forecast - by Organisation Size
- 7.2.1. Large Enterprises
- 7.2.2. Small and Medium-sized Enterprises
- 7.3. Market Analysis, Insights and Forecast - by End-user Industry
- 7.3.1. BFSI
- 7.3.2. IT and Telecom
- 7.3.3. Healthcare
- 7.3.4. Retail
- 7.3.5. Government
- 7.3.6. Manufacturing
- 7.3.7. Other End-user Industries
- 7.1. Market Analysis, Insights and Forecast - by Deployment Type
- 8. Asia Pacific Enterprise Application Integration Software Industry Analysis, Insights and Forecast, 2019-2031
- 8.1. Market Analysis, Insights and Forecast - by Deployment Type
- 8.1.1. On-premise
- 8.1.2. Cloud
- 8.1.3. Hybrid
- 8.2. Market Analysis, Insights and Forecast - by Organisation Size
- 8.2.1. Large Enterprises
- 8.2.2. Small and Medium-sized Enterprises
- 8.3. Market Analysis, Insights and Forecast - by End-user Industry
- 8.3.1. BFSI
- 8.3.2. IT and Telecom
- 8.3.3. Healthcare
- 8.3.4. Retail
- 8.3.5. Government
- 8.3.6. Manufacturing
- 8.3.7. Other End-user Industries
- 8.1. Market Analysis, Insights and Forecast - by Deployment Type
- 9. Latin America Enterprise Application Integration Software Industry Analysis, Insights and Forecast, 2019-2031
- 9.1. Market Analysis, Insights and Forecast - by Deployment Type
- 9.1.1. On-premise
- 9.1.2. Cloud
- 9.1.3. Hybrid
- 9.2. Market Analysis, Insights and Forecast - by Organisation Size
- 9.2.1. Large Enterprises
- 9.2.2. Small and Medium-sized Enterprises
- 9.3. Market Analysis, Insights and Forecast - by End-user Industry
- 9.3.1. BFSI
- 9.3.2. IT and Telecom
- 9.3.3. Healthcare
- 9.3.4. Retail
- 9.3.5. Government
- 9.3.6. Manufacturing
- 9.3.7. Other End-user Industries
- 9.1. Market Analysis, Insights and Forecast - by Deployment Type
- 10. Middle East and Africa Enterprise Application Integration Software Industry Analysis, Insights and Forecast, 2019-2031
- 10.1. Market Analysis, Insights and Forecast - by Deployment Type
- 10.1.1. On-premise
- 10.1.2. Cloud
- 10.1.3. Hybrid
- 10.2. Market Analysis, Insights and Forecast - by Organisation Size
- 10.2.1. Large Enterprises
- 10.2.2. Small and Medium-sized Enterprises
- 10.3. Market Analysis, Insights and Forecast - by End-user Industry
- 10.3.1. BFSI
- 10.3.2. IT and Telecom
- 10.3.3. Healthcare
- 10.3.4. Retail
- 10.3.5. Government
- 10.3.6. Manufacturing
- 10.3.7. Other End-user Industries
- 10.1. Market Analysis, Insights and Forecast - by Deployment Type
- 11. North America Enterprise Application Integration Software Industry Analysis, Insights and Forecast, 2019-2031
- 11.1. Market Analysis, Insights and Forecast - By Country/Sub-region
- 11.1.1 United States
- 11.1.2 Canada
- 11.1.3 Mexico
- 12. Europe Enterprise Application Integration Software Industry Analysis, Insights and Forecast, 2019-2031
- 12.1. Market Analysis, Insights and Forecast - By Country/Sub-region
- 12.1.1 Germany
- 12.1.2 United Kingdom
- 12.1.3 France
- 12.1.4 Spain
- 12.1.5 Italy
- 12.1.6 Spain
- 12.1.7 Belgium
- 12.1.8 Netherland
- 12.1.9 Nordics
- 12.1.10 Rest of Europe
- 13. Asia Pacific Enterprise Application Integration Software Industry Analysis, Insights and Forecast, 2019-2031
- 13.1. Market Analysis, Insights and Forecast - By Country/Sub-region
- 13.1.1 China
- 13.1.2 Japan
- 13.1.3 India
- 13.1.4 South Korea
- 13.1.5 Southeast Asia
- 13.1.6 Australia
- 13.1.7 Indonesia
- 13.1.8 Phillipes
- 13.1.9 Singapore
- 13.1.10 Thailandc
- 13.1.11 Rest of Asia Pacific
- 14. South America Enterprise Application Integration Software Industry Analysis, Insights and Forecast, 2019-2031
- 14.1. Market Analysis, Insights and Forecast - By Country/Sub-region
- 14.1.1 Brazil
- 14.1.2 Argentina
- 14.1.3 Peru
- 14.1.4 Chile
- 14.1.5 Colombia
- 14.1.6 Ecuador
- 14.1.7 Venezuela
- 14.1.8 Rest of South America
- 15. North America Enterprise Application Integration Software Industry Analysis, Insights and Forecast, 2019-2031
- 15.1. Market Analysis, Insights and Forecast - By Country/Sub-region
- 15.1.1 United States
- 15.1.2 Canada
- 15.1.3 Mexico
- 16. MEA Enterprise Application Integration Software Industry Analysis, Insights and Forecast, 2019-2031
- 16.1. Market Analysis, Insights and Forecast - By Country/Sub-region
- 16.1.1 United Arab Emirates
- 16.1.2 Saudi Arabia
- 16.1.3 South Africa
- 16.1.4 Rest of Middle East and Africa
- 17. Competitive Analysis
- 17.1. Global Market Share Analysis 2024
- 17.2. Company Profiles
- 17.2.1 Tibco Software Inc
- 17.2.1.1. Overview
- 17.2.1.2. Products
- 17.2.1.3. SWOT Analysis
- 17.2.1.4. Recent Developments
- 17.2.1.5. Financials (Based on Availability)
- 17.2.2 IBM Corporation
- 17.2.2.1. Overview
- 17.2.2.2. Products
- 17.2.2.3. SWOT Analysis
- 17.2.2.4. Recent Developments
- 17.2.2.5. Financials (Based on Availability)
- 17.2.3 Software AG
- 17.2.3.1. Overview
- 17.2.3.2. Products
- 17.2.3.3. SWOT Analysis
- 17.2.3.4. Recent Developments
- 17.2.3.5. Financials (Based on Availability)
- 17.2.4 Microsoft Corporation
- 17.2.4.1. Overview
- 17.2.4.2. Products
- 17.2.4.3. SWOT Analysis
- 17.2.4.4. Recent Developments
- 17.2.4.5. Financials (Based on Availability)
- 17.2.5 Fujitsu Limited
- 17.2.5.1. Overview
- 17.2.5.2. Products
- 17.2.5.3. SWOT Analysis
- 17.2.5.4. Recent Developments
- 17.2.5.5. Financials (Based on Availability)
- 17.2.6 MuleSoft LLC (Salesforce Inc )
- 17.2.6.1. Overview
- 17.2.6.2. Products
- 17.2.6.3. SWOT Analysis
- 17.2.6.4. Recent Developments
- 17.2.6.5. Financials (Based on Availability)
- 17.2.7 Oracle Corporation
- 17.2.7.1. Overview
- 17.2.7.2. Products
- 17.2.7.3. SWOT Analysis
- 17.2.7.4. Recent Developments
- 17.2.7.5. Financials (Based on Availability)
- 17.2.8 iTransition Group*List Not Exhaustive
- 17.2.8.1. Overview
- 17.2.8.2. Products
- 17.2.8.3. SWOT Analysis
- 17.2.8.4. Recent Developments
- 17.2.8.5. Financials (Based on Availability)
- 17.2.9 SAP SE
- 17.2.9.1. Overview
- 17.2.9.2. Products
- 17.2.9.3. SWOT Analysis
- 17.2.9.4. Recent Developments
- 17.2.9.5. Financials (Based on Availability)
- 17.2.1 Tibco Software Inc
List of Figures
- Figure 1: Global Enterprise Application Integration Software Industry Revenue Breakdown (Million, %) by Region 2024 & 2032
- Figure 2: North America Enterprise Application Integration Software Industry Revenue (Million), by Country 2024 & 2032
- Figure 3: North America Enterprise Application Integration Software Industry Revenue Share (%), by Country 2024 & 2032
- Figure 4: Europe Enterprise Application Integration Software Industry Revenue (Million), by Country 2024 & 2032
- Figure 5: Europe Enterprise Application Integration Software Industry Revenue Share (%), by Country 2024 & 2032
- Figure 6: Asia Pacific Enterprise Application Integration Software Industry Revenue (Million), by Country 2024 & 2032
- Figure 7: Asia Pacific Enterprise Application Integration Software Industry Revenue Share (%), by Country 2024 & 2032
- Figure 8: South America Enterprise Application Integration Software Industry Revenue (Million), by Country 2024 & 2032
- Figure 9: South America Enterprise Application Integration Software Industry Revenue Share (%), by Country 2024 & 2032
- Figure 10: North America Enterprise Application Integration Software Industry Revenue (Million), by Country 2024 & 2032
- Figure 11: North America Enterprise Application Integration Software Industry Revenue Share (%), by Country 2024 & 2032
- Figure 12: MEA Enterprise Application Integration Software Industry Revenue (Million), by Country 2024 & 2032
- Figure 13: MEA Enterprise Application Integration Software Industry Revenue Share (%), by Country 2024 & 2032
- Figure 14: North America Enterprise Application Integration Software Industry Revenue (Million), by Deployment Type 2024 & 2032
- Figure 15: North America Enterprise Application Integration Software Industry Revenue Share (%), by Deployment Type 2024 & 2032
- Figure 16: North America Enterprise Application Integration Software Industry Revenue (Million), by Organisation Size 2024 & 2032
- Figure 17: North America Enterprise Application Integration Software Industry Revenue Share (%), by Organisation Size 2024 & 2032
- Figure 18: North America Enterprise Application Integration Software Industry Revenue (Million), by End-user Industry 2024 & 2032
- Figure 19: North America Enterprise Application Integration Software Industry Revenue Share (%), by End-user Industry 2024 & 2032
- Figure 20: North America Enterprise Application Integration Software Industry Revenue (Million), by Country 2024 & 2032
- Figure 21: North America Enterprise Application Integration Software Industry Revenue Share (%), by Country 2024 & 2032
- Figure 22: Europe Enterprise Application Integration Software Industry Revenue (Million), by Deployment Type 2024 & 2032
- Figure 23: Europe Enterprise Application Integration Software Industry Revenue Share (%), by Deployment Type 2024 & 2032
- Figure 24: Europe Enterprise Application Integration Software Industry Revenue (Million), by Organisation Size 2024 & 2032
- Figure 25: Europe Enterprise Application Integration Software Industry Revenue Share (%), by Organisation Size 2024 & 2032
- Figure 26: Europe Enterprise Application Integration Software Industry Revenue (Million), by End-user Industry 2024 & 2032
- Figure 27: Europe Enterprise Application Integration Software Industry Revenue Share (%), by End-user Industry 2024 & 2032
- Figure 28: Europe Enterprise Application Integration Software Industry Revenue (Million), by Country 2024 & 2032
- Figure 29: Europe Enterprise Application Integration Software Industry Revenue Share (%), by Country 2024 & 2032
- Figure 30: Asia Pacific Enterprise Application Integration Software Industry Revenue (Million), by Deployment Type 2024 & 2032
- Figure 31: Asia Pacific Enterprise Application Integration Software Industry Revenue Share (%), by Deployment Type 2024 & 2032
- Figure 32: Asia Pacific Enterprise Application Integration Software Industry Revenue (Million), by Organisation Size 2024 & 2032
- Figure 33: Asia Pacific Enterprise Application Integration Software Industry Revenue Share (%), by Organisation Size 2024 & 2032
- Figure 34: Asia Pacific Enterprise Application Integration Software Industry Revenue (Million), by End-user Industry 2024 & 2032
- Figure 35: Asia Pacific Enterprise Application Integration Software Industry Revenue Share (%), by End-user Industry 2024 & 2032
- Figure 36: Asia Pacific Enterprise Application Integration Software Industry Revenue (Million), by Country 2024 & 2032
- Figure 37: Asia Pacific Enterprise Application Integration Software Industry Revenue Share (%), by Country 2024 & 2032
- Figure 38: Latin America Enterprise Application Integration Software Industry Revenue (Million), by Deployment Type 2024 & 2032
- Figure 39: Latin America Enterprise Application Integration Software Industry Revenue Share (%), by Deployment Type 2024 & 2032
- Figure 40: Latin America Enterprise Application Integration Software Industry Revenue (Million), by Organisation Size 2024 & 2032
- Figure 41: Latin America Enterprise Application Integration Software Industry Revenue Share (%), by Organisation Size 2024 & 2032
- Figure 42: Latin America Enterprise Application Integration Software Industry Revenue (Million), by End-user Industry 2024 & 2032
- Figure 43: Latin America Enterprise Application Integration Software Industry Revenue Share (%), by End-user Industry 2024 & 2032
- Figure 44: Latin America Enterprise Application Integration Software Industry Revenue (Million), by Country 2024 & 2032
- Figure 45: Latin America Enterprise Application Integration Software Industry Revenue Share (%), by Country 2024 & 2032
- Figure 46: Middle East and Africa Enterprise Application Integration Software Industry Revenue (Million), by Deployment Type 2024 & 2032
- Figure 47: Middle East and Africa Enterprise Application Integration Software Industry Revenue Share (%), by Deployment Type 2024 & 2032
- Figure 48: Middle East and Africa Enterprise Application Integration Software Industry Revenue (Million), by Organisation Size 2024 & 2032
- Figure 49: Middle East and Africa Enterprise Application Integration Software Industry Revenue Share (%), by Organisation Size 2024 & 2032
- Figure 50: Middle East and Africa Enterprise Application Integration Software Industry Revenue (Million), by End-user Industry 2024 & 2032
- Figure 51: Middle East and Africa Enterprise Application Integration Software Industry Revenue Share (%), by End-user Industry 2024 & 2032
- Figure 52: Middle East and Africa Enterprise Application Integration Software Industry Revenue (Million), by Country 2024 & 2032
- Figure 53: Middle East and Africa Enterprise Application Integration Software Industry Revenue Share (%), by Country 2024 & 2032
List of Tables
- Table 1: Global Enterprise Application Integration Software Industry Revenue Million Forecast, by Region 2019 & 2032
- Table 2: Global Enterprise Application Integration Software Industry Revenue Million Forecast, by Deployment Type 2019 & 2032
- Table 3: Global Enterprise Application Integration Software Industry Revenue Million Forecast, by Organisation Size 2019 & 2032
- Table 4: Global Enterprise Application Integration Software Industry Revenue Million Forecast, by End-user Industry 2019 & 2032
- Table 5: Global Enterprise Application Integration Software Industry Revenue Million Forecast, by Region 2019 & 2032
- Table 6: Global Enterprise Application Integration Software Industry Revenue Million Forecast, by Country 2019 & 2032
- Table 7: United States Enterprise Application Integration Software Industry Revenue (Million) Forecast, by Application 2019 & 2032
- Table 8: Canada Enterprise Application Integration Software Industry Revenue (Million) Forecast, by Application 2019 & 2032
- Table 9: Mexico Enterprise Application Integration Software Industry Revenue (Million) Forecast, by Application 2019 & 2032
- Table 10: Global Enterprise Application Integration Software Industry Revenue Million Forecast, by Country 2019 & 2032
- Table 11: Germany Enterprise Application Integration Software Industry Revenue (Million) Forecast, by Application 2019 & 2032
- Table 12: United Kingdom Enterprise Application Integration Software Industry Revenue (Million) Forecast, by Application 2019 & 2032
- Table 13: France Enterprise Application Integration Software Industry Revenue (Million) Forecast, by Application 2019 & 2032
- Table 14: Spain Enterprise Application Integration Software Industry Revenue (Million) Forecast, by Application 2019 & 2032
- Table 15: Italy Enterprise Application Integration Software Industry Revenue (Million) Forecast, by Application 2019 & 2032
- Table 16: Spain Enterprise Application Integration Software Industry Revenue (Million) Forecast, by Application 2019 & 2032
- Table 17: Belgium Enterprise Application Integration Software Industry Revenue (Million) Forecast, by Application 2019 & 2032
- Table 18: Netherland Enterprise Application Integration Software Industry Revenue (Million) Forecast, by Application 2019 & 2032
- Table 19: Nordics Enterprise Application Integration Software Industry Revenue (Million) Forecast, by Application 2019 & 2032
- Table 20: Rest of Europe Enterprise Application Integration Software Industry Revenue (Million) Forecast, by Application 2019 & 2032
- Table 21: Global Enterprise Application Integration Software Industry Revenue Million Forecast, by Country 2019 & 2032
- Table 22: China Enterprise Application Integration Software Industry Revenue (Million) Forecast, by Application 2019 & 2032
- Table 23: Japan Enterprise Application Integration Software Industry Revenue (Million) Forecast, by Application 2019 & 2032
- Table 24: India Enterprise Application Integration Software Industry Revenue (Million) Forecast, by Application 2019 & 2032
- Table 25: South Korea Enterprise Application Integration Software Industry Revenue (Million) Forecast, by Application 2019 & 2032
- Table 26: Southeast Asia Enterprise Application Integration Software Industry Revenue (Million) Forecast, by Application 2019 & 2032
- Table 27: Australia Enterprise Application Integration Software Industry Revenue (Million) Forecast, by Application 2019 & 2032
- Table 28: Indonesia Enterprise Application Integration Software Industry Revenue (Million) Forecast, by Application 2019 & 2032
- Table 29: Phillipes Enterprise Application Integration Software Industry Revenue (Million) Forecast, by Application 2019 & 2032
- Table 30: Singapore Enterprise Application Integration Software Industry Revenue (Million) Forecast, by Application 2019 & 2032
- Table 31: Thailandc Enterprise Application Integration Software Industry Revenue (Million) Forecast, by Application 2019 & 2032
- Table 32: Rest of Asia Pacific Enterprise Application Integration Software Industry Revenue (Million) Forecast, by Application 2019 & 2032
- Table 33: Global Enterprise Application Integration Software Industry Revenue Million Forecast, by Country 2019 & 2032
- Table 34: Brazil Enterprise Application Integration Software Industry Revenue (Million) Forecast, by Application 2019 & 2032
- Table 35: Argentina Enterprise Application Integration Software Industry Revenue (Million) Forecast, by Application 2019 & 2032
- Table 36: Peru Enterprise Application Integration Software Industry Revenue (Million) Forecast, by Application 2019 & 2032
- Table 37: Chile Enterprise Application Integration Software Industry Revenue (Million) Forecast, by Application 2019 & 2032
- Table 38: Colombia Enterprise Application Integration Software Industry Revenue (Million) Forecast, by Application 2019 & 2032
- Table 39: Ecuador Enterprise Application Integration Software Industry Revenue (Million) Forecast, by Application 2019 & 2032
- Table 40: Venezuela Enterprise Application Integration Software Industry Revenue (Million) Forecast, by Application 2019 & 2032
- Table 41: Rest of South America Enterprise Application Integration Software Industry Revenue (Million) Forecast, by Application 2019 & 2032
- Table 42: Global Enterprise Application Integration Software Industry Revenue Million Forecast, by Country 2019 & 2032
- Table 43: United States Enterprise Application Integration Software Industry Revenue (Million) Forecast, by Application 2019 & 2032
- Table 44: Canada Enterprise Application Integration Software Industry Revenue (Million) Forecast, by Application 2019 & 2032
- Table 45: Mexico Enterprise Application Integration Software Industry Revenue (Million) Forecast, by Application 2019 & 2032
- Table 46: Global Enterprise Application Integration Software Industry Revenue Million Forecast, by Country 2019 & 2032
- Table 47: United Arab Emirates Enterprise Application Integration Software Industry Revenue (Million) Forecast, by Application 2019 & 2032
- Table 48: Saudi Arabia Enterprise Application Integration Software Industry Revenue (Million) Forecast, by Application 2019 & 2032
- Table 49: South Africa Enterprise Application Integration Software Industry Revenue (Million) Forecast, by Application 2019 & 2032
- Table 50: Rest of Middle East and Africa Enterprise Application Integration Software Industry Revenue (Million) Forecast, by Application 2019 & 2032
- Table 51: Global Enterprise Application Integration Software Industry Revenue Million Forecast, by Deployment Type 2019 & 2032
- Table 52: Global Enterprise Application Integration Software Industry Revenue Million Forecast, by Organisation Size 2019 & 2032
- Table 53: Global Enterprise Application Integration Software Industry Revenue Million Forecast, by End-user Industry 2019 & 2032
- Table 54: Global Enterprise Application Integration Software Industry Revenue Million Forecast, by Country 2019 & 2032
- Table 55: Global Enterprise Application Integration Software Industry Revenue Million Forecast, by Deployment Type 2019 & 2032
- Table 56: Global Enterprise Application Integration Software Industry Revenue Million Forecast, by Organisation Size 2019 & 2032
- Table 57: Global Enterprise Application Integration Software Industry Revenue Million Forecast, by End-user Industry 2019 & 2032
- Table 58: Global Enterprise Application Integration Software Industry Revenue Million Forecast, by Country 2019 & 2032
- Table 59: Global Enterprise Application Integration Software Industry Revenue Million Forecast, by Deployment Type 2019 & 2032
- Table 60: Global Enterprise Application Integration Software Industry Revenue Million Forecast, by Organisation Size 2019 & 2032
- Table 61: Global Enterprise Application Integration Software Industry Revenue Million Forecast, by End-user Industry 2019 & 2032
- Table 62: Global Enterprise Application Integration Software Industry Revenue Million Forecast, by Country 2019 & 2032
- Table 63: Global Enterprise Application Integration Software Industry Revenue Million Forecast, by Deployment Type 2019 & 2032
- Table 64: Global Enterprise Application Integration Software Industry Revenue Million Forecast, by Organisation Size 2019 & 2032
- Table 65: Global Enterprise Application Integration Software Industry Revenue Million Forecast, by End-user Industry 2019 & 2032
- Table 66: Global Enterprise Application Integration Software Industry Revenue Million Forecast, by Country 2019 & 2032
- Table 67: Global Enterprise Application Integration Software Industry Revenue Million Forecast, by Deployment Type 2019 & 2032
- Table 68: Global Enterprise Application Integration Software Industry Revenue Million Forecast, by Organisation Size 2019 & 2032
- Table 69: Global Enterprise Application Integration Software Industry Revenue Million Forecast, by End-user Industry 2019 & 2032
- Table 70: Global Enterprise Application Integration Software Industry Revenue Million Forecast, by Country 2019 & 2032
Frequently Asked Questions
1. What is the projected Compound Annual Growth Rate (CAGR) of the Enterprise Application Integration Software Industry?
The projected CAGR is approximately 15.65%.
2. Which companies are prominent players in the Enterprise Application Integration Software Industry?
Key companies in the market include Tibco Software Inc, IBM Corporation, Software AG, Microsoft Corporation, Fujitsu Limited, MuleSoft LLC (Salesforce Inc ), Oracle Corporation, iTransition Group*List Not Exhaustive, SAP SE.
3. What are the main segments of the Enterprise Application Integration Software Industry?
The market segments include Deployment Type, Organisation Size, End-user Industry.
4. Can you provide details about the market size?
The market size is estimated to be USD 15.28 Million as of 2022.
5. What are some drivers contributing to market growth?
Increasing Digital Transformation across Industries; Increasing Demand for Real-time Data Access and Management.
6. What are the notable trends driving market growth?
Increasing Digital Transformation Across Industries to Drive the Market.
7. Are there any restraints impacting market growth?
Loss of Control over Data Location Hinders the Market.
8. Can you provide examples of recent developments in the market?
August 2022- Salsify has announced its membership in the MuleSoft Technology Partner Program and its contribution to the partner ecosystem by launching a MuleSoft Certified Connector for Salsify. Companies could use the Salsify connector, accessible in Anypoint Exchange, to simplify the secure integration from upstream ecosystems to Salsify. Due to this, business teams might reliably work with the latest, verified product data. Users may simplify troubleshooting, maintenance, and enhancements to their Salsify integration by centralizing the business logic and data flow design in MuleSoft.
9. What pricing options are available for accessing the report?
Pricing options include single-user, multi-user, and enterprise licenses priced at USD 4750, USD 5250, and USD 8750 respectively.
10. Is the market size provided in terms of value or volume?
The market size is provided in terms of value, measured in Million.
11. Are there any specific market keywords associated with the report?
Yes, the market keyword associated with the report is "Enterprise Application Integration Software Industry," which aids in identifying and referencing the specific market segment covered.
12. How do I determine which pricing option suits my needs best?
The pricing options vary based on user requirements and access needs. Individual users may opt for single-user licenses, while businesses requiring broader access may choose multi-user or enterprise licenses for cost-effective access to the report.
13. Are there any additional resources or data provided in the Enterprise Application Integration Software Industry report?
While the report offers comprehensive insights, it's advisable to review the specific contents or supplementary materials provided to ascertain if additional resources or data are available.
14. How can I stay updated on further developments or reports in the Enterprise Application Integration Software Industry?
To stay informed about further developments, trends, and reports in the Enterprise Application Integration Software Industry, consider subscribing to industry newsletters, following relevant companies and organizations, or regularly checking reputable industry news sources and publications.
Methodology
Step 1 - Identification of Relevant Samples Size from Population Database


Step 2 - Approaches for Defining Global Market Size (Value, Volume* & Price*)

Note*: In applicable scenarios
Step 3 - Data Sources
Primary Research
- Web Analytics
- Survey Reports
- Research Institute
- Latest Research Reports
- Opinion Leaders
Secondary Research
- Annual Reports
- White Paper
- Latest Press Release
- Industry Association
- Paid Database
- Investor Presentations

Step 4 - Data Triangulation
Involves using different sources of information in order to increase the validity of a study
These sources are likely to be stakeholders in a program - participants, other researchers, program staff, other community members, and so on.
Then we put all data in single framework & apply various statistical tools to find out the dynamic on the market.
During the analysis stage, feedback from the stakeholder groups would be compared to determine areas of agreement as well as areas of divergence
