

Key Insights
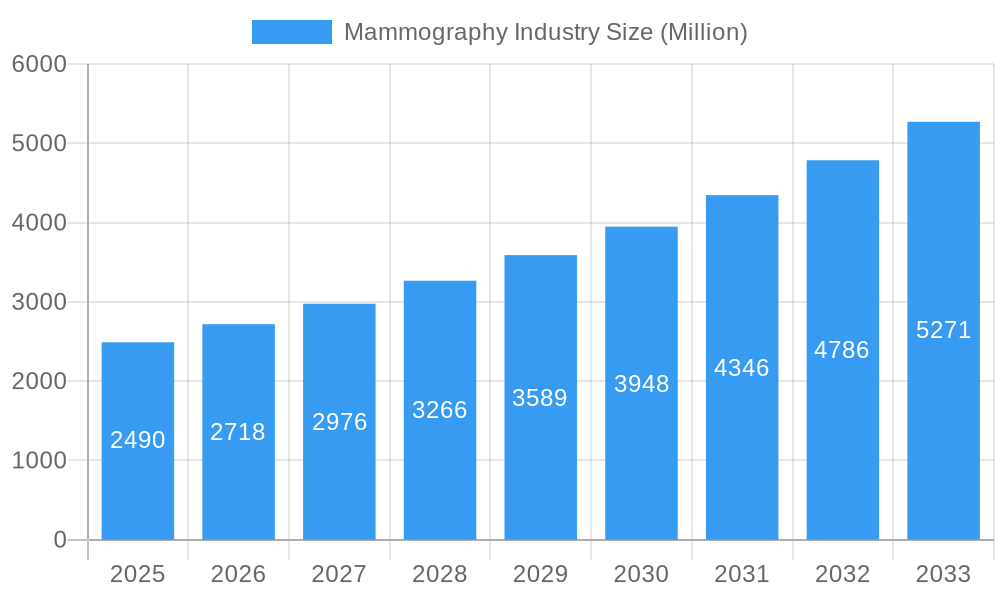
The mammography market, valued at $2.49 billion in 2025, is projected to experience robust growth, driven by a compound annual growth rate (CAGR) of 9.20% from 2025 to 2033. This expansion is fueled by several key factors. The rising prevalence of breast cancer globally necessitates increased screening and diagnostic capabilities, leading to higher demand for mammography systems. Technological advancements, such as the introduction of digital mammography and breast tomosynthesis, offer improved image quality, reduced radiation exposure, and enhanced diagnostic accuracy, further stimulating market growth. The increasing adoption of these advanced technologies in hospitals, specialty clinics, and diagnostic centers across North America, Europe, and Asia Pacific is a significant contributor to market expansion. Furthermore, government initiatives promoting breast cancer awareness and screening programs are indirectly supporting market growth. While challenges exist, such as high initial investment costs associated with advanced systems and the need for skilled technicians, the overall market outlook remains positive.
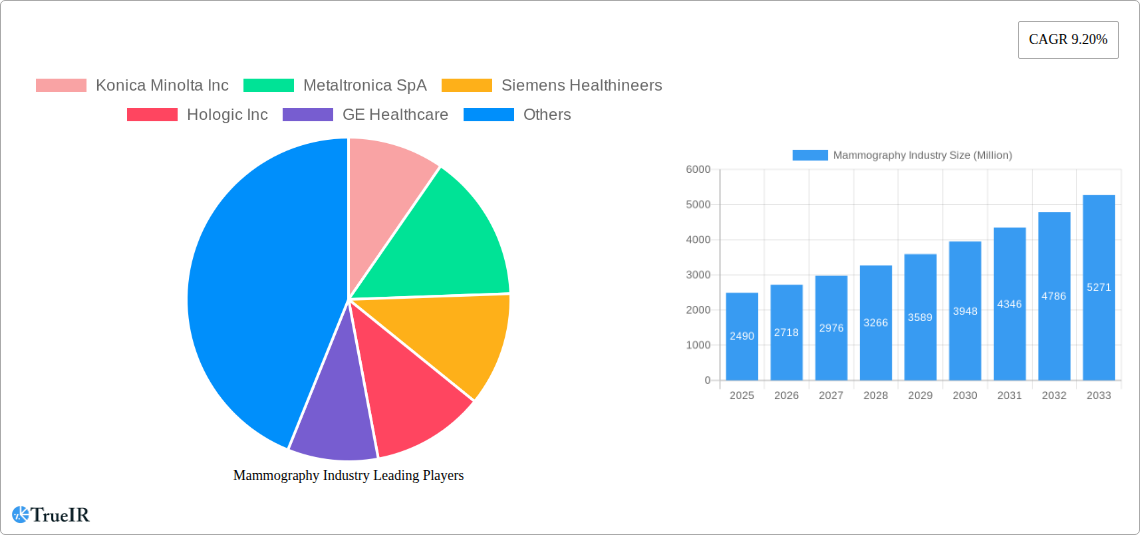
Mammography Industry Market Size (In Billion)
The market segmentation reveals a diverse landscape. Digital mammography systems currently dominate the product type segment, reflecting a global shift towards advanced imaging technologies. However, the breast tomosynthesis segment is expected to witness the fastest growth due to its superior diagnostic capabilities. In terms of end-users, hospitals represent the largest market share due to their comprehensive diagnostic capabilities and high patient volumes. Regional variations are also noteworthy, with North America and Europe currently holding significant market shares, though Asia Pacific is expected to showcase substantial growth potential in the coming years, driven by rising healthcare infrastructure investments and increasing awareness about breast health. Competitive dynamics within the market are intense, with key players like Hologic, Siemens Healthineers, and Fujifilm continually innovating and expanding their product portfolios to maintain market leadership. The overall trend points towards a continuously evolving mammography market characterized by technological advancements, regional growth variations, and fierce competition.
Mammography Industry Company Market Share
Mammography Industry Market Report: 2019-2033
This comprehensive report provides an in-depth analysis of the global mammography industry, projecting a market valuation exceeding $XX Million by 2033. The study covers the period from 2019 to 2033, with a base year of 2025 and a forecast period spanning 2025-2033. This report is crucial for industry stakeholders, investors, and researchers seeking a clear understanding of market trends, competitive dynamics, and future growth prospects within the mammography sector. High-volume keywords like "mammography market," "breast tomosynthesis," "digital mammography systems," and "mammography industry trends" are integrated throughout to optimize search engine visibility.
Mammography Industry Market Structure & Competitive Landscape
The global mammography market exhibits a moderately consolidated structure, with several key players holding significant market share. The industry’s competitive landscape is characterized by intense rivalry, driven by ongoing technological advancements, stringent regulatory approvals, and a focus on providing enhanced diagnostic accuracy and patient care. Concentration ratios (e.g., CR4 and CR8) are estimated at xx% and xx% respectively in 2025. The market is impacted by several factors including innovation, the regulatory environment, the availability of substitute products (e.g., ultrasound, MRI), and end-user preferences (Hospitals, Specialty Clinics, and Diagnostic Centers).
- Innovation Drivers: Continuous development of advanced imaging technologies such as breast tomosynthesis and AI-powered diagnostic tools drive market growth.
- Regulatory Impacts: Stringent regulatory approvals and quality standards influence market access and product adoption.
- Product Substitutes: The availability of alternative imaging modalities presents competitive pressure.
- End-User Segmentation: Hospitals dominate the market share, followed by specialty clinics and diagnostic centers, each presenting unique opportunities.
- M&A Trends: The past five years have witnessed xx number of mergers and acquisitions, valued at approximately $xx Million, primarily focused on expanding technological capabilities and geographic reach. These activities signify industry consolidation and strategic growth initiatives.
Mammography Industry Market Trends & Opportunities
The global mammography market is poised for significant expansion, projecting a robust Compound Annual Growth Rate (CAGR) of approximately **XX%** from 2025 to 2033. This upward trajectory is primarily propelled by the persistent rise in breast cancer incidence worldwide, the escalating demand for highly accurate early detection methods, and continuous technological innovations that enhance diagnostic capabilities. Furthermore, increasing global healthcare expenditures are contributing to market growth, making advanced mammography solutions more accessible.
The market is witnessing a strong shift towards advanced digital mammography systems, with penetration rates anticipated to reach **XX%** by 2033. Breast tomosynthesis, also known as 3D mammography, is emerging as a transformative technology and is expected to achieve substantial adoption due to its superior ability to detect subtle abnormalities. The integration of Artificial Intelligence (AI) into mammography workflows, alongside the broader trend of personalized medicine, is further accelerating market development. Patients increasingly prioritize diagnostic procedures that are not only faster and more accurate but also minimally invasive, thereby driving the demand for cutting-edge mammography technologies.
Competitive dynamics within the mammography landscape remain intensely active. Leading manufacturers are consistently engaged in research and development to introduce groundbreaking innovations and expand their market share through strategic alliances and new product introductions. This necessitates a commitment to continuous innovation and agile strategic planning for all stakeholders to maintain a competitive edge in this dynamic industry.
Dominant Markets & Segments in Mammography Industry
North America currently leads the mammography industry in terms of market share. This dominance is attributed to significant healthcare investments, a well-established and advanced healthcare infrastructure, and a stringent yet supportive regulatory environment that encourages the adoption of new technologies. In terms of product segments, digital mammography systems represent the largest share, closely followed by the rapidly growing segment of breast tomosynthesis.
- Digital Systems: The sustained demand for these systems is driven by their ability to provide superior image quality, significantly reduce image acquisition times, and lower patient radiation exposure compared to older technologies.
- Analog Systems: The adoption rate for analog mammography systems is declining as healthcare providers increasingly transition to more advanced digital platforms.
- Breast Tomosynthesis: This segment is experiencing rapid expansion due to its proven effectiveness in delivering exceptional image clarity and improving the detection rates of breast cancers, especially in dense breast tissue.
- Other Product Types: This inclusive category encompasses essential accessories and sophisticated software solutions that are crucial for optimizing mammography workflow efficiency and enhancing diagnostic precision.
- Hospitals: This sector commands the largest market share, largely due to the high volume of screening procedures performed and the availability of comprehensive imaging infrastructure within hospital settings.
- Specialty Clinics: These clinics present significant growth opportunities as there is a growing emphasis on dedicated breast care services and specialized diagnostic pathways.
- Diagnostic Centers: This segment is projected to exhibit steady growth, aligning with the broader expansion of medical imaging services across various healthcare settings.
Key overarching growth drivers for these segments include increased government support for breast cancer screening initiatives, the widespread adoption of advanced imaging technologies, and the continuous improvement of healthcare infrastructure, particularly in emerging economies.
Mammography Industry Product Analysis
The mammography market is characterized by continuous product innovation, including advancements in digital detectors, tomosynthesis technology, and AI-powered diagnostic tools. These innovations provide improved image quality, reduced radiation exposure, and enhanced diagnostic capabilities. Companies are actively developing solutions that integrate multiple technologies to improve diagnostic workflows and reduce operational costs. The competitive advantage in this space relies on technological superiority, efficient workflow solutions, and strong customer support.
Key Drivers, Barriers & Challenges in Mammography Industry
Key Drivers:
- Technological advancements like AI and tomosynthesis improve accuracy and efficiency.
- Rising breast cancer prevalence necessitates increased screening and early detection.
- Government initiatives and funding boost investment in mammography infrastructure.
Challenges:
- High initial investment costs in advanced equipment deter some healthcare facilities.
- Stringent regulatory approvals and quality standards increase time to market for new products.
- Intense competition among established players puts pressure on margins and innovation. Supply chain disruptions can cause delays and cost increases, impacting profitability.
Growth Drivers in the Mammography Industry Market
Technological advancements, such as AI-powered diagnostic tools and enhanced tomosynthesis systems, are key growth drivers. The rising prevalence of breast cancer globally, coupled with increased awareness and government initiatives supporting screening programs, significantly boost demand. Furthermore, improvements in healthcare infrastructure and increasing healthcare spending in several regions are major contributing factors.
Challenges Impacting Mammography Industry Growth
The high initial capital investment required for the procurement of advanced mammography technologies presents a significant barrier to adoption, especially for healthcare facilities in developing regions with limited financial resources. Navigating complex and lengthy regulatory approval processes for new diagnostic equipment and potential disruptions in global supply chains can also impede market growth. Furthermore, the intense competition among established players in the mammography market often leads to considerable pricing pressures, which can impact the overall profitability and growth trajectory of the industry.
Key Players Shaping the Mammography Industry Market
- Konica Minolta Inc
- Metaltronica SpA
- Siemens Healthineers
- Hologic Inc
- GE Healthcare
- Carestream Health
- Koninklijke Philips NV
- General Medical Merate SpA
- Planmed Oy
- Fujifilm Holdings Corporation
- Canon Medical Systems
Significant Mammography Industry Milestones
- May 2022: Volpara Health launched updated products for its AI-driven breast care platform at the SBI/ACR Breast Imaging Symposium 2022, improving mammography quality, reporting, and cancer risk assessment.
- January 2022: ScreenPoint Medical expanded globally, launching Transpara, an AI Breast Care system, enhancing access to AI-driven diagnostic solutions.
Future Outlook for Mammography Industry Market
The mammography market is poised for continued growth, driven by technological advancements, increasing cancer awareness, and expanding healthcare infrastructure. Strategic opportunities lie in developing and deploying AI-powered solutions, expanding into emerging markets, and focusing on personalized breast care. The market exhibits substantial potential for growth and innovation, promising improved diagnostic accuracy and patient outcomes in the years to come.
Mammography Industry Segmentation
-
1. Product Type
- 1.1. Digital Systems
- 1.2. Analog Systems
- 1.3. Breast Tomosynthesis
- 1.4. Other Product Types
-
2. End Users
- 2.1. Hospitals
- 2.2. Specialty Clinics
- 2.3. Diagnostic Centers
Mammography Industry Segmentation By Geography
-
1. North America
- 1.1. United States
- 1.2. Canada
- 1.3. Mexico
-
2. Europe
- 2.1. Germany
- 2.2. United Kingdom
- 2.3. France
- 2.4. Italy
- 2.5. Spain
- 2.6. Rest of Europe
-
3. Asia Pacific
- 3.1. China
- 3.2. Japan
- 3.3. India
- 3.4. Australia
- 3.5. South Korea
- 3.6. Rest of Asia Pacific
-
4. Middle East and Africa
- 4.1. GCC
- 4.2. South Africa
- 4.3. Rest of Middle East and Africa
-
5. South America
- 5.1. Brazil
- 5.2. Argentina
- 5.3. Rest of South America
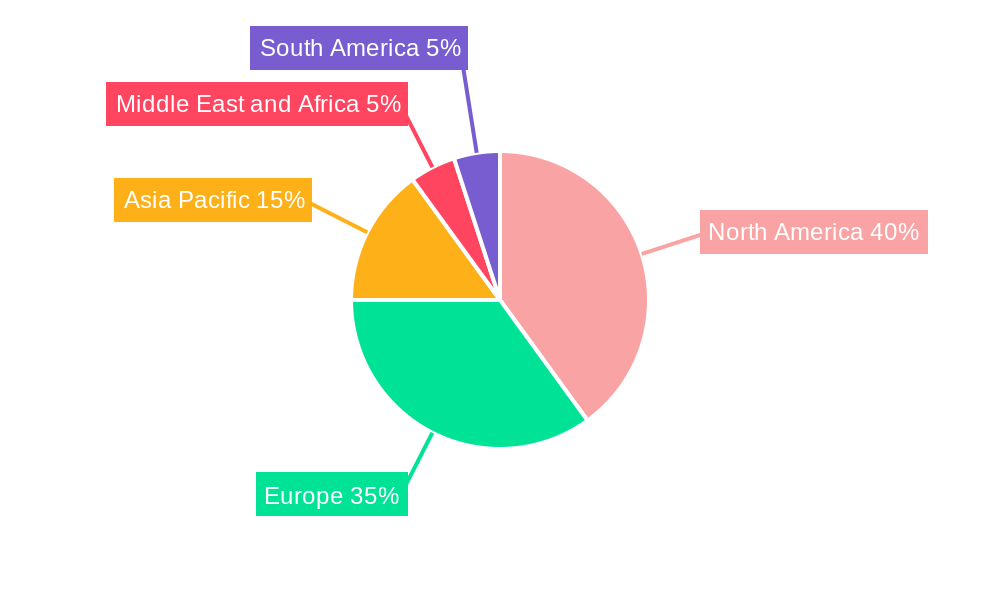
Mammography Industry Regional Market Share
Geographic Coverage of Mammography Industry
Mammography Industry REPORT HIGHLIGHTS
| Aspects | Details |
|---|---|
| Study Period | 2020-2034 |
| Base Year | 2025 |
| Estimated Year | 2026 |
| Forecast Period | 2026-2034 |
| Historical Period | 2020-2025 |
| Growth Rate | CAGR of 9.20% from 2020-2034 |
| Segmentation |
|
Table of Contents
- 1. Introduction
- 1.1. Research Scope
- 1.2. Market Segmentation
- 1.3. Research Methodology
- 1.4. Definitions and Assumptions
- 2. Executive Summary
- 2.1. Introduction
- 3. Market Dynamics
- 3.1. Introduction
- 3.2. Market Drivers
- 3.2.1. Growing Burden of Breast Cancer; Technological Advancements in the Field of Breast Imaging; Investment from Various Organizations in Breast Cancer Screening Campaigns
- 3.3. Market Restrains
- 3.3.1. Risk of Adverse Effects from Radiation Exposure; Reduction in Reimbursement
- 3.4. Market Trends
- 3.4.1. The Digital Mammography Segment is Expected to Account for the Large Market Share During the Forecast Period
- 4. Market Factor Analysis
- 4.1. Porters Five Forces
- 4.2. Supply/Value Chain
- 4.3. PESTEL analysis
- 4.4. Market Entropy
- 4.5. Patent/Trademark Analysis
- 5. Global Mammography Industry Analysis, Insights and Forecast, 2020-2032
- 5.1. Market Analysis, Insights and Forecast - by Product Type
- 5.1.1. Digital Systems
- 5.1.2. Analog Systems
- 5.1.3. Breast Tomosynthesis
- 5.1.4. Other Product Types
- 5.2. Market Analysis, Insights and Forecast - by End Users
- 5.2.1. Hospitals
- 5.2.2. Specialty Clinics
- 5.2.3. Diagnostic Centers
- 5.3. Market Analysis, Insights and Forecast - by Region
- 5.3.1. North America
- 5.3.2. Europe
- 5.3.3. Asia Pacific
- 5.3.4. Middle East and Africa
- 5.3.5. South America
- 5.1. Market Analysis, Insights and Forecast - by Product Type
- 6. North America Mammography Industry Analysis, Insights and Forecast, 2020-2032
- 6.1. Market Analysis, Insights and Forecast - by Product Type
- 6.1.1. Digital Systems
- 6.1.2. Analog Systems
- 6.1.3. Breast Tomosynthesis
- 6.1.4. Other Product Types
- 6.2. Market Analysis, Insights and Forecast - by End Users
- 6.2.1. Hospitals
- 6.2.2. Specialty Clinics
- 6.2.3. Diagnostic Centers
- 6.1. Market Analysis, Insights and Forecast - by Product Type
- 7. Europe Mammography Industry Analysis, Insights and Forecast, 2020-2032
- 7.1. Market Analysis, Insights and Forecast - by Product Type
- 7.1.1. Digital Systems
- 7.1.2. Analog Systems
- 7.1.3. Breast Tomosynthesis
- 7.1.4. Other Product Types
- 7.2. Market Analysis, Insights and Forecast - by End Users
- 7.2.1. Hospitals
- 7.2.2. Specialty Clinics
- 7.2.3. Diagnostic Centers
- 7.1. Market Analysis, Insights and Forecast - by Product Type
- 8. Asia Pacific Mammography Industry Analysis, Insights and Forecast, 2020-2032
- 8.1. Market Analysis, Insights and Forecast - by Product Type
- 8.1.1. Digital Systems
- 8.1.2. Analog Systems
- 8.1.3. Breast Tomosynthesis
- 8.1.4. Other Product Types
- 8.2. Market Analysis, Insights and Forecast - by End Users
- 8.2.1. Hospitals
- 8.2.2. Specialty Clinics
- 8.2.3. Diagnostic Centers
- 8.1. Market Analysis, Insights and Forecast - by Product Type
- 9. Middle East and Africa Mammography Industry Analysis, Insights and Forecast, 2020-2032
- 9.1. Market Analysis, Insights and Forecast - by Product Type
- 9.1.1. Digital Systems
- 9.1.2. Analog Systems
- 9.1.3. Breast Tomosynthesis
- 9.1.4. Other Product Types
- 9.2. Market Analysis, Insights and Forecast - by End Users
- 9.2.1. Hospitals
- 9.2.2. Specialty Clinics
- 9.2.3. Diagnostic Centers
- 9.1. Market Analysis, Insights and Forecast - by Product Type
- 10. South America Mammography Industry Analysis, Insights and Forecast, 2020-2032
- 10.1. Market Analysis, Insights and Forecast - by Product Type
- 10.1.1. Digital Systems
- 10.1.2. Analog Systems
- 10.1.3. Breast Tomosynthesis
- 10.1.4. Other Product Types
- 10.2. Market Analysis, Insights and Forecast - by End Users
- 10.2.1. Hospitals
- 10.2.2. Specialty Clinics
- 10.2.3. Diagnostic Centers
- 10.1. Market Analysis, Insights and Forecast - by Product Type
- 11. Competitive Analysis
- 11.1. Global Market Share Analysis 2025
- 11.2. Company Profiles
- 11.2.1 Konica Minolta Inc
- 11.2.1.1. Overview
- 11.2.1.2. Products
- 11.2.1.3. SWOT Analysis
- 11.2.1.4. Recent Developments
- 11.2.1.5. Financials (Based on Availability)
- 11.2.2 Metaltronica SpA
- 11.2.2.1. Overview
- 11.2.2.2. Products
- 11.2.2.3. SWOT Analysis
- 11.2.2.4. Recent Developments
- 11.2.2.5. Financials (Based on Availability)
- 11.2.3 Siemens Healthineers
- 11.2.3.1. Overview
- 11.2.3.2. Products
- 11.2.3.3. SWOT Analysis
- 11.2.3.4. Recent Developments
- 11.2.3.5. Financials (Based on Availability)
- 11.2.4 Hologic Inc
- 11.2.4.1. Overview
- 11.2.4.2. Products
- 11.2.4.3. SWOT Analysis
- 11.2.4.4. Recent Developments
- 11.2.4.5. Financials (Based on Availability)
- 11.2.5 GE Healthcare
- 11.2.5.1. Overview
- 11.2.5.2. Products
- 11.2.5.3. SWOT Analysis
- 11.2.5.4. Recent Developments
- 11.2.5.5. Financials (Based on Availability)
- 11.2.6 Carestream Health
- 11.2.6.1. Overview
- 11.2.6.2. Products
- 11.2.6.3. SWOT Analysis
- 11.2.6.4. Recent Developments
- 11.2.6.5. Financials (Based on Availability)
- 11.2.7 Koninklijke Philips NV
- 11.2.7.1. Overview
- 11.2.7.2. Products
- 11.2.7.3. SWOT Analysis
- 11.2.7.4. Recent Developments
- 11.2.7.5. Financials (Based on Availability)
- 11.2.8 General Medical Merate SpA
- 11.2.8.1. Overview
- 11.2.8.2. Products
- 11.2.8.3. SWOT Analysis
- 11.2.8.4. Recent Developments
- 11.2.8.5. Financials (Based on Availability)
- 11.2.9 Planmed Oy
- 11.2.9.1. Overview
- 11.2.9.2. Products
- 11.2.9.3. SWOT Analysis
- 11.2.9.4. Recent Developments
- 11.2.9.5. Financials (Based on Availability)
- 11.2.10 Fujifilm Holdings Corporation
- 11.2.10.1. Overview
- 11.2.10.2. Products
- 11.2.10.3. SWOT Analysis
- 11.2.10.4. Recent Developments
- 11.2.10.5. Financials (Based on Availability)
- 11.2.11 Canon Medical Systems
- 11.2.11.1. Overview
- 11.2.11.2. Products
- 11.2.11.3. SWOT Analysis
- 11.2.11.4. Recent Developments
- 11.2.11.5. Financials (Based on Availability)
- 11.2.1 Konica Minolta Inc
List of Figures
- Figure 1: Global Mammography Industry Revenue Breakdown (Million, %) by Region 2025 & 2033
- Figure 2: North America Mammography Industry Revenue (Million), by Product Type 2025 & 2033
- Figure 3: North America Mammography Industry Revenue Share (%), by Product Type 2025 & 2033
- Figure 4: North America Mammography Industry Revenue (Million), by End Users 2025 & 2033
- Figure 5: North America Mammography Industry Revenue Share (%), by End Users 2025 & 2033
- Figure 6: North America Mammography Industry Revenue (Million), by Country 2025 & 2033
- Figure 7: North America Mammography Industry Revenue Share (%), by Country 2025 & 2033
- Figure 8: Europe Mammography Industry Revenue (Million), by Product Type 2025 & 2033
- Figure 9: Europe Mammography Industry Revenue Share (%), by Product Type 2025 & 2033
- Figure 10: Europe Mammography Industry Revenue (Million), by End Users 2025 & 2033
- Figure 11: Europe Mammography Industry Revenue Share (%), by End Users 2025 & 2033
- Figure 12: Europe Mammography Industry Revenue (Million), by Country 2025 & 2033
- Figure 13: Europe Mammography Industry Revenue Share (%), by Country 2025 & 2033
- Figure 14: Asia Pacific Mammography Industry Revenue (Million), by Product Type 2025 & 2033
- Figure 15: Asia Pacific Mammography Industry Revenue Share (%), by Product Type 2025 & 2033
- Figure 16: Asia Pacific Mammography Industry Revenue (Million), by End Users 2025 & 2033
- Figure 17: Asia Pacific Mammography Industry Revenue Share (%), by End Users 2025 & 2033
- Figure 18: Asia Pacific Mammography Industry Revenue (Million), by Country 2025 & 2033
- Figure 19: Asia Pacific Mammography Industry Revenue Share (%), by Country 2025 & 2033
- Figure 20: Middle East and Africa Mammography Industry Revenue (Million), by Product Type 2025 & 2033
- Figure 21: Middle East and Africa Mammography Industry Revenue Share (%), by Product Type 2025 & 2033
- Figure 22: Middle East and Africa Mammography Industry Revenue (Million), by End Users 2025 & 2033
- Figure 23: Middle East and Africa Mammography Industry Revenue Share (%), by End Users 2025 & 2033
- Figure 24: Middle East and Africa Mammography Industry Revenue (Million), by Country 2025 & 2033
- Figure 25: Middle East and Africa Mammography Industry Revenue Share (%), by Country 2025 & 2033
- Figure 26: South America Mammography Industry Revenue (Million), by Product Type 2025 & 2033
- Figure 27: South America Mammography Industry Revenue Share (%), by Product Type 2025 & 2033
- Figure 28: South America Mammography Industry Revenue (Million), by End Users 2025 & 2033
- Figure 29: South America Mammography Industry Revenue Share (%), by End Users 2025 & 2033
- Figure 30: South America Mammography Industry Revenue (Million), by Country 2025 & 2033
- Figure 31: South America Mammography Industry Revenue Share (%), by Country 2025 & 2033
List of Tables
- Table 1: Global Mammography Industry Revenue Million Forecast, by Product Type 2020 & 2033
- Table 2: Global Mammography Industry Revenue Million Forecast, by End Users 2020 & 2033
- Table 3: Global Mammography Industry Revenue Million Forecast, by Region 2020 & 2033
- Table 4: Global Mammography Industry Revenue Million Forecast, by Product Type 2020 & 2033
- Table 5: Global Mammography Industry Revenue Million Forecast, by End Users 2020 & 2033
- Table 6: Global Mammography Industry Revenue Million Forecast, by Country 2020 & 2033
- Table 7: United States Mammography Industry Revenue (Million) Forecast, by Application 2020 & 2033
- Table 8: Canada Mammography Industry Revenue (Million) Forecast, by Application 2020 & 2033
- Table 9: Mexico Mammography Industry Revenue (Million) Forecast, by Application 2020 & 2033
- Table 10: Global Mammography Industry Revenue Million Forecast, by Product Type 2020 & 2033
- Table 11: Global Mammography Industry Revenue Million Forecast, by End Users 2020 & 2033
- Table 12: Global Mammography Industry Revenue Million Forecast, by Country 2020 & 2033
- Table 13: Germany Mammography Industry Revenue (Million) Forecast, by Application 2020 & 2033
- Table 14: United Kingdom Mammography Industry Revenue (Million) Forecast, by Application 2020 & 2033
- Table 15: France Mammography Industry Revenue (Million) Forecast, by Application 2020 & 2033
- Table 16: Italy Mammography Industry Revenue (Million) Forecast, by Application 2020 & 2033
- Table 17: Spain Mammography Industry Revenue (Million) Forecast, by Application 2020 & 2033
- Table 18: Rest of Europe Mammography Industry Revenue (Million) Forecast, by Application 2020 & 2033
- Table 19: Global Mammography Industry Revenue Million Forecast, by Product Type 2020 & 2033
- Table 20: Global Mammography Industry Revenue Million Forecast, by End Users 2020 & 2033
- Table 21: Global Mammography Industry Revenue Million Forecast, by Country 2020 & 2033
- Table 22: China Mammography Industry Revenue (Million) Forecast, by Application 2020 & 2033
- Table 23: Japan Mammography Industry Revenue (Million) Forecast, by Application 2020 & 2033
- Table 24: India Mammography Industry Revenue (Million) Forecast, by Application 2020 & 2033
- Table 25: Australia Mammography Industry Revenue (Million) Forecast, by Application 2020 & 2033
- Table 26: South Korea Mammography Industry Revenue (Million) Forecast, by Application 2020 & 2033
- Table 27: Rest of Asia Pacific Mammography Industry Revenue (Million) Forecast, by Application 2020 & 2033
- Table 28: Global Mammography Industry Revenue Million Forecast, by Product Type 2020 & 2033
- Table 29: Global Mammography Industry Revenue Million Forecast, by End Users 2020 & 2033
- Table 30: Global Mammography Industry Revenue Million Forecast, by Country 2020 & 2033
- Table 31: GCC Mammography Industry Revenue (Million) Forecast, by Application 2020 & 2033
- Table 32: South Africa Mammography Industry Revenue (Million) Forecast, by Application 2020 & 2033
- Table 33: Rest of Middle East and Africa Mammography Industry Revenue (Million) Forecast, by Application 2020 & 2033
- Table 34: Global Mammography Industry Revenue Million Forecast, by Product Type 2020 & 2033
- Table 35: Global Mammography Industry Revenue Million Forecast, by End Users 2020 & 2033
- Table 36: Global Mammography Industry Revenue Million Forecast, by Country 2020 & 2033
- Table 37: Brazil Mammography Industry Revenue (Million) Forecast, by Application 2020 & 2033
- Table 38: Argentina Mammography Industry Revenue (Million) Forecast, by Application 2020 & 2033
- Table 39: Rest of South America Mammography Industry Revenue (Million) Forecast, by Application 2020 & 2033
Frequently Asked Questions
1. What is the projected Compound Annual Growth Rate (CAGR) of the Mammography Industry?
The projected CAGR is approximately 9.20%.
2. Which companies are prominent players in the Mammography Industry?
Key companies in the market include Konica Minolta Inc, Metaltronica SpA, Siemens Healthineers, Hologic Inc, GE Healthcare, Carestream Health, Koninklijke Philips NV, General Medical Merate SpA, Planmed Oy, Fujifilm Holdings Corporation, Canon Medical Systems.
3. What are the main segments of the Mammography Industry?
The market segments include Product Type, End Users.
4. Can you provide details about the market size?
The market size is estimated to be USD 2.49 Million as of 2022.
5. What are some drivers contributing to market growth?
Growing Burden of Breast Cancer; Technological Advancements in the Field of Breast Imaging; Investment from Various Organizations in Breast Cancer Screening Campaigns.
6. What are the notable trends driving market growth?
The Digital Mammography Segment is Expected to Account for the Large Market Share During the Forecast Period.
7. Are there any restraints impacting market growth?
Risk of Adverse Effects from Radiation Exposure; Reduction in Reimbursement.
8. Can you provide examples of recent developments in the market?
In May 2022, Volpara Health introduced updated products for its integrated platform for the delivery of personalized breast care at the SBI/ACR Breast Imaging Symposium 2022. Volpara's AI-driven breast software tools provide mammography quality and reporting, volumetric breast density measurements, and cancer risk assessment.
9. What pricing options are available for accessing the report?
Pricing options include single-user, multi-user, and enterprise licenses priced at USD 4750, USD 5250, and USD 8750 respectively.
10. Is the market size provided in terms of value or volume?
The market size is provided in terms of value, measured in Million.
11. Are there any specific market keywords associated with the report?
Yes, the market keyword associated with the report is "Mammography Industry," which aids in identifying and referencing the specific market segment covered.
12. How do I determine which pricing option suits my needs best?
The pricing options vary based on user requirements and access needs. Individual users may opt for single-user licenses, while businesses requiring broader access may choose multi-user or enterprise licenses for cost-effective access to the report.
13. Are there any additional resources or data provided in the Mammography Industry report?
While the report offers comprehensive insights, it's advisable to review the specific contents or supplementary materials provided to ascertain if additional resources or data are available.
14. How can I stay updated on further developments or reports in the Mammography Industry?
To stay informed about further developments, trends, and reports in the Mammography Industry, consider subscribing to industry newsletters, following relevant companies and organizations, or regularly checking reputable industry news sources and publications.
Methodology
Step 1 - Identification of Relevant Samples Size from Population Database


Step 2 - Approaches for Defining Global Market Size (Value, Volume* & Price*)

Note*: In applicable scenarios
Step 3 - Data Sources
Primary Research
- Web Analytics
- Survey Reports
- Research Institute
- Latest Research Reports
- Opinion Leaders
Secondary Research
- Annual Reports
- White Paper
- Latest Press Release
- Industry Association
- Paid Database
- Investor Presentations

Step 4 - Data Triangulation
Involves using different sources of information in order to increase the validity of a study
These sources are likely to be stakeholders in a program - participants, other researchers, program staff, other community members, and so on.
Then we put all data in single framework & apply various statistical tools to find out the dynamic on the market.
During the analysis stage, feedback from the stakeholder groups would be compared to determine areas of agreement as well as areas of divergence