

Key Insights
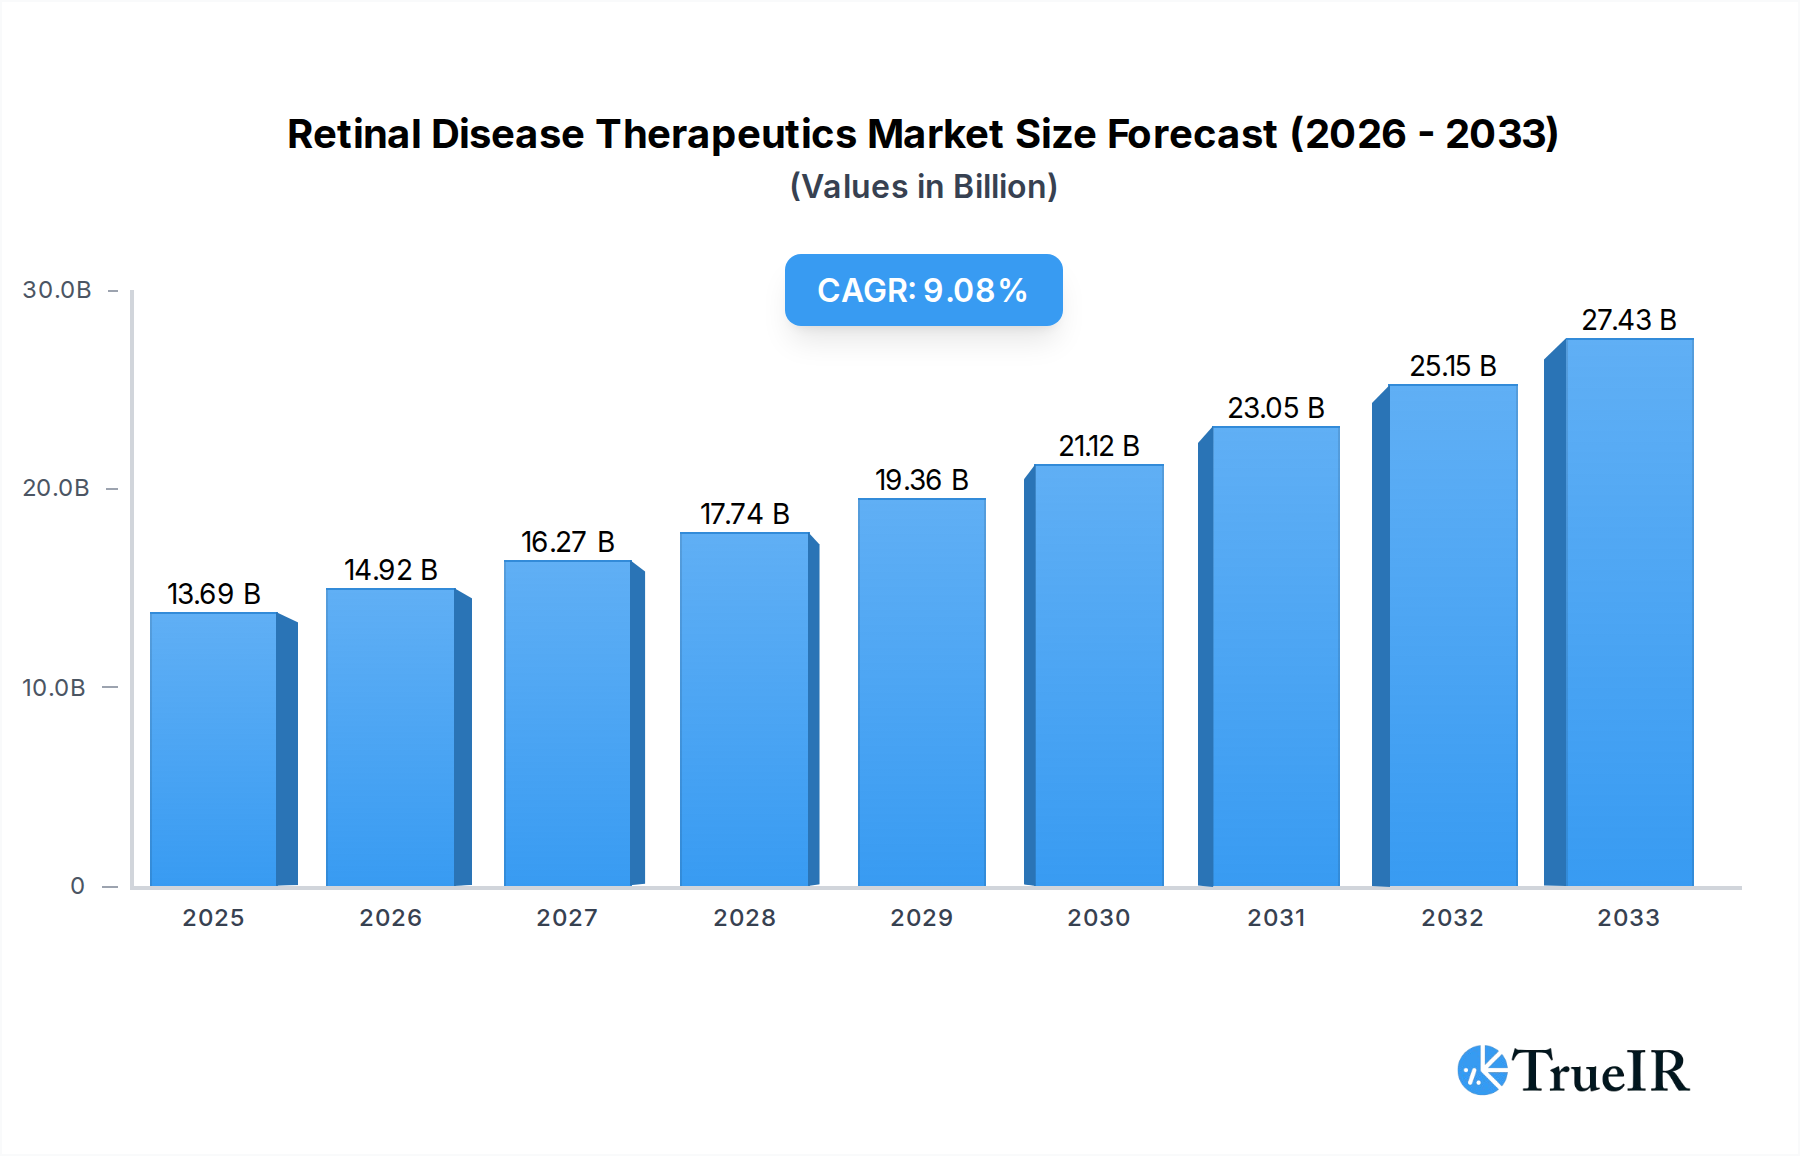
The Retinal Disease Therapeutics Market is poised for significant expansion, projected to reach a substantial USD 13.69 billion in 2025, demonstrating robust growth driven by an estimated Compound Annual Growth Rate (CAGR) of 9%. This upward trajectory is underpinned by a confluence of escalating prevalence of age-related macular degeneration (AMD), diabetic retinopathy (DR), and uveitis, coupled with advancements in drug discovery and delivery technologies. The market's expansion is further propelled by increasing healthcare expenditure globally, a growing aging population susceptible to these debilitating conditions, and a heightened focus on early diagnosis and intervention. Key therapeutic classes, including VEGF-A antagonists and TNF-a inhibitors, are at the forefront of innovation, offering novel treatment paradigms. Steroids continue to play a crucial role in managing inflammatory retinal conditions. The demand for effective therapies is amplified by the significant unmet medical needs in treating chronic and progressive retinal disorders, driving substantial investment in research and development by leading pharmaceutical and biotechnology companies.

Retinal Disease Therapeutics Market Market Size (In Billion)
The market's growth is anticipated to be further bolstered by emerging trends such as the development of gene therapies and optogenetics, promising revolutionary approaches to restoring vision. Increased accessibility to advanced diagnostic tools and a growing awareness among patients and healthcare providers about the importance of timely treatment are also contributing factors. However, the market faces certain restraints, including the high cost of advanced therapies, reimbursement challenges in certain regions, and the complex regulatory pathways for new drug approvals. Despite these hurdles, the inherent need for effective retinal disease management, coupled with ongoing technological and therapeutic innovations, ensures a dynamic and promising future for the Retinal Disease Therapeutics Market. Key players like Regeneron Pharmaceuticals, Novartis, and F Hoffmann-La Roche are at the vanguard, actively shaping the market through strategic partnerships and the launch of novel treatments.
Retinal Disease Therapeutics Market Company Market Share
Retinal Disease Therapeutics Market: In-depth Analysis & Forecast (2019–2033)
This comprehensive report provides an in-depth analysis of the global Retinal Disease Therapeutics Market, a rapidly evolving sector driven by an increasing prevalence of ophthalmic conditions and advancements in biotechnology. Our research covers the study period of 2019–2033, with a base year of 2025 and a forecast period from 2025–2033. The historical period spans from 2019 to 2024, offering a robust foundation for our projections. We explore market dynamics, key players, emerging trends, and growth opportunities within this vital therapeutic area. The report delves into the intricate segmentation by drug class, including VEGF-A Antagonist, TNF-a Inhibitor, and Steroids, and by disease indication, such as Macular Degeneration, Diabetic Retinopathy, Uveitis, and Other Disease Indications. With an estimated market value projected to reach billions of dollars by 2025, this report is an indispensable resource for stakeholders seeking to understand and capitalize on the future of retinal disease treatment.
Retinal Disease Therapeutics Market Market Structure & Competitive Landscape
The Retinal Disease Therapeutics Market is characterized by a moderate to high degree of market concentration, with a handful of dominant players holding significant market share. Innovation remains a primary driver, fueled by substantial investments in research and development (R&D) to address unmet medical needs and improve patient outcomes for conditions like age-related macular degeneration and diabetic retinopathy. Regulatory bodies play a crucial role, with stringent approval processes influencing product launches and market access. The competitive landscape is shaped by the presence of both established pharmaceutical giants and emerging biotechnology firms.
- Key Competitive Factors:
- Pipeline Strength and Novel Drug Development
- Clinical Trial Success Rates and Regulatory Approvals
- Intellectual Property Protection and Patent Expirations
- Manufacturing Capabilities and Supply Chain Efficiency
- Strategic Partnerships and Collaborations
The market also experiences pressure from potential product substitutes, particularly as new therapeutic modalities like gene therapy and cell-based treatments gain traction. End-user segmentation, primarily comprising ophthalmologists, retina specialists, and hospitals, influences prescribing patterns and market reach. Mergers and acquisitions (M&A) are observed as key players seek to expand their portfolios, gain access to innovative technologies, or consolidate market presence. For instance, M&A volumes have seen a consistent upward trend over the historical period, reflecting a strategic consolidation strategy among leading firms. This dynamic structure necessitates a keen understanding of evolving market dynamics and competitive strategies to maintain or enhance market position.
Retinal Disease Therapeutics Market Market Trends & Opportunities
The global Retinal Disease Therapeutics Market is poised for substantial growth, driven by an aging global population and the escalating incidence of chronic eye diseases. The market size is projected to expand at a significant Compound Annual Growth Rate (CAGR) over the forecast period. Technological advancements are fundamentally reshaping the therapeutic landscape. The development of targeted therapies, including advanced biologics and novel small molecules, offers improved efficacy and safety profiles compared to traditional treatments. Gene therapy and cell-based therapies represent a frontier of innovation, promising to address the root causes of certain retinal disorders and offering potential for long-term or even curative effects. These groundbreaking technologies are attracting substantial investment and are expected to capture an increasing market share.
Consumer preferences are increasingly leaning towards less invasive treatment options and therapies that offer a better quality of life. Patients and healthcare providers alike are seeking treatments that minimize the frequency of administration and reduce the burden of chronic management. This trend favors the development of long-acting formulations and innovative drug delivery systems. The competitive dynamics are intensifying, with pharmaceutical companies focusing on differentiating their products through superior clinical outcomes, favorable safety profiles, and comprehensive patient support programs.
Opportunities abound for companies that can effectively address the unmet needs of specific patient populations and disease stages. The increasing adoption of telemedicine and digital health solutions in ophthalmology also presents an opportunity for enhanced patient monitoring, remote diagnostics, and improved treatment adherence. Furthermore, the growing awareness of retinal diseases and the importance of early detection and intervention are contributing to market expansion. The development of biosimil versions of established blockbuster drugs also creates opportunities for cost-effective treatment alternatives, thereby increasing market penetration. The market penetration rate for advanced biologics is expected to rise by over 20% in key developed markets by 2030.
Dominant Markets & Segments in Retinal Disease Therapeutics Market
The Retinal Disease Therapeutics Market is dominated by specific regions and therapeutic segments, reflecting the prevalence of certain diseases and the availability of advanced healthcare infrastructure. Among the disease indications, Macular Degeneration, particularly Wet Age-Related Macular Degeneration (wAMD), consistently emerges as the leading segment. This dominance is driven by the high and growing prevalence of AMD in aging populations worldwide, coupled with significant R&D efforts and the availability of effective treatment options.
Drug Class Dominance:
- VEGF-A Antagonists currently hold a commanding position within the drug class segmentation. Their efficacy in inhibiting the growth of abnormal blood vessels, a hallmark of conditions like wAMD and diabetic retinopathy, has made them the cornerstone of treatment.
- Steroids, while sometimes associated with higher side effects, remain crucial for managing inflammation in conditions like uveitis.
- TNF-a Inhibitors are gaining traction, particularly for inflammatory retinal conditions.
Disease Indication Dominance:
- Macular Degeneration remains the primary driver of market value, accounting for an estimated 60% of the total market revenue in 2025. The increasing incidence of age-related macular degeneration, driven by an aging demographic, fuels this dominance.
- Diabetic Retinopathy represents the second-largest segment, a consequence of the global rise in diabetes prevalence.
- Uveitis and Other Disease Indications, while smaller segments, represent areas of significant growth potential with ongoing research into novel treatments.
Geographically, North America is a dominant market, owing to its advanced healthcare infrastructure, high patient awareness, and significant investment in pharmaceutical R&D. The United States, in particular, contributes a substantial portion of the market share due to its large patient pool and rapid adoption of new therapies. Europe follows as another key market, with strong healthcare systems and supportive regulatory environments.
The growth in these dominant segments is propelled by several key drivers:
- Technological Advancements: Breakthroughs in drug discovery, formulation, and delivery systems continuously improve treatment efficacy and patient experience.
- Favorable Reimbursement Policies: In developed markets, robust reimbursement frameworks ensure patient access to innovative and often costly therapies.
- Increasing Disease Prevalence: The aging global population and the rising rates of diabetes contribute directly to the growing patient base for retinal diseases.
- Investments in R&D: Sustained investments by pharmaceutical and biotechnology companies in developing novel treatments drive market expansion and innovation.
Retinal Disease Therapeutics Market Product Analysis
Product innovation in the Retinal Disease Therapeutics Market is characterized by a focus on enhanced efficacy, improved safety profiles, and novel drug delivery systems. Key advancements include the development of longer-acting intravitreal injections that reduce treatment frequency, offering greater convenience for patients and potentially improving adherence. Gene therapies are emerging as transformative solutions, aiming to address the genetic underpinnings of certain inherited retinal diseases. Furthermore, advancements in understanding disease pathogenesis are leading to the development of highly targeted therapies that minimize off-target effects and optimize treatment outcomes. The competitive advantage lies in demonstrating superior clinical benefits, such as sustained vision improvement or halting disease progression, coupled with a favorable safety profile and a convenient administration route.
Key Drivers, Barriers & Challenges in Retinal Disease Therapeutics Market
The Retinal Disease Therapeutics Market is propelled by several key drivers, including the rising global prevalence of age-related macular degeneration and diabetic retinopathy, fueled by an aging population and increasing rates of diabetes. Technological advancements in drug discovery, particularly in biologics and gene therapies, are creating novel treatment avenues. Robust R&D investments by major pharmaceutical companies and a growing demand for effective and less invasive therapies further contribute to market growth. Favorable reimbursement policies in developed nations also play a crucial role in driving market access and adoption of innovative treatments.
However, the market faces significant challenges and restraints. High R&D costs and lengthy drug development timelines pose financial risks for companies. Stringent regulatory approval processes, while ensuring patient safety, can delay market entry. The competitive pressure from existing treatments and the potential for biosimilar competition can impact market share and profitability. Supply chain complexities, particularly for specialized biologics and gene therapies, can also pose logistical hurdles. Furthermore, patient access and affordability remain critical issues, especially in emerging economies, hindering broader market penetration.
Growth Drivers in the Retinal Disease Therapeutics Market Market
The Retinal Disease Therapeutics Market is experiencing robust growth driven by several critical factors. The escalating global burden of age-related macular degeneration (AMD) and diabetic retinopathy, directly linked to the aging demographic and the pandemic of diabetes, provides a vast and expanding patient pool. Simultaneously, significant advancements in biotechnology are enabling the development of highly targeted and effective therapies. These include sophisticated biologics that precisely inhibit disease pathways and the groundbreaking potential of gene therapies to address the root causes of inherited retinal disorders. Pharmaceutical and biotechnology firms are channeling substantial capital into research and development, accelerating innovation and bringing novel treatments to market. This unwavering commitment to innovation ensures a continuous pipeline of improved therapeutic options. Furthermore, supportive reimbursement policies in key developed markets facilitate patient access to these advanced treatments, further stimulating market expansion.
Challenges Impacting Retinal Disease Therapeutics Market Growth
Despite the promising growth trajectory, the Retinal Disease Therapeutics Market grapples with significant challenges that can impede expansion. The inherent complexity and substantial financial investment required for drug discovery and development, particularly for advanced modalities like gene therapies, present a considerable barrier. The rigorous and often prolonged regulatory approval pathways in major markets, while essential for patient safety, can significantly delay the commercialization of new treatments. Intense competition from established therapeutic options and the impending threat of biosimilar products entering the market can erode market share and profitability for innovator companies. Moreover, the intricate supply chain logistics required for specialized biologics and the cold chain requirements for certain gene therapies can lead to operational complexities and potential disruptions. Ensuring equitable patient access and affordability, particularly in low- and middle-income countries, remains a persistent challenge, limiting the widespread adoption of potentially life-changing treatments.
Key Players Shaping the Retinal Disease Therapeutics Market Market
- MeiraGTx Limited
- Regeneron Pharmaceuticals Inc
- Novartis
- F Hoffmann-La Roche Ltd
- Amgen
- SemaThera Inc
- Adverum Biotechnologies
- Oxurion NV
- AbbVie Inc
- GenSight Biologics
Significant Retinal Disease Therapeutics Market Industry Milestones
- January 2022: The Food and Drug Administration approved Roche's Vabysmo for wet age-related macular degeneration, a significant advancement in treating an eye disorder that can lead to blindness in older individuals.
- April 2022: Shilpa Biologicals (SBPL) received an NoC from RCGM, Dept of Biotechnology, to initiate clinical studies for its Biosimilar Aflibercept. This paves the way for potential clinical trials in India and globally for conditions including Wet Age-Related Macular Degeneration (wAMD), Diabetic Retinopathy, Diabetic Macular Edema (DME), and Macular Edema following Retinal Vein Occlusion.
Future Outlook for Retinal Disease Therapeutics Market Market
The future outlook for the Retinal Disease Therapeutics Market is exceptionally promising, driven by continuous innovation and an expanding patient base. The market is set to witness the widespread adoption of next-generation therapies, including advanced gene therapies and personalized medicine approaches, which promise to offer more targeted and potentially curative treatments. Strategic partnerships and collaborations between pharmaceutical giants and innovative biotechnology firms will accelerate the development and commercialization of these cutting-edge therapies. Furthermore, increasing investments in R&D for rare retinal diseases will open up new therapeutic frontiers. The growing focus on preventative care and early detection, coupled with advancements in diagnostic technologies, will also contribute to sustained market growth. The market is poised for a transformative period, offering significant opportunities for stakeholders to address unmet medical needs and improve the quality of life for millions affected by retinal diseases.
Retinal Disease Therapeutics Market Segmentation
-
1. Drug Class
- 1.1. VEGF-A Antagonist
- 1.2. TNF-a Inhibitor
- 1.3. Steroids
-
2. Disease Indication
- 2.1. Macular Degeneration
- 2.2. Diabetic Retinopathy
- 2.3. Uveitis
- 2.4. Other Disease Indications
Retinal Disease Therapeutics Market Segmentation By Geography
-
1. North America
- 1.1. United States
- 1.2. Canada
- 1.3. Mexico
-
2. Europe
- 2.1. Germany
- 2.2. United Kingdom
- 2.3. France
- 2.4. Italy
- 2.5. Spain
- 2.6. Rest of Europe
-
3. Asia Pacific
- 3.1. China
- 3.2. Japan
- 3.3. India
- 3.4. Australia
- 3.5. South Korea
- 3.6. Rest of Asia Pacific
-
4. Middle East and Africa
- 4.1. GCC
- 4.2. South Africa
- 4.3. Rest of Middle East and Africa
-
5. South America
- 5.1. Brazil
- 5.2. Argentina
- 5.3. Rest of South America
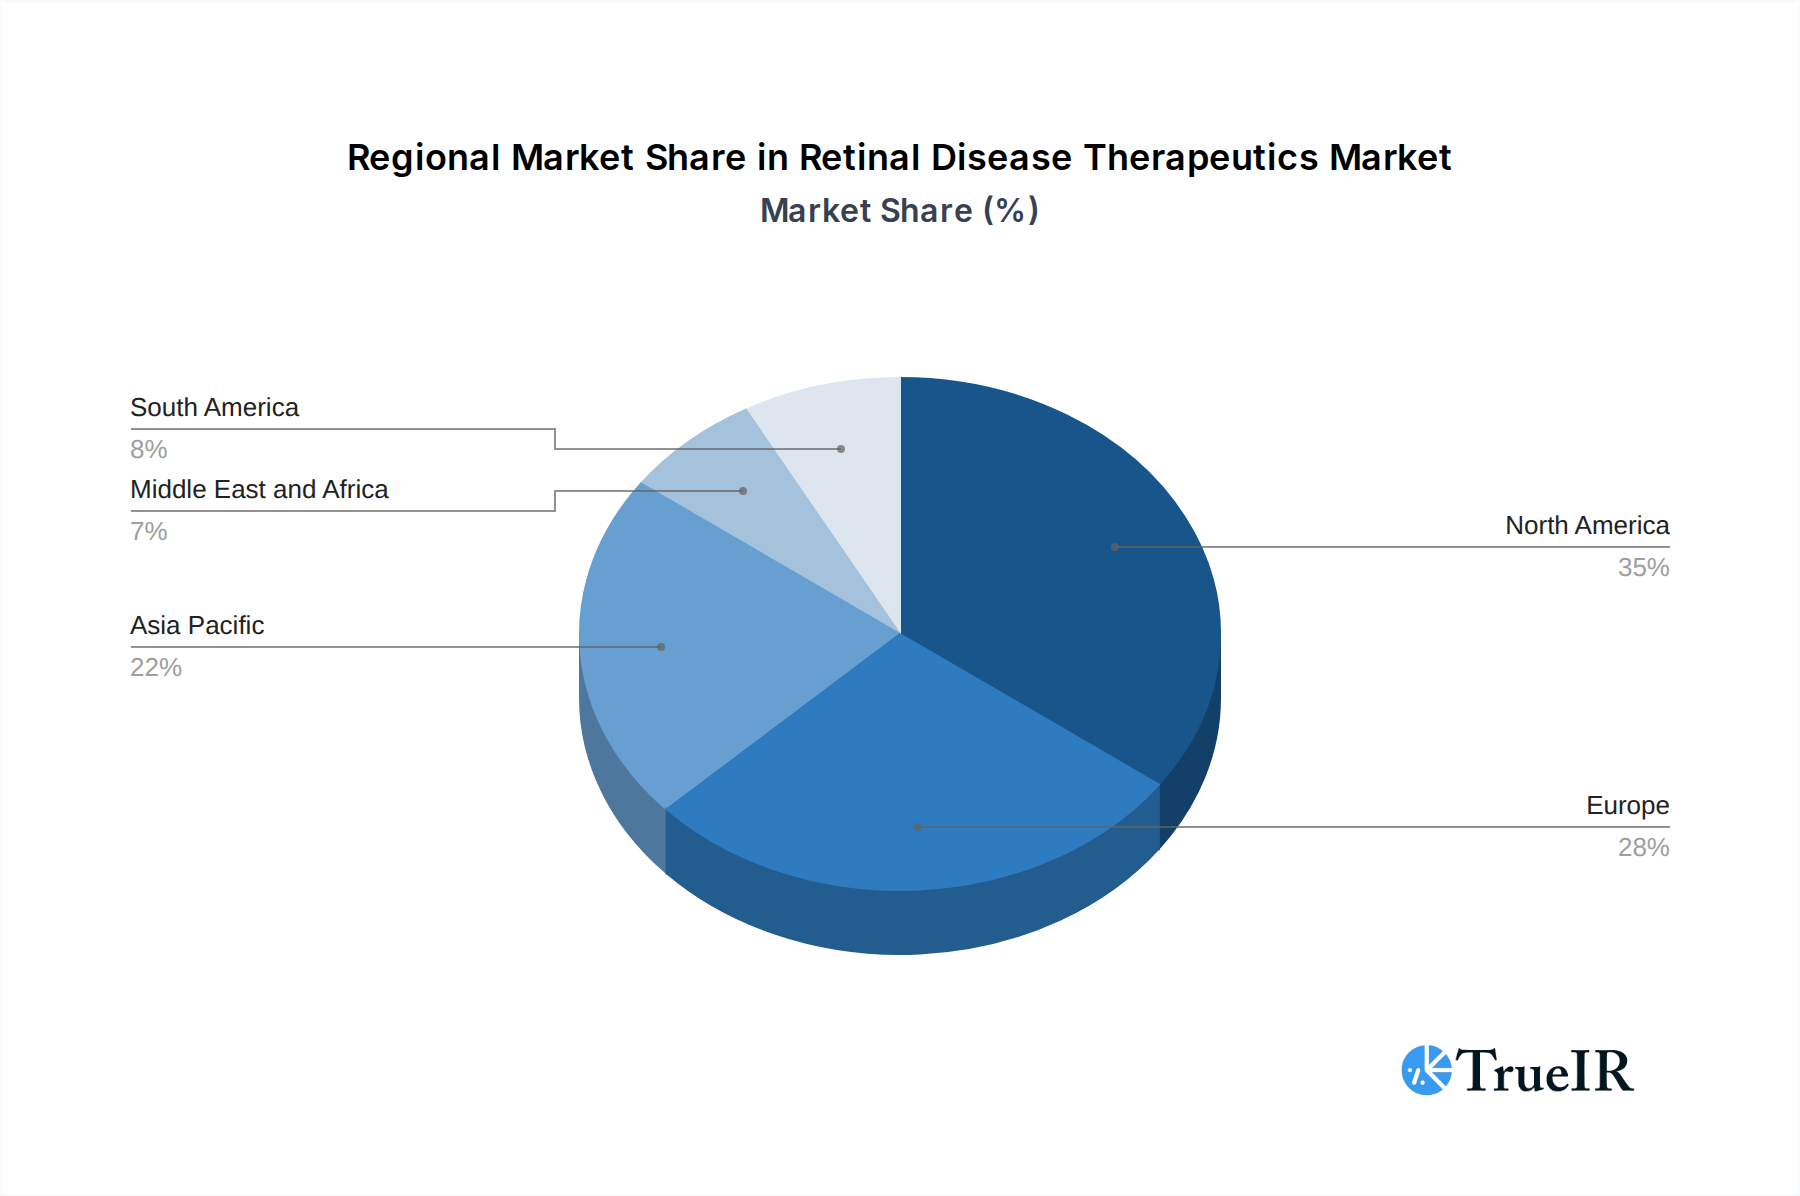
Retinal Disease Therapeutics Market Regional Market Share
Geographic Coverage of Retinal Disease Therapeutics Market
Retinal Disease Therapeutics Market REPORT HIGHLIGHTS
| Aspects | Details |
|---|---|
| Study Period | 2020-2034 |
| Base Year | 2025 |
| Estimated Year | 2026 |
| Forecast Period | 2026-2034 |
| Historical Period | 2020-2025 |
| Growth Rate | CAGR of 9% from 2020-2034 |
| Segmentation |
|
Table of Contents
- 1. Introduction
- 1.1. Research Scope
- 1.2. Market Segmentation
- 1.3. Research Objective
- 1.4. Definitions and Assumptions
- 2. Executive Summary
- 2.1. Market Snapshot
- 3. Market Dynamics
- 3.1. Market Drivers
- 3.2. Market Restrains
- 3.3. Market Trends
- 3.4. Market Opportunities
- 4. Market Factor Analysis
- 4.1. Porters Five Forces
- 4.1.1. Bargaining Power of Suppliers
- 4.1.2. Bargaining Power of Buyers
- 4.1.3. Threat of New Entrants
- 4.1.4. Threat of Substitutes
- 4.1.5. Competitive Rivalry
- 4.2. PESTEL analysis
- 4.3. BCG Analysis
- 4.3.1. Stars (High Growth, High Market Share)
- 4.3.2. Cash Cows (Low Growth, High Market Share)
- 4.3.3. Question Mark (High Growth, Low Market Share)
- 4.3.4. Dogs (Low Growth, Low Market Share)
- 4.4. Ansoff Matrix Analysis
- 4.5. Supply Chain Analysis
- 4.6. Regulatory Landscape
- 4.7. Current Market Potential and Opportunity Assessment (TAM–SAM–SOM Framework)
- 4.8. TIR Analyst Note
- 4.1. Porters Five Forces
- 5. Market Analysis, Insights and Forecast 2021-2033
- 5.1. Market Analysis, Insights and Forecast - by Drug Class
- 5.1.1. VEGF-A Antagonist
- 5.1.2. TNF-a Inhibitor
- 5.1.3. Steroids
- 5.2. Market Analysis, Insights and Forecast - by Disease Indication
- 5.2.1. Macular Degeneration
- 5.2.2. Diabetic Retinopathy
- 5.2.3. Uveitis
- 5.2.4. Other Disease Indications
- 5.3. Market Analysis, Insights and Forecast - by Region
- 5.3.1. North America
- 5.3.2. Europe
- 5.3.3. Asia Pacific
- 5.3.4. Middle East and Africa
- 5.3.5. South America
- 5.1. Market Analysis, Insights and Forecast - by Drug Class
- 6. Global Retinal Disease Therapeutics Market Analysis, Insights and Forecast, 2021-2033
- 6.1. Market Analysis, Insights and Forecast - by Drug Class
- 6.1.1. VEGF-A Antagonist
- 6.1.2. TNF-a Inhibitor
- 6.1.3. Steroids
- 6.2. Market Analysis, Insights and Forecast - by Disease Indication
- 6.2.1. Macular Degeneration
- 6.2.2. Diabetic Retinopathy
- 6.2.3. Uveitis
- 6.2.4. Other Disease Indications
- 6.1. Market Analysis, Insights and Forecast - by Drug Class
- 7. North America Retinal Disease Therapeutics Market Analysis, Insights and Forecast, 2020-2032
- 7.1. Market Analysis, Insights and Forecast - by Drug Class
- 7.1.1. VEGF-A Antagonist
- 7.1.2. TNF-a Inhibitor
- 7.1.3. Steroids
- 7.2. Market Analysis, Insights and Forecast - by Disease Indication
- 7.2.1. Macular Degeneration
- 7.2.2. Diabetic Retinopathy
- 7.2.3. Uveitis
- 7.2.4. Other Disease Indications
- 7.1. Market Analysis, Insights and Forecast - by Drug Class
- 8. Europe Retinal Disease Therapeutics Market Analysis, Insights and Forecast, 2020-2032
- 8.1. Market Analysis, Insights and Forecast - by Drug Class
- 8.1.1. VEGF-A Antagonist
- 8.1.2. TNF-a Inhibitor
- 8.1.3. Steroids
- 8.2. Market Analysis, Insights and Forecast - by Disease Indication
- 8.2.1. Macular Degeneration
- 8.2.2. Diabetic Retinopathy
- 8.2.3. Uveitis
- 8.2.4. Other Disease Indications
- 8.1. Market Analysis, Insights and Forecast - by Drug Class
- 9. Asia Pacific Retinal Disease Therapeutics Market Analysis, Insights and Forecast, 2020-2032
- 9.1. Market Analysis, Insights and Forecast - by Drug Class
- 9.1.1. VEGF-A Antagonist
- 9.1.2. TNF-a Inhibitor
- 9.1.3. Steroids
- 9.2. Market Analysis, Insights and Forecast - by Disease Indication
- 9.2.1. Macular Degeneration
- 9.2.2. Diabetic Retinopathy
- 9.2.3. Uveitis
- 9.2.4. Other Disease Indications
- 9.1. Market Analysis, Insights and Forecast - by Drug Class
- 10. Middle East and Africa Retinal Disease Therapeutics Market Analysis, Insights and Forecast, 2020-2032
- 10.1. Market Analysis, Insights and Forecast - by Drug Class
- 10.1.1. VEGF-A Antagonist
- 10.1.2. TNF-a Inhibitor
- 10.1.3. Steroids
- 10.2. Market Analysis, Insights and Forecast - by Disease Indication
- 10.2.1. Macular Degeneration
- 10.2.2. Diabetic Retinopathy
- 10.2.3. Uveitis
- 10.2.4. Other Disease Indications
- 10.1. Market Analysis, Insights and Forecast - by Drug Class
- 11. South America Retinal Disease Therapeutics Market Analysis, Insights and Forecast, 2020-2032
- 11.1. Market Analysis, Insights and Forecast - by Drug Class
- 11.1.1. VEGF-A Antagonist
- 11.1.2. TNF-a Inhibitor
- 11.1.3. Steroids
- 11.2. Market Analysis, Insights and Forecast - by Disease Indication
- 11.2.1. Macular Degeneration
- 11.2.2. Diabetic Retinopathy
- 11.2.3. Uveitis
- 11.2.4. Other Disease Indications
- 11.1. Market Analysis, Insights and Forecast - by Drug Class
- 12. Competitive Analysis
- 12.1. Company Profiles
- 12.1.1 MeiraGTx Limited
- 12.1.1.1. Company Overview
- 12.1.1.2. Products
- 12.1.1.3. Company Financials
- 12.1.1.4. SWOT Analysis
- 12.1.2 Regeneron Pharmaceuticals Inc
- 12.1.2.1. Company Overview
- 12.1.2.2. Products
- 12.1.2.3. Company Financials
- 12.1.2.4. SWOT Analysis
- 12.1.3 Novartis
- 12.1.3.1. Company Overview
- 12.1.3.2. Products
- 12.1.3.3. Company Financials
- 12.1.3.4. SWOT Analysis
- 12.1.4 F Hoffmann-La Roche Ltd
- 12.1.4.1. Company Overview
- 12.1.4.2. Products
- 12.1.4.3. Company Financials
- 12.1.4.4. SWOT Analysis
- 12.1.5 Amgen
- 12.1.5.1. Company Overview
- 12.1.5.2. Products
- 12.1.5.3. Company Financials
- 12.1.5.4. SWOT Analysis
- 12.1.6 SemaThera Inc
- 12.1.6.1. Company Overview
- 12.1.6.2. Products
- 12.1.6.3. Company Financials
- 12.1.6.4. SWOT Analysis
- 12.1.7 Adverum Biotechnologies
- 12.1.7.1. Company Overview
- 12.1.7.2. Products
- 12.1.7.3. Company Financials
- 12.1.7.4. SWOT Analysis
- 12.1.8 Oxurion NV
- 12.1.8.1. Company Overview
- 12.1.8.2. Products
- 12.1.8.3. Company Financials
- 12.1.8.4. SWOT Analysis
- 12.1.9 AbbVie Inc
- 12.1.9.1. Company Overview
- 12.1.9.2. Products
- 12.1.9.3. Company Financials
- 12.1.9.4. SWOT Analysis
- 12.1.10 GenSight Biologics
- 12.1.10.1. Company Overview
- 12.1.10.2. Products
- 12.1.10.3. Company Financials
- 12.1.10.4. SWOT Analysis
- 12.1.1 MeiraGTx Limited
- 12.2. Market Entropy
- 12.2.1 Company's Key Areas Served
- 12.2.2 Recent Developments
- 12.3. Company Market Share Analysis 2025
- 12.3.1 Top 5 Companies Market Share Analysis
- 12.3.2 Top 3 Companies Market Share Analysis
- 12.4. List of Potential Customers
- 13. Research Methodology
List of Figures
- Figure 1: Global Retinal Disease Therapeutics Market Revenue Breakdown (billion, %) by Region 2025 & 2033
- Figure 2: Global Retinal Disease Therapeutics Market Volume Breakdown (K Unit, %) by Region 2025 & 2033
- Figure 3: North America Retinal Disease Therapeutics Market Revenue (billion), by Drug Class 2025 & 2033
- Figure 4: North America Retinal Disease Therapeutics Market Volume (K Unit), by Drug Class 2025 & 2033
- Figure 5: North America Retinal Disease Therapeutics Market Revenue Share (%), by Drug Class 2025 & 2033
- Figure 6: North America Retinal Disease Therapeutics Market Volume Share (%), by Drug Class 2025 & 2033
- Figure 7: North America Retinal Disease Therapeutics Market Revenue (billion), by Disease Indication 2025 & 2033
- Figure 8: North America Retinal Disease Therapeutics Market Volume (K Unit), by Disease Indication 2025 & 2033
- Figure 9: North America Retinal Disease Therapeutics Market Revenue Share (%), by Disease Indication 2025 & 2033
- Figure 10: North America Retinal Disease Therapeutics Market Volume Share (%), by Disease Indication 2025 & 2033
- Figure 11: North America Retinal Disease Therapeutics Market Revenue (billion), by Country 2025 & 2033
- Figure 12: North America Retinal Disease Therapeutics Market Volume (K Unit), by Country 2025 & 2033
- Figure 13: North America Retinal Disease Therapeutics Market Revenue Share (%), by Country 2025 & 2033
- Figure 14: North America Retinal Disease Therapeutics Market Volume Share (%), by Country 2025 & 2033
- Figure 15: Europe Retinal Disease Therapeutics Market Revenue (billion), by Drug Class 2025 & 2033
- Figure 16: Europe Retinal Disease Therapeutics Market Volume (K Unit), by Drug Class 2025 & 2033
- Figure 17: Europe Retinal Disease Therapeutics Market Revenue Share (%), by Drug Class 2025 & 2033
- Figure 18: Europe Retinal Disease Therapeutics Market Volume Share (%), by Drug Class 2025 & 2033
- Figure 19: Europe Retinal Disease Therapeutics Market Revenue (billion), by Disease Indication 2025 & 2033
- Figure 20: Europe Retinal Disease Therapeutics Market Volume (K Unit), by Disease Indication 2025 & 2033
- Figure 21: Europe Retinal Disease Therapeutics Market Revenue Share (%), by Disease Indication 2025 & 2033
- Figure 22: Europe Retinal Disease Therapeutics Market Volume Share (%), by Disease Indication 2025 & 2033
- Figure 23: Europe Retinal Disease Therapeutics Market Revenue (billion), by Country 2025 & 2033
- Figure 24: Europe Retinal Disease Therapeutics Market Volume (K Unit), by Country 2025 & 2033
- Figure 25: Europe Retinal Disease Therapeutics Market Revenue Share (%), by Country 2025 & 2033
- Figure 26: Europe Retinal Disease Therapeutics Market Volume Share (%), by Country 2025 & 2033
- Figure 27: Asia Pacific Retinal Disease Therapeutics Market Revenue (billion), by Drug Class 2025 & 2033
- Figure 28: Asia Pacific Retinal Disease Therapeutics Market Volume (K Unit), by Drug Class 2025 & 2033
- Figure 29: Asia Pacific Retinal Disease Therapeutics Market Revenue Share (%), by Drug Class 2025 & 2033
- Figure 30: Asia Pacific Retinal Disease Therapeutics Market Volume Share (%), by Drug Class 2025 & 2033
- Figure 31: Asia Pacific Retinal Disease Therapeutics Market Revenue (billion), by Disease Indication 2025 & 2033
- Figure 32: Asia Pacific Retinal Disease Therapeutics Market Volume (K Unit), by Disease Indication 2025 & 2033
- Figure 33: Asia Pacific Retinal Disease Therapeutics Market Revenue Share (%), by Disease Indication 2025 & 2033
- Figure 34: Asia Pacific Retinal Disease Therapeutics Market Volume Share (%), by Disease Indication 2025 & 2033
- Figure 35: Asia Pacific Retinal Disease Therapeutics Market Revenue (billion), by Country 2025 & 2033
- Figure 36: Asia Pacific Retinal Disease Therapeutics Market Volume (K Unit), by Country 2025 & 2033
- Figure 37: Asia Pacific Retinal Disease Therapeutics Market Revenue Share (%), by Country 2025 & 2033
- Figure 38: Asia Pacific Retinal Disease Therapeutics Market Volume Share (%), by Country 2025 & 2033
- Figure 39: Middle East and Africa Retinal Disease Therapeutics Market Revenue (billion), by Drug Class 2025 & 2033
- Figure 40: Middle East and Africa Retinal Disease Therapeutics Market Volume (K Unit), by Drug Class 2025 & 2033
- Figure 41: Middle East and Africa Retinal Disease Therapeutics Market Revenue Share (%), by Drug Class 2025 & 2033
- Figure 42: Middle East and Africa Retinal Disease Therapeutics Market Volume Share (%), by Drug Class 2025 & 2033
- Figure 43: Middle East and Africa Retinal Disease Therapeutics Market Revenue (billion), by Disease Indication 2025 & 2033
- Figure 44: Middle East and Africa Retinal Disease Therapeutics Market Volume (K Unit), by Disease Indication 2025 & 2033
- Figure 45: Middle East and Africa Retinal Disease Therapeutics Market Revenue Share (%), by Disease Indication 2025 & 2033
- Figure 46: Middle East and Africa Retinal Disease Therapeutics Market Volume Share (%), by Disease Indication 2025 & 2033
- Figure 47: Middle East and Africa Retinal Disease Therapeutics Market Revenue (billion), by Country 2025 & 2033
- Figure 48: Middle East and Africa Retinal Disease Therapeutics Market Volume (K Unit), by Country 2025 & 2033
- Figure 49: Middle East and Africa Retinal Disease Therapeutics Market Revenue Share (%), by Country 2025 & 2033
- Figure 50: Middle East and Africa Retinal Disease Therapeutics Market Volume Share (%), by Country 2025 & 2033
- Figure 51: South America Retinal Disease Therapeutics Market Revenue (billion), by Drug Class 2025 & 2033
- Figure 52: South America Retinal Disease Therapeutics Market Volume (K Unit), by Drug Class 2025 & 2033
- Figure 53: South America Retinal Disease Therapeutics Market Revenue Share (%), by Drug Class 2025 & 2033
- Figure 54: South America Retinal Disease Therapeutics Market Volume Share (%), by Drug Class 2025 & 2033
- Figure 55: South America Retinal Disease Therapeutics Market Revenue (billion), by Disease Indication 2025 & 2033
- Figure 56: South America Retinal Disease Therapeutics Market Volume (K Unit), by Disease Indication 2025 & 2033
- Figure 57: South America Retinal Disease Therapeutics Market Revenue Share (%), by Disease Indication 2025 & 2033
- Figure 58: South America Retinal Disease Therapeutics Market Volume Share (%), by Disease Indication 2025 & 2033
- Figure 59: South America Retinal Disease Therapeutics Market Revenue (billion), by Country 2025 & 2033
- Figure 60: South America Retinal Disease Therapeutics Market Volume (K Unit), by Country 2025 & 2033
- Figure 61: South America Retinal Disease Therapeutics Market Revenue Share (%), by Country 2025 & 2033
- Figure 62: South America Retinal Disease Therapeutics Market Volume Share (%), by Country 2025 & 2033
List of Tables
- Table 1: Global Retinal Disease Therapeutics Market Revenue billion Forecast, by Drug Class 2020 & 2033
- Table 2: Global Retinal Disease Therapeutics Market Volume K Unit Forecast, by Drug Class 2020 & 2033
- Table 3: Global Retinal Disease Therapeutics Market Revenue billion Forecast, by Disease Indication 2020 & 2033
- Table 4: Global Retinal Disease Therapeutics Market Volume K Unit Forecast, by Disease Indication 2020 & 2033
- Table 5: Global Retinal Disease Therapeutics Market Revenue billion Forecast, by Region 2020 & 2033
- Table 6: Global Retinal Disease Therapeutics Market Volume K Unit Forecast, by Region 2020 & 2033
- Table 7: Global Retinal Disease Therapeutics Market Revenue billion Forecast, by Drug Class 2020 & 2033
- Table 8: Global Retinal Disease Therapeutics Market Volume K Unit Forecast, by Drug Class 2020 & 2033
- Table 9: Global Retinal Disease Therapeutics Market Revenue billion Forecast, by Disease Indication 2020 & 2033
- Table 10: Global Retinal Disease Therapeutics Market Volume K Unit Forecast, by Disease Indication 2020 & 2033
- Table 11: Global Retinal Disease Therapeutics Market Revenue billion Forecast, by Country 2020 & 2033
- Table 12: Global Retinal Disease Therapeutics Market Volume K Unit Forecast, by Country 2020 & 2033
- Table 13: United States Retinal Disease Therapeutics Market Revenue (billion) Forecast, by Application 2020 & 2033
- Table 14: United States Retinal Disease Therapeutics Market Volume (K Unit) Forecast, by Application 2020 & 2033
- Table 15: Canada Retinal Disease Therapeutics Market Revenue (billion) Forecast, by Application 2020 & 2033
- Table 16: Canada Retinal Disease Therapeutics Market Volume (K Unit) Forecast, by Application 2020 & 2033
- Table 17: Mexico Retinal Disease Therapeutics Market Revenue (billion) Forecast, by Application 2020 & 2033
- Table 18: Mexico Retinal Disease Therapeutics Market Volume (K Unit) Forecast, by Application 2020 & 2033
- Table 19: Global Retinal Disease Therapeutics Market Revenue billion Forecast, by Drug Class 2020 & 2033
- Table 20: Global Retinal Disease Therapeutics Market Volume K Unit Forecast, by Drug Class 2020 & 2033
- Table 21: Global Retinal Disease Therapeutics Market Revenue billion Forecast, by Disease Indication 2020 & 2033
- Table 22: Global Retinal Disease Therapeutics Market Volume K Unit Forecast, by Disease Indication 2020 & 2033
- Table 23: Global Retinal Disease Therapeutics Market Revenue billion Forecast, by Country 2020 & 2033
- Table 24: Global Retinal Disease Therapeutics Market Volume K Unit Forecast, by Country 2020 & 2033
- Table 25: Germany Retinal Disease Therapeutics Market Revenue (billion) Forecast, by Application 2020 & 2033
- Table 26: Germany Retinal Disease Therapeutics Market Volume (K Unit) Forecast, by Application 2020 & 2033
- Table 27: United Kingdom Retinal Disease Therapeutics Market Revenue (billion) Forecast, by Application 2020 & 2033
- Table 28: United Kingdom Retinal Disease Therapeutics Market Volume (K Unit) Forecast, by Application 2020 & 2033
- Table 29: France Retinal Disease Therapeutics Market Revenue (billion) Forecast, by Application 2020 & 2033
- Table 30: France Retinal Disease Therapeutics Market Volume (K Unit) Forecast, by Application 2020 & 2033
- Table 31: Italy Retinal Disease Therapeutics Market Revenue (billion) Forecast, by Application 2020 & 2033
- Table 32: Italy Retinal Disease Therapeutics Market Volume (K Unit) Forecast, by Application 2020 & 2033
- Table 33: Spain Retinal Disease Therapeutics Market Revenue (billion) Forecast, by Application 2020 & 2033
- Table 34: Spain Retinal Disease Therapeutics Market Volume (K Unit) Forecast, by Application 2020 & 2033
- Table 35: Rest of Europe Retinal Disease Therapeutics Market Revenue (billion) Forecast, by Application 2020 & 2033
- Table 36: Rest of Europe Retinal Disease Therapeutics Market Volume (K Unit) Forecast, by Application 2020 & 2033
- Table 37: Global Retinal Disease Therapeutics Market Revenue billion Forecast, by Drug Class 2020 & 2033
- Table 38: Global Retinal Disease Therapeutics Market Volume K Unit Forecast, by Drug Class 2020 & 2033
- Table 39: Global Retinal Disease Therapeutics Market Revenue billion Forecast, by Disease Indication 2020 & 2033
- Table 40: Global Retinal Disease Therapeutics Market Volume K Unit Forecast, by Disease Indication 2020 & 2033
- Table 41: Global Retinal Disease Therapeutics Market Revenue billion Forecast, by Country 2020 & 2033
- Table 42: Global Retinal Disease Therapeutics Market Volume K Unit Forecast, by Country 2020 & 2033
- Table 43: China Retinal Disease Therapeutics Market Revenue (billion) Forecast, by Application 2020 & 2033
- Table 44: China Retinal Disease Therapeutics Market Volume (K Unit) Forecast, by Application 2020 & 2033
- Table 45: Japan Retinal Disease Therapeutics Market Revenue (billion) Forecast, by Application 2020 & 2033
- Table 46: Japan Retinal Disease Therapeutics Market Volume (K Unit) Forecast, by Application 2020 & 2033
- Table 47: India Retinal Disease Therapeutics Market Revenue (billion) Forecast, by Application 2020 & 2033
- Table 48: India Retinal Disease Therapeutics Market Volume (K Unit) Forecast, by Application 2020 & 2033
- Table 49: Australia Retinal Disease Therapeutics Market Revenue (billion) Forecast, by Application 2020 & 2033
- Table 50: Australia Retinal Disease Therapeutics Market Volume (K Unit) Forecast, by Application 2020 & 2033
- Table 51: South Korea Retinal Disease Therapeutics Market Revenue (billion) Forecast, by Application 2020 & 2033
- Table 52: South Korea Retinal Disease Therapeutics Market Volume (K Unit) Forecast, by Application 2020 & 2033
- Table 53: Rest of Asia Pacific Retinal Disease Therapeutics Market Revenue (billion) Forecast, by Application 2020 & 2033
- Table 54: Rest of Asia Pacific Retinal Disease Therapeutics Market Volume (K Unit) Forecast, by Application 2020 & 2033
- Table 55: Global Retinal Disease Therapeutics Market Revenue billion Forecast, by Drug Class 2020 & 2033
- Table 56: Global Retinal Disease Therapeutics Market Volume K Unit Forecast, by Drug Class 2020 & 2033
- Table 57: Global Retinal Disease Therapeutics Market Revenue billion Forecast, by Disease Indication 2020 & 2033
- Table 58: Global Retinal Disease Therapeutics Market Volume K Unit Forecast, by Disease Indication 2020 & 2033
- Table 59: Global Retinal Disease Therapeutics Market Revenue billion Forecast, by Country 2020 & 2033
- Table 60: Global Retinal Disease Therapeutics Market Volume K Unit Forecast, by Country 2020 & 2033
- Table 61: GCC Retinal Disease Therapeutics Market Revenue (billion) Forecast, by Application 2020 & 2033
- Table 62: GCC Retinal Disease Therapeutics Market Volume (K Unit) Forecast, by Application 2020 & 2033
- Table 63: South Africa Retinal Disease Therapeutics Market Revenue (billion) Forecast, by Application 2020 & 2033
- Table 64: South Africa Retinal Disease Therapeutics Market Volume (K Unit) Forecast, by Application 2020 & 2033
- Table 65: Rest of Middle East and Africa Retinal Disease Therapeutics Market Revenue (billion) Forecast, by Application 2020 & 2033
- Table 66: Rest of Middle East and Africa Retinal Disease Therapeutics Market Volume (K Unit) Forecast, by Application 2020 & 2033
- Table 67: Global Retinal Disease Therapeutics Market Revenue billion Forecast, by Drug Class 2020 & 2033
- Table 68: Global Retinal Disease Therapeutics Market Volume K Unit Forecast, by Drug Class 2020 & 2033
- Table 69: Global Retinal Disease Therapeutics Market Revenue billion Forecast, by Disease Indication 2020 & 2033
- Table 70: Global Retinal Disease Therapeutics Market Volume K Unit Forecast, by Disease Indication 2020 & 2033
- Table 71: Global Retinal Disease Therapeutics Market Revenue billion Forecast, by Country 2020 & 2033
- Table 72: Global Retinal Disease Therapeutics Market Volume K Unit Forecast, by Country 2020 & 2033
- Table 73: Brazil Retinal Disease Therapeutics Market Revenue (billion) Forecast, by Application 2020 & 2033
- Table 74: Brazil Retinal Disease Therapeutics Market Volume (K Unit) Forecast, by Application 2020 & 2033
- Table 75: Argentina Retinal Disease Therapeutics Market Revenue (billion) Forecast, by Application 2020 & 2033
- Table 76: Argentina Retinal Disease Therapeutics Market Volume (K Unit) Forecast, by Application 2020 & 2033
- Table 77: Rest of South America Retinal Disease Therapeutics Market Revenue (billion) Forecast, by Application 2020 & 2033
- Table 78: Rest of South America Retinal Disease Therapeutics Market Volume (K Unit) Forecast, by Application 2020 & 2033
Frequently Asked Questions
1. What is the projected Compound Annual Growth Rate (CAGR) of the Retinal Disease Therapeutics Market?
The projected CAGR is approximately 9%.
2. Which companies are prominent players in the Retinal Disease Therapeutics Market?
Key companies in the market include MeiraGTx Limited, Regeneron Pharmaceuticals Inc, Novartis, F Hoffmann-La Roche Ltd, Amgen, SemaThera Inc, Adverum Biotechnologies, Oxurion NV, AbbVie Inc, GenSight Biologics.
3. What are the main segments of the Retinal Disease Therapeutics Market?
The market segments include Drug Class, Disease Indication.
4. Can you provide details about the market size?
The market size is estimated to be USD 13.69 billion as of 2022.
5. What are some drivers contributing to market growth?
Rising Burden of Retinal Diseases and Increasing Diabetic Patient Population; Increasing R&D Activities and Growing Number of FDA Approvals.
6. What are the notable trends driving market growth?
Diabetic Retinopathy Segment Expected to Witness Growth over the Forecast Period.
7. Are there any restraints impacting market growth?
Stringent Regulatory Process and Initial High Capital Investment.
8. Can you provide examples of recent developments in the market?
In April 2022, Shilpa Biologicals (SBPL) received an NoC from RCGM, Dept of Biotechnology, to approach the Drugs Controller General of India (DCGI) to conduct clinical studies for its Biosimilar Aflibercept for the Wet Age-Related Macular Degeneration (wAMD), Diabetic Retinopathy, Diabetic Macular Edema (DME) and Macular Edema following Retinal Vein Occlusion markets in India and globally.
9. What pricing options are available for accessing the report?
Pricing options include single-user, multi-user, and enterprise licenses priced at USD 4750, USD 5250, and USD 8750 respectively.
10. Is the market size provided in terms of value or volume?
The market size is provided in terms of value, measured in billion and volume, measured in K Unit.
11. Are there any specific market keywords associated with the report?
Yes, the market keyword associated with the report is "Retinal Disease Therapeutics Market," which aids in identifying and referencing the specific market segment covered.
12. How do I determine which pricing option suits my needs best?
The pricing options vary based on user requirements and access needs. Individual users may opt for single-user licenses, while businesses requiring broader access may choose multi-user or enterprise licenses for cost-effective access to the report.
13. Are there any additional resources or data provided in the Retinal Disease Therapeutics Market report?
While the report offers comprehensive insights, it's advisable to review the specific contents or supplementary materials provided to ascertain if additional resources or data are available.
14. How can I stay updated on further developments or reports in the Retinal Disease Therapeutics Market?
To stay informed about further developments, trends, and reports in the Retinal Disease Therapeutics Market, consider subscribing to industry newsletters, following relevant companies and organizations, or regularly checking reputable industry news sources and publications.
Methodology
Step 1 - Identification of Relevant Samples Size from Population Database


Step 2 - Approaches for Defining Global Market Size (Value, Volume* & Price*)

Note*: In applicable scenarios
Step 3 - Data Sources
Primary Research
- Web Analytics
- Survey Reports
- Research Institute
- Latest Research Reports
- Opinion Leaders
Secondary Research
- Annual Reports
- White Paper
- Latest Press Release
- Industry Association
- Paid Database
- Investor Presentations

Step 4 - Data Triangulation
Involves using different sources of information in order to increase the validity of a study
These sources are likely to be stakeholders in a program - participants, other researchers, program staff, other community members, and so on.
Then we put all data in single framework & apply various statistical tools to find out the dynamic on the market.
During the analysis stage, feedback from the stakeholder groups would be compared to determine areas of agreement as well as areas of divergence