

Key Insights
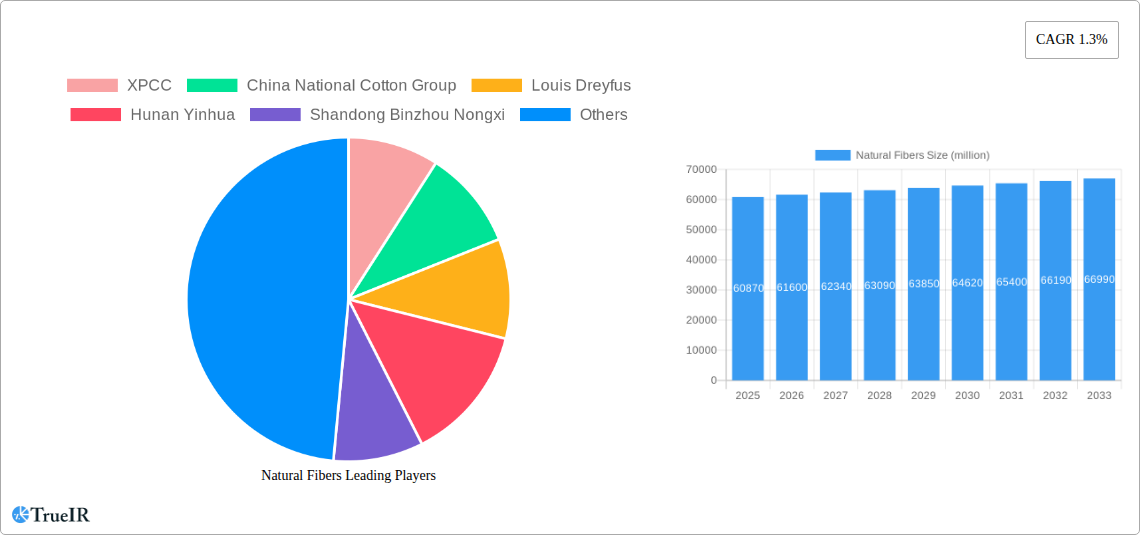
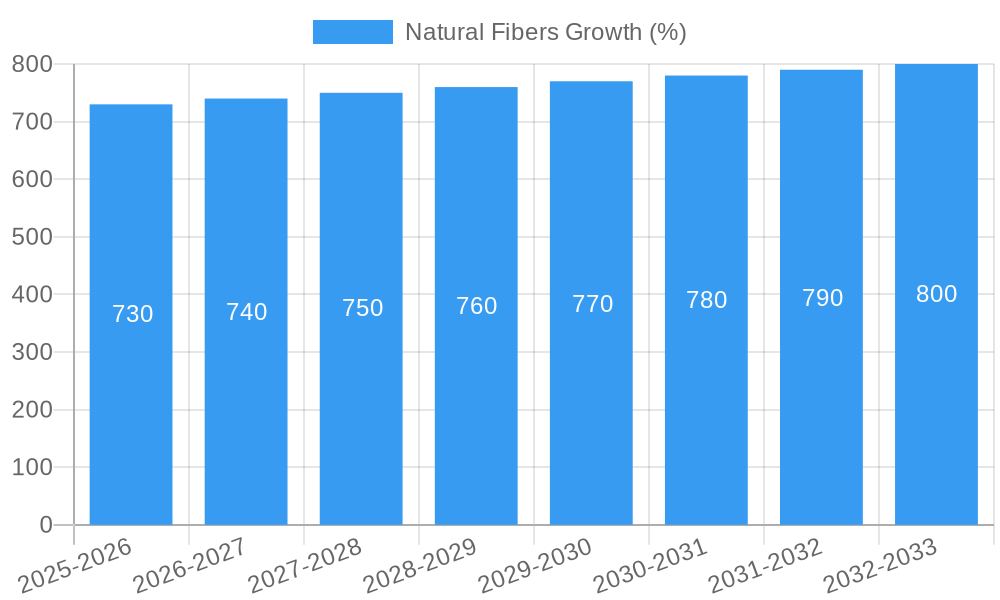
The global natural fibers market, currently valued at approximately $60.87 billion (2025), is projected to exhibit a modest Compound Annual Growth Rate (CAGR) of 1.3% from 2025 to 2033. This relatively slow growth reflects a complex interplay of factors. While increasing consumer demand for sustainable and eco-friendly materials drives the market, challenges remain. Fluctuations in raw material prices, particularly cotton, alongside the competitive pressure from synthetic fibers, hinder significant expansion. Furthermore, the market is impacted by agricultural yields and climate change effects on crop production. The growth is likely to be driven by increased demand from the textile industry, particularly in emerging economies experiencing rapid industrialization and urbanization. Specific segments within natural fibers, such as organic cotton and sustainably sourced materials, are likely to witness higher growth rates compared to the overall market, driven by escalating consumer awareness of environmental issues and ethical sourcing practices. Key players like XPCC, China National Cotton Group, and Louis Dreyfus are strategically positioned to leverage these trends through innovation in processing, supply chain management, and the development of value-added products.
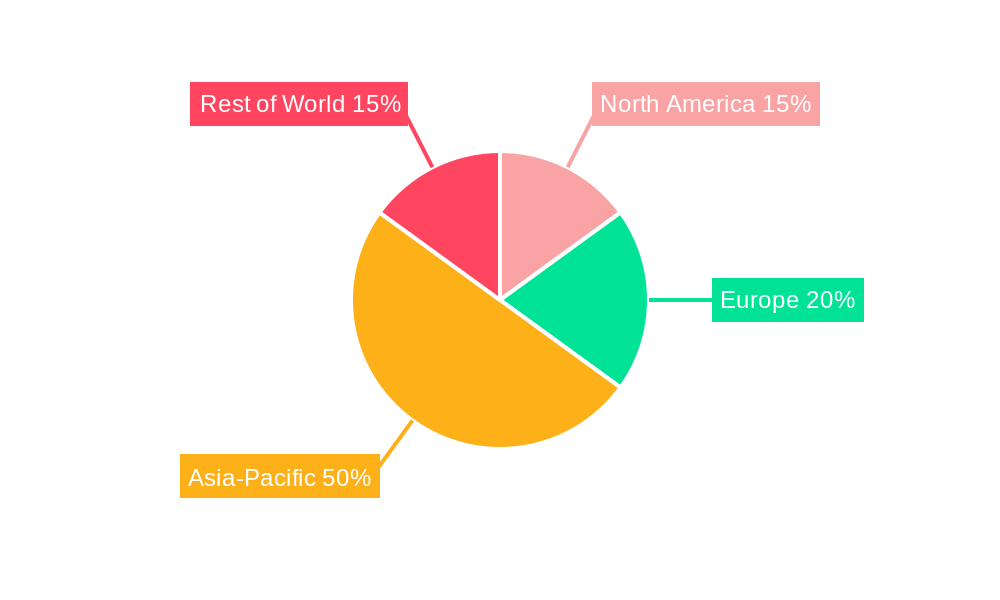
Growth in the natural fibers market will be regionally diverse. While mature markets in North America and Europe may show slower growth, developing economies in Asia-Pacific are anticipated to witness comparatively higher demand, contributing significantly to overall market expansion. The market's competitive landscape is characterized by both large multinational corporations and smaller, specialized players. Success will increasingly depend on factors like efficient resource management, sustainability certifications, and the ability to cater to niche market demands for specific types of natural fibers, such as those with superior performance characteristics. The continued growth will hinge on the effective mitigation of challenges related to price volatility and climate change-induced disruptions in agricultural production.
Dynamic Natural Fibers Market Report: 2019-2033 Forecast
This comprehensive report provides a detailed analysis of the global natural fibers market, offering invaluable insights for industry stakeholders, investors, and strategic decision-makers. Leveraging extensive research and data spanning the period 2019-2033, this report illuminates market trends, competitive dynamics, and future growth prospects, specifically focusing on the estimated year 2025. The report features a meticulous analysis of key players including XPCC, China National Cotton Group, Louis Dreyfus, Hunan Yinhua, Shandong Binzhou Nongxi, Barnhardt Natural Fibers Group, Grasim Industries Limited, Chinatex, and Ruyi Group, along with projections extending to 2033. The market's value is projected to reach xx million by 2033.
Natural Fibers Market Structure & Competitive Landscape
The global natural fibers market exhibits a moderately concentrated structure, with the top five players controlling approximately xx% of the market share in 2025. This concentration is expected to slightly decrease by 2033, driven by increased participation from smaller, specialized players and regional producers. Innovation is a key driver, with companies focusing on developing sustainable and high-performance natural fiber products. Regulatory impacts, particularly concerning environmental sustainability and labor practices, are significant, influencing production costs and market access. Substitute materials, such as synthetic fibers, pose a constant competitive challenge, leading to increasing demands for natural fibers' unique properties (e.g., biodegradability, breathability). The market shows significant end-user segmentation, catering to diverse applications in the textile, apparel, automotive, construction, and industrial sectors. M&A activity has been moderate in recent years, with xx major transactions recorded between 2019 and 2024, indicating a potential for consolidation in the coming years.
Natural Fibers Market Trends & Opportunities
The global natural fibers market is poised for significant growth, with a projected CAGR of xx% during the forecast period (2025-2033). This growth is primarily driven by increasing consumer demand for sustainable and eco-friendly products, coupled with rising awareness of the environmental impact of synthetic fibers. Technological advancements in fiber processing and modification are enhancing the performance characteristics of natural fibers, making them more competitive against synthetic alternatives. The market is witnessing a notable shift towards premium and specialized natural fibers, reflecting evolving consumer preferences for high-quality, sustainable products. Competitive dynamics are intensifying, with companies investing heavily in research and development, expanding their product portfolios, and pursuing strategic partnerships to secure their market position. Market penetration rates are expected to increase significantly, driven by expanding applications in new industries and regions. The market value is expected to reach xx million by 2033.
Dominant Markets & Segments in Natural Fibers
The Asia-Pacific region currently dominates the global natural fibers market, accounting for approximately xx% of the total market value in 2025. This dominance is largely attributed to the region's extensive cotton production, coupled with its significant textile and apparel industries.
Key Growth Drivers in Asia-Pacific:
- Favorable government policies supporting agricultural development and textile manufacturing.
- Robust infrastructure facilitating efficient production and distribution.
- Large and growing consumer base with increasing disposable incomes.
China holds a significant portion of the market share, reflecting its substantial production capacity and strong domestic demand. However, other countries such as India and Vietnam are demonstrating strong growth potential, fueled by increasing investment in the natural fibers sector. Cotton remains the dominant segment, representing xx% of the total market value in 2025, with other important segments including flax, hemp, and jute. The market value of these segments combined is expected to reach xx million by 2033.
Natural Fibers Product Analysis
Recent innovations in natural fiber processing have led to the development of high-performance materials with enhanced durability, strength, and functionality. These advancements include advancements in spinning, weaving, and finishing technologies that improve the versatility and quality of natural fibers. These innovations have expanded applications across various industries, creating new opportunities for growth and market penetration. The competitive advantage increasingly lies in the ability to provide sustainable, high-quality natural fibers that meet stringent performance requirements.
Key Drivers, Barriers & Challenges in Natural Fibers
Key Drivers:
- Growing consumer preference for sustainable and eco-friendly products.
- Technological advancements improving fiber properties and processing.
- Government initiatives supporting the use of natural fibers in various sectors.
Challenges and Restraints:
Supply chain vulnerabilities, particularly regarding raw material sourcing and price fluctuations, represent a significant challenge, alongside intense competition from synthetic fibers, and the complexity of navigating various international regulations regarding environmental sustainability and labor practices. These factors can significantly impact production costs and market access, particularly for smaller players. The market is further challenged by fluctuating demand influenced by global economic factors and changes in consumer preferences.
Growth Drivers in the Natural Fibers Market
The increasing demand for sustainable products, coupled with technological advancements enhancing the performance of natural fibers, fuels market growth. Government policies promoting eco-friendly materials and supporting the agricultural sector further drive expansion. The rising disposable incomes in emerging economies also contribute to increasing consumption of natural fiber products.
Challenges Impacting Natural Fibers Growth
The market faces challenges from fluctuating raw material prices, intense competition from synthetic alternatives, and supply chain disruptions. Stringent environmental regulations and the need for sustainable sourcing strategies add complexity to production and operations. These factors impact profitability and competitiveness within the natural fibers industry.
Key Players Shaping the Natural Fibers Market
- XPCC
- China National Cotton Group
- Louis Dreyfus
- Hunan Yinhua
- Shandong Binzhou Nongxi
- Barnhardt Natural Fibers Group
- Grasim Industries Limited
- Chinatex
- Ruyi Group
Significant Natural Fibers Industry Milestones
- 2020: Introduction of a new biodegradable cotton blend by XPCC.
- 2021: China National Cotton Group invests in sustainable farming practices.
- 2022: Louis Dreyfus partners with a technology company to improve fiber processing efficiency.
- 2023: Barnhardt Natural Fibers Group launches a new line of high-performance natural fiber fabrics.
Future Outlook for Natural Fibers Market
The natural fibers market anticipates sustained growth, driven by increasing consumer demand for sustainable and eco-friendly alternatives to synthetic materials. Strategic opportunities lie in innovation, particularly in developing high-performance natural fibers suitable for a wider range of applications. The market's future is promising, with substantial potential for expansion in both established and emerging markets. The combined market value across all segments is expected to exceed xx million by 2033.
Natural Fibers Segmentation
-
1. Application
- 1.1. Apparel
- 1.2. Home Textiles
- 1.3. Industrial Textiles
- 1.4. Others
-
2. Types
- 2.1. Cotton
- 2.2. Wool
- 2.3. Other
Natural Fibers Segmentation By Geography
-
1. North America
- 1.1. United States
- 1.2. Canada
- 1.3. Mexico
-
2. South America
- 2.1. Brazil
- 2.2. Argentina
- 2.3. Rest of South America
-
3. Europe
- 3.1. United Kingdom
- 3.2. Germany
- 3.3. France
- 3.4. Italy
- 3.5. Spain
- 3.6. Russia
- 3.7. Benelux
- 3.8. Nordics
- 3.9. Rest of Europe
-
4. Middle East & Africa
- 4.1. Turkey
- 4.2. Israel
- 4.3. GCC
- 4.4. North Africa
- 4.5. South Africa
- 4.6. Rest of Middle East & Africa
-
5. Asia Pacific
- 5.1. China
- 5.2. India
- 5.3. Japan
- 5.4. South Korea
- 5.5. ASEAN
- 5.6. Oceania
- 5.7. Rest of Asia Pacific
Natural Fibers REPORT HIGHLIGHTS
| Aspects | Details |
|---|---|
| Study Period | 2019-2033 |
| Base Year | 2024 |
| Estimated Year | 2025 |
| Forecast Period | 2025-2033 |
| Historical Period | 2019-2024 |
| Growth Rate | CAGR of 1.3% from 2019-2033 |
| Segmentation |
|
Table of Contents
- 1. Introduction
- 1.1. Research Scope
- 1.2. Market Segmentation
- 1.3. Research Methodology
- 1.4. Definitions and Assumptions
- 2. Executive Summary
- 2.1. Introduction
- 3. Market Dynamics
- 3.1. Introduction
- 3.2. Market Drivers
- 3.3. Market Restrains
- 3.4. Market Trends
- 4. Market Factor Analysis
- 4.1. Porters Five Forces
- 4.2. Supply/Value Chain
- 4.3. PESTEL analysis
- 4.4. Market Entropy
- 4.5. Patent/Trademark Analysis
- 5. Global Natural Fibers Analysis, Insights and Forecast, 2019-2031
- 5.1. Market Analysis, Insights and Forecast - by Application
- 5.1.1. Apparel
- 5.1.2. Home Textiles
- 5.1.3. Industrial Textiles
- 5.1.4. Others
- 5.2. Market Analysis, Insights and Forecast - by Types
- 5.2.1. Cotton
- 5.2.2. Wool
- 5.2.3. Other
- 5.3. Market Analysis, Insights and Forecast - by Region
- 5.3.1. North America
- 5.3.2. South America
- 5.3.3. Europe
- 5.3.4. Middle East & Africa
- 5.3.5. Asia Pacific
- 5.1. Market Analysis, Insights and Forecast - by Application
- 6. North America Natural Fibers Analysis, Insights and Forecast, 2019-2031
- 6.1. Market Analysis, Insights and Forecast - by Application
- 6.1.1. Apparel
- 6.1.2. Home Textiles
- 6.1.3. Industrial Textiles
- 6.1.4. Others
- 6.2. Market Analysis, Insights and Forecast - by Types
- 6.2.1. Cotton
- 6.2.2. Wool
- 6.2.3. Other
- 6.1. Market Analysis, Insights and Forecast - by Application
- 7. South America Natural Fibers Analysis, Insights and Forecast, 2019-2031
- 7.1. Market Analysis, Insights and Forecast - by Application
- 7.1.1. Apparel
- 7.1.2. Home Textiles
- 7.1.3. Industrial Textiles
- 7.1.4. Others
- 7.2. Market Analysis, Insights and Forecast - by Types
- 7.2.1. Cotton
- 7.2.2. Wool
- 7.2.3. Other
- 7.1. Market Analysis, Insights and Forecast - by Application
- 8. Europe Natural Fibers Analysis, Insights and Forecast, 2019-2031
- 8.1. Market Analysis, Insights and Forecast - by Application
- 8.1.1. Apparel
- 8.1.2. Home Textiles
- 8.1.3. Industrial Textiles
- 8.1.4. Others
- 8.2. Market Analysis, Insights and Forecast - by Types
- 8.2.1. Cotton
- 8.2.2. Wool
- 8.2.3. Other
- 8.1. Market Analysis, Insights and Forecast - by Application
- 9. Middle East & Africa Natural Fibers Analysis, Insights and Forecast, 2019-2031
- 9.1. Market Analysis, Insights and Forecast - by Application
- 9.1.1. Apparel
- 9.1.2. Home Textiles
- 9.1.3. Industrial Textiles
- 9.1.4. Others
- 9.2. Market Analysis, Insights and Forecast - by Types
- 9.2.1. Cotton
- 9.2.2. Wool
- 9.2.3. Other
- 9.1. Market Analysis, Insights and Forecast - by Application
- 10. Asia Pacific Natural Fibers Analysis, Insights and Forecast, 2019-2031
- 10.1. Market Analysis, Insights and Forecast - by Application
- 10.1.1. Apparel
- 10.1.2. Home Textiles
- 10.1.3. Industrial Textiles
- 10.1.4. Others
- 10.2. Market Analysis, Insights and Forecast - by Types
- 10.2.1. Cotton
- 10.2.2. Wool
- 10.2.3. Other
- 10.1. Market Analysis, Insights and Forecast - by Application
- 11. Competitive Analysis
- 11.1. Global Market Share Analysis 2024
- 11.2. Company Profiles
- 11.2.1 XPCC
- 11.2.1.1. Overview
- 11.2.1.2. Products
- 11.2.1.3. SWOT Analysis
- 11.2.1.4. Recent Developments
- 11.2.1.5. Financials (Based on Availability)
- 11.2.2 China National Cotton Group
- 11.2.2.1. Overview
- 11.2.2.2. Products
- 11.2.2.3. SWOT Analysis
- 11.2.2.4. Recent Developments
- 11.2.2.5. Financials (Based on Availability)
- 11.2.3 Louis Dreyfus
- 11.2.3.1. Overview
- 11.2.3.2. Products
- 11.2.3.3. SWOT Analysis
- 11.2.3.4. Recent Developments
- 11.2.3.5. Financials (Based on Availability)
- 11.2.4 Hunan Yinhua
- 11.2.4.1. Overview
- 11.2.4.2. Products
- 11.2.4.3. SWOT Analysis
- 11.2.4.4. Recent Developments
- 11.2.4.5. Financials (Based on Availability)
- 11.2.5 Shandong Binzhou Nongxi
- 11.2.5.1. Overview
- 11.2.5.2. Products
- 11.2.5.3. SWOT Analysis
- 11.2.5.4. Recent Developments
- 11.2.5.5. Financials (Based on Availability)
- 11.2.6 Barnhardt Natural Fibers Group
- 11.2.6.1. Overview
- 11.2.6.2. Products
- 11.2.6.3. SWOT Analysis
- 11.2.6.4. Recent Developments
- 11.2.6.5. Financials (Based on Availability)
- 11.2.7 Grasim Industries Limited
- 11.2.7.1. Overview
- 11.2.7.2. Products
- 11.2.7.3. SWOT Analysis
- 11.2.7.4. Recent Developments
- 11.2.7.5. Financials (Based on Availability)
- 11.2.8 Chinatex
- 11.2.8.1. Overview
- 11.2.8.2. Products
- 11.2.8.3. SWOT Analysis
- 11.2.8.4. Recent Developments
- 11.2.8.5. Financials (Based on Availability)
- 11.2.9 Ruyi Group
- 11.2.9.1. Overview
- 11.2.9.2. Products
- 11.2.9.3. SWOT Analysis
- 11.2.9.4. Recent Developments
- 11.2.9.5. Financials (Based on Availability)
- 11.2.1 XPCC
List of Figures
- Figure 1: Global Natural Fibers Revenue Breakdown (million, %) by Region 2024 & 2032
- Figure 2: North America Natural Fibers Revenue (million), by Application 2024 & 2032
- Figure 3: North America Natural Fibers Revenue Share (%), by Application 2024 & 2032
- Figure 4: North America Natural Fibers Revenue (million), by Types 2024 & 2032
- Figure 5: North America Natural Fibers Revenue Share (%), by Types 2024 & 2032
- Figure 6: North America Natural Fibers Revenue (million), by Country 2024 & 2032
- Figure 7: North America Natural Fibers Revenue Share (%), by Country 2024 & 2032
- Figure 8: South America Natural Fibers Revenue (million), by Application 2024 & 2032
- Figure 9: South America Natural Fibers Revenue Share (%), by Application 2024 & 2032
- Figure 10: South America Natural Fibers Revenue (million), by Types 2024 & 2032
- Figure 11: South America Natural Fibers Revenue Share (%), by Types 2024 & 2032
- Figure 12: South America Natural Fibers Revenue (million), by Country 2024 & 2032
- Figure 13: South America Natural Fibers Revenue Share (%), by Country 2024 & 2032
- Figure 14: Europe Natural Fibers Revenue (million), by Application 2024 & 2032
- Figure 15: Europe Natural Fibers Revenue Share (%), by Application 2024 & 2032
- Figure 16: Europe Natural Fibers Revenue (million), by Types 2024 & 2032
- Figure 17: Europe Natural Fibers Revenue Share (%), by Types 2024 & 2032
- Figure 18: Europe Natural Fibers Revenue (million), by Country 2024 & 2032
- Figure 19: Europe Natural Fibers Revenue Share (%), by Country 2024 & 2032
- Figure 20: Middle East & Africa Natural Fibers Revenue (million), by Application 2024 & 2032
- Figure 21: Middle East & Africa Natural Fibers Revenue Share (%), by Application 2024 & 2032
- Figure 22: Middle East & Africa Natural Fibers Revenue (million), by Types 2024 & 2032
- Figure 23: Middle East & Africa Natural Fibers Revenue Share (%), by Types 2024 & 2032
- Figure 24: Middle East & Africa Natural Fibers Revenue (million), by Country 2024 & 2032
- Figure 25: Middle East & Africa Natural Fibers Revenue Share (%), by Country 2024 & 2032
- Figure 26: Asia Pacific Natural Fibers Revenue (million), by Application 2024 & 2032
- Figure 27: Asia Pacific Natural Fibers Revenue Share (%), by Application 2024 & 2032
- Figure 28: Asia Pacific Natural Fibers Revenue (million), by Types 2024 & 2032
- Figure 29: Asia Pacific Natural Fibers Revenue Share (%), by Types 2024 & 2032
- Figure 30: Asia Pacific Natural Fibers Revenue (million), by Country 2024 & 2032
- Figure 31: Asia Pacific Natural Fibers Revenue Share (%), by Country 2024 & 2032
List of Tables
- Table 1: Global Natural Fibers Revenue million Forecast, by Region 2019 & 2032
- Table 2: Global Natural Fibers Revenue million Forecast, by Application 2019 & 2032
- Table 3: Global Natural Fibers Revenue million Forecast, by Types 2019 & 2032
- Table 4: Global Natural Fibers Revenue million Forecast, by Region 2019 & 2032
- Table 5: Global Natural Fibers Revenue million Forecast, by Application 2019 & 2032
- Table 6: Global Natural Fibers Revenue million Forecast, by Types 2019 & 2032
- Table 7: Global Natural Fibers Revenue million Forecast, by Country 2019 & 2032
- Table 8: United States Natural Fibers Revenue (million) Forecast, by Application 2019 & 2032
- Table 9: Canada Natural Fibers Revenue (million) Forecast, by Application 2019 & 2032
- Table 10: Mexico Natural Fibers Revenue (million) Forecast, by Application 2019 & 2032
- Table 11: Global Natural Fibers Revenue million Forecast, by Application 2019 & 2032
- Table 12: Global Natural Fibers Revenue million Forecast, by Types 2019 & 2032
- Table 13: Global Natural Fibers Revenue million Forecast, by Country 2019 & 2032
- Table 14: Brazil Natural Fibers Revenue (million) Forecast, by Application 2019 & 2032
- Table 15: Argentina Natural Fibers Revenue (million) Forecast, by Application 2019 & 2032
- Table 16: Rest of South America Natural Fibers Revenue (million) Forecast, by Application 2019 & 2032
- Table 17: Global Natural Fibers Revenue million Forecast, by Application 2019 & 2032
- Table 18: Global Natural Fibers Revenue million Forecast, by Types 2019 & 2032
- Table 19: Global Natural Fibers Revenue million Forecast, by Country 2019 & 2032
- Table 20: United Kingdom Natural Fibers Revenue (million) Forecast, by Application 2019 & 2032
- Table 21: Germany Natural Fibers Revenue (million) Forecast, by Application 2019 & 2032
- Table 22: France Natural Fibers Revenue (million) Forecast, by Application 2019 & 2032
- Table 23: Italy Natural Fibers Revenue (million) Forecast, by Application 2019 & 2032
- Table 24: Spain Natural Fibers Revenue (million) Forecast, by Application 2019 & 2032
- Table 25: Russia Natural Fibers Revenue (million) Forecast, by Application 2019 & 2032
- Table 26: Benelux Natural Fibers Revenue (million) Forecast, by Application 2019 & 2032
- Table 27: Nordics Natural Fibers Revenue (million) Forecast, by Application 2019 & 2032
- Table 28: Rest of Europe Natural Fibers Revenue (million) Forecast, by Application 2019 & 2032
- Table 29: Global Natural Fibers Revenue million Forecast, by Application 2019 & 2032
- Table 30: Global Natural Fibers Revenue million Forecast, by Types 2019 & 2032
- Table 31: Global Natural Fibers Revenue million Forecast, by Country 2019 & 2032
- Table 32: Turkey Natural Fibers Revenue (million) Forecast, by Application 2019 & 2032
- Table 33: Israel Natural Fibers Revenue (million) Forecast, by Application 2019 & 2032
- Table 34: GCC Natural Fibers Revenue (million) Forecast, by Application 2019 & 2032
- Table 35: North Africa Natural Fibers Revenue (million) Forecast, by Application 2019 & 2032
- Table 36: South Africa Natural Fibers Revenue (million) Forecast, by Application 2019 & 2032
- Table 37: Rest of Middle East & Africa Natural Fibers Revenue (million) Forecast, by Application 2019 & 2032
- Table 38: Global Natural Fibers Revenue million Forecast, by Application 2019 & 2032
- Table 39: Global Natural Fibers Revenue million Forecast, by Types 2019 & 2032
- Table 40: Global Natural Fibers Revenue million Forecast, by Country 2019 & 2032
- Table 41: China Natural Fibers Revenue (million) Forecast, by Application 2019 & 2032
- Table 42: India Natural Fibers Revenue (million) Forecast, by Application 2019 & 2032
- Table 43: Japan Natural Fibers Revenue (million) Forecast, by Application 2019 & 2032
- Table 44: South Korea Natural Fibers Revenue (million) Forecast, by Application 2019 & 2032
- Table 45: ASEAN Natural Fibers Revenue (million) Forecast, by Application 2019 & 2032
- Table 46: Oceania Natural Fibers Revenue (million) Forecast, by Application 2019 & 2032
- Table 47: Rest of Asia Pacific Natural Fibers Revenue (million) Forecast, by Application 2019 & 2032
Frequently Asked Questions
1. What is the projected Compound Annual Growth Rate (CAGR) of the Natural Fibers?
The projected CAGR is approximately 1.3%.
2. Which companies are prominent players in the Natural Fibers?
Key companies in the market include XPCC, China National Cotton Group, Louis Dreyfus, Hunan Yinhua, Shandong Binzhou Nongxi, Barnhardt Natural Fibers Group, Grasim Industries Limited, Chinatex, Ruyi Group.
3. What are the main segments of the Natural Fibers?
The market segments include Application, Types.
4. Can you provide details about the market size?
The market size is estimated to be USD 60870 million as of 2022.
5. What are some drivers contributing to market growth?
N/A
6. What are the notable trends driving market growth?
N/A
7. Are there any restraints impacting market growth?
N/A
8. Can you provide examples of recent developments in the market?
N/A
9. What pricing options are available for accessing the report?
Pricing options include single-user, multi-user, and enterprise licenses priced at USD 4900.00, USD 7350.00, and USD 9800.00 respectively.
10. Is the market size provided in terms of value or volume?
The market size is provided in terms of value, measured in million.
11. Are there any specific market keywords associated with the report?
Yes, the market keyword associated with the report is "Natural Fibers," which aids in identifying and referencing the specific market segment covered.
12. How do I determine which pricing option suits my needs best?
The pricing options vary based on user requirements and access needs. Individual users may opt for single-user licenses, while businesses requiring broader access may choose multi-user or enterprise licenses for cost-effective access to the report.
13. Are there any additional resources or data provided in the Natural Fibers report?
While the report offers comprehensive insights, it's advisable to review the specific contents or supplementary materials provided to ascertain if additional resources or data are available.
14. How can I stay updated on further developments or reports in the Natural Fibers?
To stay informed about further developments, trends, and reports in the Natural Fibers, consider subscribing to industry newsletters, following relevant companies and organizations, or regularly checking reputable industry news sources and publications.
Methodology
Step 1 - Identification of Relevant Samples Size from Population Database


Step 2 - Approaches for Defining Global Market Size (Value, Volume* & Price*)

Note*: In applicable scenarios
Step 3 - Data Sources
Primary Research
- Web Analytics
- Survey Reports
- Research Institute
- Latest Research Reports
- Opinion Leaders
Secondary Research
- Annual Reports
- White Paper
- Latest Press Release
- Industry Association
- Paid Database
- Investor Presentations

Step 4 - Data Triangulation
Involves using different sources of information in order to increase the validity of a study
These sources are likely to be stakeholders in a program - participants, other researchers, program staff, other community members, and so on.
Then we put all data in single framework & apply various statistical tools to find out the dynamic on the market.
During the analysis stage, feedback from the stakeholder groups would be compared to determine areas of agreement as well as areas of divergence
